UNITED STATES
SECURITIES AND EXCHANGE COMMISSION
Washington, D.C. 20549
FORM N-CSR
CERTIFIED SHAREHOLDER REPORT OF REGISTERED
MANAGEMENT INVESTMENT COMPANY
Investment Company Act file number 811-07074
|
|
180 DEGREE CAPITAL CORP. |
(Exact Name of Registrant as Specified in Its Charter) |
|
| | |
7 N. Willow Street, Suite 4B, Montclair NJ | | 07042 |
(Address of Principal Executive Offices) | | (Zip Code) |
|
|
Daniel B. Wolfe President and Chief Financial Officer 180 Degree Capital Corp. 7 N. Willow Street, Suite 4B Montclair, NJ 07042 |
(Name and address of agent for service) |
|
Copy to: John J. Mahon, Esq. Schulte Roth & Zabel, LLP 1152 Fifteenth Street, NW Suite 850 Washington, DC 20005 (202) 729-7477 |
Registrant's telephone number, including area code: (973) 746-4500
Date of fiscal year end: December 31
Date of reporting period: December 31, 2018
Beginning on January 1, 2021, and as permitted by a rule adopted by the Securities and Exchange Commission, paper copies of the Company's shareholder reports like this one will no longer be sent to you by mail, unless you specifically request that the Company or your financial intermediary (i.e., the broker-dealer or bank through which you own your shares) send you paper copies of these reports. Instead, shareholder reports will be made available on a website, and you will be notified by mail each time a report is posted and will be provided with a website link to access the report.
If you already have elected to receive shareholder reports electronically, you will not be affected by this change and need not take any action. You may elect to receive electronic delivery of shareholder reports and other communications from the Company by contacting the Company at 833-293-1769 or, if you own your shares through a financial intermediary, by contacting your financial intermediary.
You may elect to receive all future shareholder reports of the Company in paper free of charge. You can inform the Company that you wish to continue receiving paper copies of your shareholder reports by contacting the Company at 833-293-1769. If you own shares through a financial intermediary, you may contact your financial intermediary or follow instructions included with this document to elect to continue to receive paper copies of your shareholder reports.
Item 1. Report to Shareholders.
Fellow Shareholders,
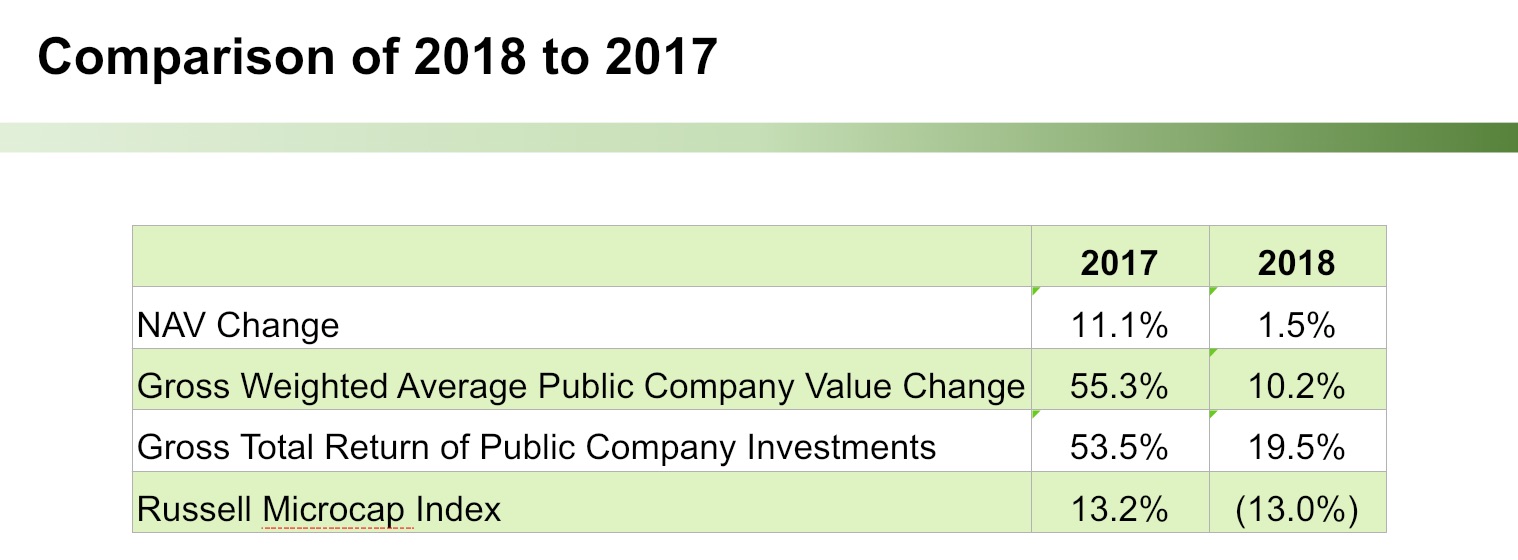
Creating long-term wealth centers around two key factors: 1. Making hay when the sun shines, and 2. Preserving capital during years where there is significant market duress. Over the course of the last two years, the United States stock market has given us two very different backdrops. As a matter of fact, the two years were an almost exact polar opposite of each other. In 2018, the Russell Microcap Index was down 13.0%. In 2017, the Russell Microcap Index was up 13.2%.
Our investment strategy is centered on providing value-added assistance through constructive activism to small public companies. To that end, over the course of the last two years, we have delivered a gross total return in our public holdings of 53.5% in 2017 and 19.5% in 2018.1 Our public market investing gross total return would place us in the top decile in the comparable Lipper category for microcap focused funds. As you know, we inherited the 61% of our current net assets that are in private companies, and our returns for that category have been more muted versus our public holdings. After taking into consideration our private portfolio and our reduced expense structure, 180 Degree Capital Corp. ("180" or the "Fund") delivered an 11.1% growth in our net asset value per share (“NAV”) in 2017 and 1.5% growth in 2018.
In 2017, we generated a nearly 4x gross total return in our public holdings versus the comparable indices. That was fun. 2018 was equally important. It was a lot less fun for sure, but almost more important. If you told me in the beginning of the year that the market would be down 13%, I would have signed on to our Fund’s nearly 20% gross total return in our public holdings and a 1.5% gain in our NAV. In some ways, I may be more satisfied with our 2018 performance than I was in 2017. Now don’t get me wrong, there were plenty of lessons to have been learned from 2018, and we gave back nearly 600 basis points of NAV in the fourth quarter. Interest rate fears, global trade tensions between the United States and China, and slowing global growth led to a market sell-off in the fourth quarter. The S&P 500 was down 13.5% in the quarter and the Russell Microcap Index declined by 22.2%. For the first time ever, the S&P 500 ended the year with a loss after being positive for the first three quarters. The December 9% decline in the S&P 500 was the second worst December ever and the worst since 1931, during the Great Depression. As always, selling begets selling begets selling. In the fourth quarter, according to HFR Global Hedge Fund Report, investors redeemed $22.5 billion from hedge funds, while Lipper reported $57 billion in redemptions from equity funds. These massive withdrawals exacerbated an already weakened market. In fact, despite legitimate macro concerns, the biggest surprise to market participants was the timing and suddenness in what is usually the strongest quarter of the year.
To be clear, we believe there are real concerns to be mindful of; the most worrisome for us being the dislocation of the technology supply chain resulting primarily from the continued trade war with China. But we believe the market overshot the concerns. We used the 20% correction and market dislocation to add to both current and new names, investing approximately 27% of our starting cash in the quarter. Additionally important for our success in 2019, is that in order to make money, you need to have money. We started 2019 with more cash and public holdings than we had starting in 2018.
NET ASSET VALUE PER SHARE
Our NAV decreased this quarter from $2.81 to $2.64, a 6.0% decrease. With this decrease in NAV, our year-to-date increase in NAV stands at 1.5% or $0.04 per share. Our Fund has three principal components to the variance in our NAV: our public portfolio, our private portfolio, and our expenses. For the quarter, our public portfolio companies reduced our NAV by $0.16 while our private portfolio companies subtracted $0.01. Operating expenses, exclusive of bonus accruals and net of income, negatively impacted NAV by $0.02. We had a $0.02 gain from a reversal of an accrual we established earlier in the year for a potential bonus pool in 2018. Remember what we have said in the past about compensation; if our shareholders benefit from achieving meaningful NAV growth, our management team will share in that reward, and if not, there will be no bonus for our management team. In the prior two quarters, we began to accrue for a potential bonus pool based on multiple metrics assessed by the Compensation Committee of our Board, including the strength in our NAV growth for the first three quarters. With most of the 2018 gains in NAV reversed in Q4, we recommended, and the Compensation Committee agreed, that there will be no bonus pool for 2018. As such, we reversed the accrual.
______________________
1 Past performance is not an indication or guarantee of future performance. Amounts gross unrealized and realized total returns compounded on a quarterly basis. 180 Degree Capital Corp. is an internally managed registered closed end fund and does not have an external manager that is paid fees based on assets and/or returns. 180 also has more than 50 percent of its investment portfolio in legacy privately held investments. Please see its filings with the SEC, including its 2018 Annual Report filed on Form N-CSR for information on its expenses and expense ratios.
Public Portfolio
Nearly two year ago, we embarked on a new strategy to invest in small public companies. Over the course of the last two years, we have added $0.45 of NAV from our investments in public companies. Over that same period of time, we generated $0.08 of NAV growth from our private portfolio. 180’s shareholders have clearly benefited from our strategy change. That said, Q4 saw a pullback in the value of our public market holdings. Let’s dig into the sources of this pullback:
| |
– | Adesto Technologies Corporation (NASDAQ: IOTS) had been on an uptrend through Q2 2018. As the stock reached a price that we believed made it fully valued, we sold 62% of our position during Q2 at an average price of $8.81. As we mentioned in last quarter’s letter, the company announced two separate acquisitions. In May of 2018, IOTS acquired S3 Semiconductors, a mixed-signal ASIC company. This acquisition materially increases the total addressable market for IOTS and provides additional geographies for IOTS's products in industrial Internet of Things (“IoT”) applications. IOTS followed up that acquisition with the purchase of Echelon, a company focused on developing open-standard control networking platforms. These two deals have completely transformed IOTS from a specialty memory company into a leading provider of innovative, application-specific semiconductors and embedded systems that comprise the essential building blocks of IoT edge devices. Unfortunately, IOTS coupled these announcements with a disappointing Q2 2018 financial report followed by a $40 million equity raise at $6.00 per share. The fourth quarter saw significant deterioration in the entire semiconductor space due to excess inventory and concerns of a continued trade war with China. We have nearly doubled our position since exiting Q2 2018 at an average cost of $5.21. We believe the inventory overhang will dissipate as 2019 unfolds and expect IOTS to achieve notable revenue and cost synergies from its recent two acquisitions. For the quarter, IOTS reduced our NAV by $0.05. |
| |
– | Mersana Therapeutics, Inc. (NASDAQ: MRSN) is biotech company that produces novel drug conjugates. It specializes in oncology agents for the treatment of tumors and cancer. As everyone knows, there is tremendous volatility for a biotech company that is currently in the middle of clinical trials. In Q3 2018, one patient in one of MRSN's trials died, possibly from side effects of the drug, and the stock collapsed to $10 per share when the trial was put on partial clinical hold. Although MRSN announced that the U.S. Food and Drug Administration lifted the partial clinical hold, the stock continued its decline in Q4 2018. We note that the NASDAQ Biotechnology Index declined 21% in Q4 2018. Most early stage biotech companies either burn cash or are in need of raising cash to fund expensive clinical trials. During a bear market, like the one we saw in Q4 2018, investors flee from the speculative biotech sector. In the case of MRSN, there was no significant news during the quarter. For the quarter, MRSN reduced our NAV by $0.05. |
| |
– | TheStreet, Inc. (NASDAQ: TST) has been a successful investment for our shareholders. A year ago, we helped TST retire its preferred stock at a significant discount, and we joined the board of directors. In the first half of 2018, TST sold its deposit and loan data collection subsidiary, RateWatch, to S&P Global for $33.5 million. In this last quarter, TST sold the rest of its institutional businesses, BoardEx and The Deal, to Euromoney Institutional Investor for $87.3 million.TST stated it plans to return a significant portion of the proceeds from these sales and its available cash in the form of a special distribution. Additionally, TST continues to look at strategic alternatives for its remaining consumer businesses. Since the announcement of our significant investment in the fall of 2017, the stock is up 100%. In the fourth quarter, the stock trended down with the overall market, only to rally significantly following the sale announcement. TST's year-end close of $2.03 was less than the projected cash per share of $2.14 to $2.23. TST is our signature investment for how we define constructive activism. For the quarter, TST reduced our NAV by $0.03. |
| |
– | Airgain, Inc. (NASDAQ: AIRG) is a provider of advanced antenna technologies used to enable high performance wireless networking across a broad range of devices and markets, including connected home, enterprise, automotive, and IoT. We bought the stock following a CEO change and a new commitment to move quickly on not only product refresh cycles, but also on operating expense reductions and a focus on profitable growth. Unfortunately, this past quarter, AIRG came under pressure against the backdrop of very weak technology sector performance. Despite this pressure, the underlying secular uptrend of increased rollouts of technologies that enable high-speed wireless communications is gaining momentum and plays to the strengths of AIRG; that is, increasing speeds require high-quality, complex antennas. For the quarter, AIRG reduced our NAV by $0.02. |
| |
– | Emcore Corporation (NASDAQ: EMKR) is a provider of advanced mixed-signal optics products that provide the foundation for today’s high-speed communication network infrastructures and leading-edge defense systems. EMKR had a myriad of recent revenue challenges in its CATV (community access television, or cable) business, including inventory corrections at one of its largest customers. Essentially, this customer over-ordered in 2017, and as a result, had a dramatic decline in its ordering pattern in 2018. It has been our view this inventory correction would dissipate by fiscal year 2018 fourth quarter (September 30) and EMKR's visibility to future revenues and growth would resume. That view proved accurate. At the same time, EMKR's state-of-the-art Fiber Optic Gyroscope (“FOG”) products are designed for fast, accurate navigation and gyrocompassing, and low noise, line of sight stabilization. These FOG products are critical components of high-performance drones and other systems where highly accurate navigation is critical. Like AIRG and IOTS, EMKR suffered with the rest of the market and technology meltdown. With an enterprise value of less than 1x revenues and with approximately half the market capitalization of EMKR in cash, we believe the stock has a favorable risk-reward profile. For the quarter, EMKR reduced our NAV by $0.01. |
| |
– | Lantronix, Inc. (NASDAQ: LTRX) is a global provider of secure data access and management solutions for IoT assets. The IoT gateway market (75% of LTRX sales) is experiencing strong growth as businesses are becoming increasingly connected. Following years of declining revenues and net losses, a new management team took over in 2015 and embarked on a dramatic turnaround of the business. In its most recent earnings report, LTRX pointed to the expectation of nearly double-digit revenue growth in the upcoming quarters. We participated in a secondary offering in Q3 2018 that strengthened LTRX’s balance sheet and gave it firepower to make strategic and accretive acquisitions. Unfortunately, like almost every other technology stock, and despite no negative company specific news, the stock sold off in Q4 2018. For the quarter, LTRX reduced our NAV by $0.01. |
| |
– | Synacor, Inc. (NASDAQ: SYNC) is a holding we have discussed extensively in our communications with shareholders. The issue at SYNC isn’t fundamental problems with its overall business; it is rather a management credibility issue resulting from the company historically and consistently over-promising and under-delivering. Approximately 40% of SYNC's revenues are recurring and fee-based from its email and Cloud ID businesses. Investors typically pay a minimum of 1x recurring revenues, and in many cases, significantly higher multiples if such revenues are coupled with high margins and growth rates. SYNC's management team has made considerable strides in improving its business. For instance, EBITDA is expected to increase from $2.3 million in 2017 to $7.7 million in 2018. Unfortunately, last August, AT&T (SYNC's largest individual customer), delivered notice to SYNC that it would not automatically renew an expiring contract and sought to initiate renewal negotiations on a potential new definitive agreement. While it is not certain how this will turn out, investors viewed this announcement as negative, with many assuming SYNC would lose the AT&T business in its entirety. As such, the stock has traded off 38% following the announcement. Going forward, if SYNC can resolve the AT&T contract renewal uncertainty and execute on its business, we think the stock has meaningful upside. For the quarter, SYNC reduced our NAV by $0.01. |
New position
| |
– | Intermolecular, Inc. (NASDAQ: IMI) provides customers with a platform and multi-disciplinary development team for the research and development of advanced materials in the semiconductor, display, and glass and coatings industries. Coincident with the downturn of the semiconductor sector, we purchased approximately 1.4 million shares at an average cost of $0.94. At that valuation, the stock was trading at approximately 2x the cash on its balance sheet and an enterprise value of 0.67x revenues. IMI announced a slowdown in revenue for Q4 2018 due to the timing of certain program completions as well as a temporary delay in the scheduled commencement of a new program. IMI also announced a new program with a leading semiconductor manufacturer. We believe this new relationship, as well as improved operational efficiencies, will lead to a better 2019. We also note that the sell-off in Q4 2018 was not 100% fundamentally driven. As we noted earlier in this letter, Q4 2018 forced liquidations exacerbated the decline in the overall stock market. In the particular case of IMI, we became aware that its fourth largest shareholder was liquidating its entire IMI holdings. We took advantage of this liquidation. For the quarter, IMI did not materially impact our NAV. |
Deletion
| |
– | PDL BioPharma, Inc. (NASDAQ: PDLI) was a new holding last quarter. We sold our position in PDLI in Q4 2018 for a realized gain of 26.2% in a total holding period of less than 100 days. Our investment thesis centered on our expectation that PDLI's Board and management would use a meaningful portion of the its cash on hand to buy back stock. Subsequent to our investment, the company authorized a $100 million stock repurchase program. As the stock moved directly to our short-term price target, we exited the position. |
Private Portfolio
For the quarter, our private portfolio subtracted $0.01 from our NAV. Positive contributors to NAV were HALE.life, which increased our NAV by $0.01 due to a recent financing, and Black Silicon Holdings and EchoPixel, which increased by a $0.01 each, against the backdrop of improved fundamentals respective to each company. Conversely, D-Wave Systems decreased by $0.02 due to a weakening of the Canadian dollar and NGX Bio decreased by $0.01 as business fundamentals worsened.
We continue to believe in the potential for our most mature companies to build value including, AgBiome, D-Wave Systems, ORIG3N, and Nanosys. There are other companies in the portfolio that also hold promise, however these companies are in early stages of development and the timelines and potential exit values for these companies are highly uncertain. We have often talked about our desire to actively shepherd our existing private portfolio to exits or opportunities to sell our positions in those companies at what we believe are reasonable valuations. As a reminder, on July 5, 2018, we sold our entire position in HZO to undisclosed buyers for $7 million, an 8% premium to its value as of March 31, 2018, but lower than our cost basis of $9.1 million. This significant event both helped us de-risk our private portfolio while also giving us more cash to invest in our core strategy of investing in small public companies. We also note that in January 2019, we sold our convertible bridge note in Genome Profiling for $230,000 realizing a 20% gain on the investment through payment of interest over our holding period.
Expenses
As we have noted, we have dramatically reduced our cost structure under our new strategy. In 2016, before our Fund’s change in investment focus and management, our operating expenses, excluding stock-based compensation and interest on outstanding debt, averaged $1.3 million per quarter. For Q4 2018, our operating expenses excluding 2017 deferred bonus accruals equaled approximately $587,000. Our total operating expenses excluding 2017-related bonus accruals declined approximately $200,000 from $3.1 million in 2017 to $2.9 million in 2018. Including sub-lease income, our operating expenses net of such income declined $300,000 year-over-year. We remain committed to treating every dollar of shareholder money with the utmost care and consideration.
In Q2 2018, given an assessment of individual and company-related metrics, the Compensation Committee determined that it was appropriate for us to accrue for the probable payment of a bonus to management at year-end. This expense accrual of $0.017 per share, or approximately $540,000, was derived using the same framework and considerations used to determine the bonus compensation in 2017. It also included the concept of the deferral of a meaningful portion of the bonus to future years to encourage and reward persistent performance. Given the decline in our NAV this quarter, management recommended, and our Compensation Committee agreed, that it was appropriate to reverse this accrual. As such, there will be no bonus pool for management in 2018. This reversal increased NAV by $0.017 in the quarter.
TURN/NAV: SUM OF THE PARTS:
At the end of Q4 2018, TURN traded at 66% of its NAV. Our liquid assets, cash, and other assets net of liabilities were $1.03 per share. Our stock price was $1.75. If we received 100% credit for the value of these assets net of liabilities, the market is ascribing a value of $0.72 per share, or $22.4 million, to our private portfolio. Given our private assets are valued at $50.1 million, the market is discounting the value of our private portfolio assets by 55% as of the end of 2018 versus 40% as of the end of Q3 2018 and 36% as of the end of 2017.
As we grow our cash and liquid securities, the discount our stock trades to NAV should narrow. In September 2016, we had 19% of our cash and investments in cash and liquid securities less outstanding debt. At the beginning of our strategy in 2017, we had 27% of our cash and investments in cash and public companies. Today that number is 40%. We want that trend to continue and accelerate. We have made substantial progress in reinventing ourselves. Our balance sheet reflects just how far we have come.
2018 was an event filled year. Our vision is to be known as a leader in small cap activist investing, with a relentless focus on achieving excellence in our investment performance. Our investment in Turtle Beach Corporation (NASDAQ: HEAR) in the second quarter of 2018 is the second time we have assisted a company in removing an overhang to its stock price. The result was the same: a significant shareholder value creation exercise for HEAR and its shareholders, and most importantly, for our Fund and our shareholders. Of course, our first major “active” investment was TST. We have achieved a 100% unrealized return over the last 13 months on our investment in TST; which is evidence of our ability to help a company increase shareholder value.
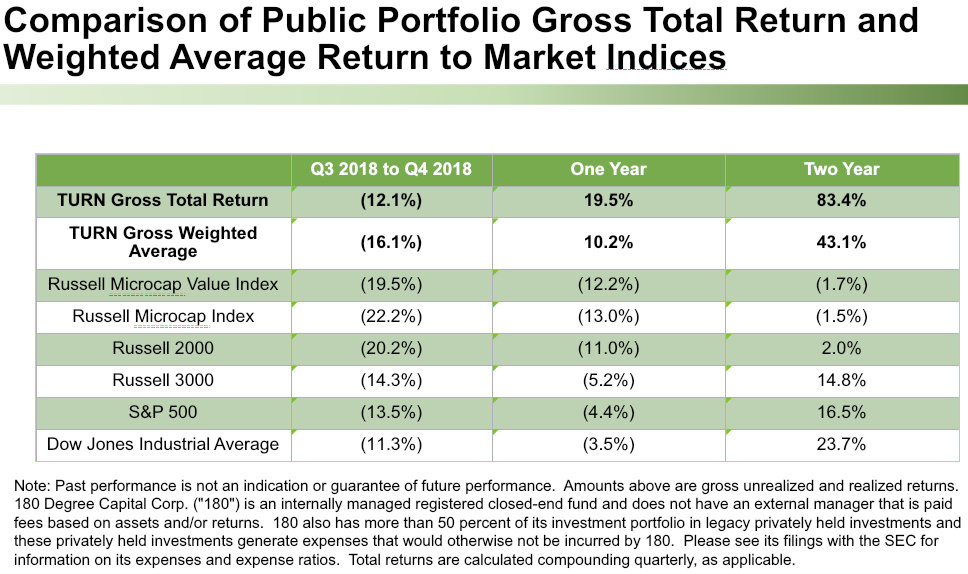
A picture tells a thousand words. Take a look at the next two tables.
Our stock picking has been very good, and it has been very good in two entirely different markets (2017 and 2018). We have drastically reduced our expense base, raised money for two special purpose vehicles, and successfully exited two of our private portfolio companies, MRSN and HZO, through an IPO and a cash sale, respectively.
We were bitterly disappointed in how 2018 ended, but we take solace in the notion that we grew our net asset value over the entirety of 2018. We think from that perspective, we were an outlier, as not many funds were up last year. Being amongst the ones that were on the positive side of the ledger is a very positive outcome. The dislocation in Q4 2018 created buying opportunities of both old and new positions. While we don’t know how long the current unwind of technology-related companies due to fears of a trade war with China will last, many stocks have now discounted the bad news. As we look at our portfolio, we have made a conscious decision to be long those companies that we believe will benefit from IoT growth. Many of those names have been hurt in recent months. We think the fundamental underpinnings and secular trends of the IoT market are sound. We also recognize the stock market and economic growth have been rising for 10 years. Simply put, there is less value today than there was, when the bull market started. But given the outright wipeout in Q4 2018, we are very optimistic about what we own as we start 2019.

Kevin Rendino
Chairman and Chief Executive Officer
|
|
180 DEGREE CAPITAL CORP. CONSOLIDATED STATEMENT OF ASSETS AND LIABILITIES |
|
| | | |
| December 31, 2018 |
|
ASSETS | |
|
Investments in portfolio securities, at value: | |
|
Unaffiliated privately held companies (cost: $14,631,117) | $ | 16,139,296 |
|
Unaffiliated publicly traded securities (cost: $18,556,002) | 13,032,576 |
|
Non-controlled affiliated privately held companies (cost: $27,027,538) | 26,429,303 |
|
Non-controlled affiliated publicly traded securities (cost: $9,288,130) | 11,907,377 |
|
Controlled affiliated privately held companies (cost: $12,267,175) | 5,271,414 |
|
Equity method privately held company (adjusted cost basis: $246,229) | 246,229 |
|
Unaffiliated rights to payments (adjusted cost basis: $548,998) | 2,019,283 |
|
Cash | 7,801,712 |
|
Restricted cash | 46,151 |
|
Interest receivable | 661,677 |
|
Prepaid expenses | 259,359 |
|
Receivable from portfolio companies and managed funds | 106,662 |
|
Other assets | 132,015 |
|
Total assets | $ | 84,053,054 |
|
LIABILITIES & NET ASSETS | |
|
Post-retirement plan liabilities | $ | 1,140,406 |
|
Accounts payable and accrued liabilities | 732,324 |
|
Payable for securities purchased | 92,371 |
|
Deferred rent | 53,185 |
|
Total liabilities | $ | 2,018,286 |
|
Commitments and contingencies (Note 10) | |
|
Net assets | $ | 82,034,768 |
|
Net assets are comprised of: | |
|
Preferred stock, $0.10 par value, 2,000,000 shares authorized; none issued | $ | 0 |
|
Common stock, $0.01 par value, 45,000,000 shares authorized; 34,623,341 issued | 334,594 |
|
Additional paid in capital | 127,652,787 |
|
Total distributable loss | (41,347,088 | ) |
Treasury stock, at cost 3,501,779 shares | (4,605,525 | ) |
Net assets | $ | 82,034,768 |
|
Shares outstanding | 31,121,562 |
|
Net asset value per outstanding share | $ | 2.64 |
|
The accompanying notes are an integral part of these consolidated financial statements.
7
|
|
180 DEGREE CAPITAL CORP. CONSOLIDATED STATEMENT OF OPERATIONS |
|
| | | |
| Year Ended
December 31, 2018 |
|
Income: | |
|
Interest from: | |
|
Unaffiliated companies-cash | $ | 19,206 |
|
Unaffiliated companies-PIK | 17,883 |
|
Non-controlled affiliated companies-cash | (49,562 | ) |
Non-controlled affiliated companies-PIK | 16,219 |
|
Controlled affiliated companies-PIK | 25,569 |
|
Cash and U.S. government securities | 19,018 |
|
Yield enhancing fee income on debt securities-non-cash | 182,683 |
|
Sub-lease income | 248,666 |
|
Fee income for providing managerial assistance to portfolio companies-cash | 75,000 |
|
Fee income for providing managerial assistance to portfolio companies-non-cash | 57,940 |
|
Management fee income | 73,214 |
|
Total income | 685,836 |
|
Operating fees and expenses: | |
|
Salaries, bonus and benefits | 1,464,381 |
|
Professional | 561,650 |
|
Directors | 277,500 |
|
Rent | 252,110 |
|
Administration and operations | 251,237 |
|
Insurance | 223,901 |
|
Custody | 30,188 |
|
Other | 4,885 |
|
Total operating expenses | 3,065,852 |
|
Net investment loss before income tax expense | (2,380,016 | ) |
Income tax expense | 6,003 |
|
Net investment loss | (2,386,019 | ) |
Net realized gain (loss) from investments: | |
|
Realized gain (loss) from investments: | |
|
Unaffiliated publicly traded securities | 6,802,818 |
|
Non-controlled affiliated privately held companies | (6,882,890 | ) |
Controlled affiliated privately held companies | (7,613,301 | ) |
Net realized loss from investments | (7,693,373 | ) |
Realized loss from funds in escrow | (150 | ) |
Net realized loss | (7,693,523 | ) |
Change in unrealized (depreciation) appreciation on investments: | |
|
Unaffiliated privately held companies | (1,369,705 | ) |
Unaffiliated publicly traded securities | (4,986,125 | ) |
Non-controlled affiliated privately held companies | 7,512,247 |
|
Non-controlled affiliated publicly traded securities | 2,038,330 |
|
Controlled affiliated privately held companies | 8,193,457 |
|
Unaffiliated rights to payments | (192,584 | ) |
Net change in unrealized appreciation on investments | 11,195,620 |
|
Net realized loss and change in unrealized appreciation on investments | 3,502,097 |
|
Share of loss on equity method investment | (124,299 | ) |
Net increase in net assets resulting from operations | $ | 991,779 |
|
The accompanying notes are an integral part of these consolidated financial statements.
8
|
|
180 DEGREE CAPITAL CORP.
CONSOLIDATED STATEMENT OF CASH FLOWS |
|
| | | |
| Year Ended
December 31, 2018 |
|
Cash flows provided by operating activities: | |
|
Net increase in net assets resulting from operations | $ | 991,779 |
|
Adjustments to reconcile net increase in net assets resulting from operations to net cash provided by operating activities: | |
|
Net realized loss from investments | 7,693,373 |
|
Realized loss from funds held in escrow | 150 |
|
Net change in unrealized appreciation on investments | (11,195,620 | ) |
Share of loss on equity method investee | 124,299 |
|
Depreciation of fixed assets | 4,879 |
|
Accretion of bridge note PIK interest income | (59,671 | ) |
Yield enhancing fee income on debt securities-non-cash | (182,683 | ) |
Fee income for providing managerial assistance to portfolio companies-non-cash | (57,940 | ) |
Purchase of U.S. government securities | (7,983,711 | ) |
Maturity of U.S. government securities | 7,983,711 |
|
Purchase of equity method investee | (113,906 | ) |
Purchase of unaffiliated privately held portfolio companies | (1,602,368 | ) |
Purchase of unaffiliated publicly traded securities | (12,935,685 | ) |
Purchase of non-controlled affiliated privately held portfolio companies | (245,334 | ) |
Purchase of non-controlled affiliated publicly traded securities | (665,750 | ) |
Purchase on controlled affiliated privately held companies | (500,000 | ) |
Proceeds from sale of unaffiliated privately held companies | 132,000 |
|
Proceeds from sale of unaffiliated publicly traded securities | 16,728,458 |
|
Proceeds from sale of non-controlled affiliated privately held companies | 7,135,834 |
|
Proceeds from sale of non-controlled affiliated publicly traded securities | 111,131 |
|
Proceeds from sale of controlled affiliated privately held companies | 50,000 |
|
Proceeds from funds held in escrow | 12,805 |
|
Changes in assets and liabilities: | |
|
Decrease in interest receivable | 49,563 |
|
Increase on prepaid expenses | (22,908 | ) |
Increase in receivable from portfolio companies and managed funds | (65,910 | ) |
Decrease in other assets | 31,182 |
|
Decrease in post-retirement plan liabilities | (198,940 | ) |
Decrease in accounts payable and accrued liabilities | (715,221 | ) |
Decrease in accrued severance | (140,923 | ) |
Decrease in deferred rent | (45,633 | ) |
Decrease in directors' fee payable | (58,125 | ) |
Increase in payable for securities purchased | 92,371 |
|
Net cash provided by operating activities | 4,351,207 |
|
Cash flows from investing activities: | |
|
Purchase of fixed assets | (1,884 | ) |
Net cash used in investing activities | (1,884 | ) |
Net increase in cash and restricted cash | 4,349,323 |
|
Cash and restricted cash at beginning of the year | 3,498,540 |
|
Cash and restricted cash at end of the year | $ | 7,847,863 |
|
| |
Supplemental disclosures of cash flow information: | |
|
Income taxes paid | $ | 6,003 |
|
| |
Cash | $ | 7,801,712 |
|
Restricted cash | 46,151 |
|
Total cash and restricted cash shown in the consolidated statement of cash flows | $ | 7,847,863 |
|
The accompanying notes are an integral part of these consolidated financial statements.
9
|
|
180 DEGREE CAPITAL CORP. CONSOLIDATED STATEMENTS OF CHANGES IN NET ASSETS |
|
| | | | | | | |
| Year Ended
December 31, 2018 |
| | Year Ended
December 31, 2017 |
|
Changes in net assets from operations: | | | |
|
Net investment loss | $ | (2,386,019 | ) | | $ | (3,645,515 | ) |
Net realized loss | (7,693,523 | ) | | (11,755,179 | ) |
Net change in unrealized appreciation on investments | 11,195,620 |
| | 24,877,695 |
|
Share of loss on equity method investment | (124,299 | ) | | (59,258 | ) |
Net increase in net assets resulting from operations | 991,779 |
| | 9,417,743 |
|
Changes in net assets from capital stock transactions: | |
| | |
|
Acquisition of vested restricted stock awards to pay required employee withholding tax | 0 |
| | (139,780 | ) |
Stock-based compensation benefit | 0 |
| | (190,347 | ) |
Net decrease in net assets resulting from capital stock transactions | 0 |
| | (330,127 | ) |
Changes in net assets from accumulated other comprehensive loss: | |
| | |
|
Other comprehensive loss | 0 |
| | (300,237 | ) |
Net decrease in net assets resulting from accumulated other comprehensive loss | 0 |
| | (300,237 | ) |
Net increase in net assets | 991,779 |
| | 8,787,379 |
|
Net Assets: | |
| | |
|
Beginning of the year | 81,042,989 |
| | 72,255,610 |
|
End of the year1 | $ | 82,034,768 |
| | $ | 81,042,989 |
|
| | | |
1 Includes accumulated net investment loss of $5,211,751 as of December 31, 2017. The Securities Exchange Commission ("SEC") eliminated the requirement to disclose accumulated net investment income (loss) in 2018. |
The accompanying notes are an integral part of these consolidated financial statements.
10
|
|
180 DEGREE CAPITAL CORP. FINANCIAL HIGHLIGHTS |
|
| | | | | | | | | | | | | | | | | | | |
| Year Ended
Dec. 31, 2018 | | Year Ended
Dec. 31, 2017 | | Year Ended Dec. 31, 2016 | | Year Ended Dec. 31, 2015 | | Year Ended Dec. 31, 2014 |
Per Share Operating Performance | | | | | |
| | |
| | |
|
Net asset value per share, beginning of the year | $ | 2.60 |
| | $ | 2.34 |
| | $ | 2.88 |
| | $ | 3.51 |
| | $ | 3.93 |
|
Net investment loss* | (0.07 | ) | | (0.12 | ) | | (0.15 | ) | | (0.23 | ) | | (0.25 | ) |
Net realized (loss) gain from investments* | (0.25 | ) | | (0.38 | ) | | (0.26 | ) | | 0.15 |
| | (0.16 | ) |
Net change in unrealized appreciation (depreciation) on investments and written call options*1 | 0.36 |
| | 0.80 |
| | (0.12 | ) | | (0.56 | ) | | (0.02 | ) |
Share of loss on equity method investment*2 | 0.00 |
| | 0.00 |
| | 0.00 |
| | (0.01 | ) | | 0.00 |
|
Total* | 0.04 |
| | 0.30 |
| | (0.53 | ) | | (0.65 | ) | | (0.43 | ) |
Net (decrease) increase as a result of stock-based compensation expense*2 | 0.00 |
| | (0.01 | ) | | 0.01 |
| | 0.03 |
| | 0.03 |
|
Net increase as a result of purchase of treasury stock | 0.00 |
| | 0.00 |
| | 0.00 |
| | 0.01 |
| | 0.00 |
|
Net decrease as a result of acquisition of vested restricted stock awards related to employee withholding2 | 0.00 |
| | (0.02 | ) | | (0.01 | ) | | (0.01 | ) | | (0.01 | ) |
Total (decrease) increase from capital stock transactions | 0.00 |
| | (0.03 | ) | | 0.00 |
| | 0.03 |
| | 0.02 |
|
Net (decrease) increase as a result of other comprehensive (loss) income*2 | 0.00 |
| | (0.01 | ) | | (0.01 | ) | | (0.01 | ) | | (0.01 | ) |
Net increase (decrease) in net asset value | 0.04 |
| | 0.26 |
| | (0.54 | ) | | (0.63 | ) | | (0.42 | ) |
Net asset value per share, end of the year | $ | 2.64 |
| | $ | 2.60 |
| | $ | 2.34 |
| | $ | 2.88 |
| | $ | 3.51 |
|
Stock price per share, end of the year | $ | 1.75 |
| | $ | 1.97 |
| | $ | 1.38 |
| | $ | 2.20 |
| | $ | 2.95 |
|
Total return based on stock price | (11.17 | )% | | 42.75 | % | | (37.27 | )% | | (25.42 | )% | | (1.01 | )% |
Supplemental Data: | | | | | | | |
| | |
|
Net assets, end of the year | $ | 82,034,768 |
| | $ | 81,042,989 |
| | $ | 72,255,610 |
| | $ | 88,711,671 |
| | $ | 109,654,427 |
|
Ratio of expenses, excluding taxes, to quarterly average net assets | 3.62 | % | ** | 6.26 | % | ** | 7.88 | % | | 8.15 | % | | 7.14 | % |
Ratio of expenses, including taxes, to quarterly average net assets | 3.63 | % | ** | 6.28 | % | 3 ** | 7.89 | % | | 8.15 | % | | 7.15 | % |
Ratio of net investment loss to quarterly average net assets | (2.82 | )% | | (4.68 | )% | | (5.64 | )% | | (7.22 | )% | | (6.70 | )% |
Average debt outstanding | $ | 0 |
| | $ | 0 |
| | $ | 4,590,164 |
| | $ | 3,780,822 |
| | $ | 0 |
|
Average debt per share | $ | 0.00 |
| | $ | 0.00 |
| | $ | 0.15 |
| | $ | 0.12 |
| | $ | 0.00 |
|
Portfolio turnover | 20.43 | % | | 8.83 | % | | *** |
| | *** |
| | *** |
|
Number of shares outstanding, end of the year | 31,121,562 |
| | 31,121,562 |
| | 30,904,209 |
| | 30,845,754 |
| | 31,280,843 |
|
*Based on average shares outstanding.
**The Company has entered into an expense offsetting arrangement with one of its unaffiliated brokers relating to broker fees paid. The total broker fee charged to the Company was applied as a credit to fees charged by an affiliate of the unaffiliated broker who the Company subscribes to for data services billed during the year. The Company received an offset to expense totaling approximately $17,509 and $5,700 with that broker for the year ended December 31, 2018 and the year ended December 31, 2017.
***Prior to March 2017, the Company was a business development company investing primarily in privately held securities. Portfolio turnover was not a relevant indicator for such investments given that the Company did not generally pay brokerage fees on such investments.
1 Net unrealized losses include rounding adjustments to reconcile change in net asset value per share.
2 Amounts listed as zero are amounts calculated as less than $0.005.
3 Ratio of expenses, including taxes and excluding expenses related to restructuring, to quarterly average net assets for the year ended December 31, 2017 was 5.19%.
The accompanying notes are an integral part of these consolidated financial statements.
11
|
| | | | | | | | | |
180 DEGREE CAPITAL CORP.
CONSOLIDATED SCHEDULE OF INVESTMENTS AS OF DECEMBER 31, 2018 |
| | | | | | | | | |
| Method of Valuation (1) | | Industry | | Cost | | Shares/ Principal | | Value |
|
| | | | | | | | | | | | | | | |
Investments in Unaffiliated Companies (2) - | | | | | | | | | |
35.6% of net assets at value | | | | | | | | | |
| | | | | | | | | |
Privately Held Companies (Illiquid) - | | | | | | | | | |
19.7% of net assets at value | | | | | | | | | |
| | | | | | | | | |
AutoTech Ventures Management I, LLC (3)(4)(5) | | | | | | | | | |
Venture capital investing in automotive-related companies | | | Asset Management & Custody Banks | | | | | | |
LLC Interests (acquired 12/1/17) | (M) (L3) | | | | $ | 0 |
| | 0 |
| | $ | 150,000 |
|
| | | | | | | | | |
D-Wave Systems, Inc. (3)(4)(6) | | | Technology Hardware, Storage & Peripherals | | | | | | |
Developing high-performance quantum computing systems | | | | | | | | | |
Series 1 Class B Convertible Preferred Stock (acquired 9/30/08) | (M) (L3) | | | | 1,002,074 |
| | 1,144,869 |
| | 1,958,033 |
|
Series 1 Class C Convertible Preferred Stock (acquired 9/30/08) | (M) (L3) | | | | 487,804 |
| | 450,450 |
| | 786,616 |
|
Series 1 Class D Convertible Preferred Stock (acquired 9/30/08) | (M) (L3) | | | | 748,473 |
| | 855,131 |
| | 1,493,305 |
|
Series 1 Class E Convertible Preferred Stock (acquired 11/24/10) | (M) (L3) | | | | 248,049 |
| | 269,280 |
| | 490,521 |
|
Series 1 Class F Convertible Preferred Stock (acquired 11/24/10) | (M) (L3) | | | | 238,323 |
| | 258,721 |
| | 471,287 |
|
Series 1 Class H Convertible Preferred Stock (acquired 6/27/14) | (M) (L3) | | | | 909,088 |
| | 460,866 |
| | 1,141,337 |
|
Series 2 Class D Convertible Preferred Stock (acquired 9/30/08) | (M) (L3) | | | | 736,019 |
| | 678,264 |
| | 1,184,445 |
|
Series 2 Class E Convertible Preferred Stock (acquired 6/1/12-3/22/13) | (M) (L3) | | | | 659,493 |
| | 513,900 |
| | 979,874 |
|
Series 2 Class F Convertible Preferred Stock (acquired 6/1/12-3/22/13) | (M) (L3) | | | | 633,631 |
| | 493,747 |
| | 941,447 |
|
Warrants for Common Stock expiring 5/12/19 (acquired 5/12/14) | (I) (L3) | | | | 26,357 |
| | 20,415 |
| | 242 |
|
| | | | | 5,689,311 |
| | | | 9,447,107 |
|
| | | | | | | | | |
Fleet Health Alliance, LLC (3)(4) | | | Health Care Technology | | | | | | |
Developing software for information transfer amongst healthcare providers and consumers | | | | | | | | | |
Unsecured Convertible Bridge Note, 0%, (acquired 4/22/16, no maturity date) | (I) (L3) | | | | 225,000 |
| | $ | 225,000 |
| | 112,500 |
|
| | | | | | | | | |
The accompanying notes are an integral part of these consolidated financial statements.
12
|
| | | | | | | | | |
180 DEGREE CAPITAL CORP.
CONSOLIDATED SCHEDULE OF INVESTMENTS AS OF DECEMBER 31, 2018 |
| | | | | | | | | |
| Method of Valuation (1) | | Industry | | Cost | | Shares/ Principal | | Value |
|
| | | | | | | | | | | | | | | |
Investments in Unaffiliated Companies (2) - | | | | | | | | | |
35.6% of net assets at value (cont.) | | | | | | | | | |
| | | | | | | | | |
Privately Held Companies (Illiquid) - | | | | | | | | | |
19.7% of net assets at value (cont.) | | | | | | | | | |
| | | | | | | | | |
Genome Profiling, LLC (3)(7) | | | Life Sciences Tools & Services | | | | | | |
Developing a platform to analyze and understand the epigenome | | | | | | | | | |
Unsecured Convertible Bridge Note, 8%, (acquired 8/4/16, maturing 8/4/19) | (M) (L3) | | | | $ | 230,000 |
| | $ | 230,000 |
| | $ | 230,000 |
|
| | | | | | | | | |
Magnolia Neurosciences Corporation (3)(4) | | | Pharmaceuticals | | | | | | |
Developing and commercializing novel therapeutics for treatment of neurodegeneration | | | | | | | | | |
Series A Convertible Preferred Stock (acquired 8/3/18) | (I) (L3) | | | | 862,872 |
| | 862,872 |
| | 867,417 |
|
| | | | | | | | | |
Nanosys, Inc. (3)(4) | | | Specialty Chemicals | | | | | | |
Developing inorganic nanowires and quantum dots for use in LED-backlit devices | | | | | | | | | |
Series C Convertible Preferred Stock (acquired 4/10/03) | (I) (L3) | | | | 1,500,000 |
| | 803,428 |
| | 926,994 |
|
Series D Convertible Preferred Stock (acquired 11/7/05) | (I) (L3) | | | | 3,000,003 |
| | 1,016,950 |
| | 1,779,526 |
|
Series E Convertible Preferred Stock (acquired 8/13/10) | (I) (L3) | | | | 496,573 |
| | 433,688 |
| | 795,737 |
|
| | | | | 4,996,576 |
| | | | 3,502,257 |
|
| | | | | | | | | |
NanoTerra, Inc. (3)(4) | | | Research & Consulting Services | | | | | | |
Developing surface chemistry and nano-manufacturing solutions | | | | | | | | | |
Warrants for Common Stock expiring on 2/22/21 (acquired 2/22/11) | (I) (L3) | | | | 69,168 |
| | 4,462 |
| | 0 |
|
Warrants for Series A-3 Preferred Stock expiring on 11/15/22 (acquired 11/15/12) | (I) (L3) | | | | 35,403 |
| | 47,508 |
| | 31,645 |
|
| | | | | 104,571 |
| | | | 31,645 |
|
| | | | | | | | | |
The accompanying notes are an integral part of these consolidated financial statements.
13
|
| | | | | | | | | |
180 DEGREE CAPITAL CORP.
CONSOLIDATED SCHEDULE OF INVESTMENTS AS OF DECEMBER 31, 2018 |
| | | | | | | | | |
| Method of Valuation (1) | | Industry | | Cost | | Shares/ Principal | | Value |
|
| | | | | | | | | | | | | | | |
Investments in Unaffiliated Companies (2) - | | | | | | | | | |
35.6% of net assets at value (cont.) | | | | | | | | | |
| | | | | | | | | |
Privately Held Companies (Illiquid) - | | | | | | | | | |
19.7% of net assets at value (cont.) | | | | | | | | | |
| | | | | | | | | |
Petra Pharma Corporation (3)(4)(8) | | | Pharmaceuticals | | | | | | |
Developing small molecule inhibitors for treatment of cancer and metabolic diseases | | | | | | | | | |
Series A Convertible Preferred Stock (acquired 12/23/15-1/8/18) | (I) (L3) | | | | $ | 1,894,798 |
| | 1,894,798 |
| | $ | 1,018,718 |
|
Secured Convertible Bridge Note, 7% PIK, (acquired 8/30/18, maturing 1/31/19) | (M) (L3) | | | | 378,541 |
| | $ | 369,748 |
| | 378,541 |
|
| | | | | 2,273,339 |
| | | | 1,397,259 |
|
| | | | | | | | | |
Phylagen, Inc. (3) | | | Research & Consulting Services | | | | | | |
Developing technology to improve human health and business productivity | | | | | | | | | |
Series A Convertible Preferred Stock (acquired 11/14/18) | (I) (L3) | | | | 249,448 |
| | 584,597 |
| | 401,111 |
|
| | | | | | | | | |
Total Unaffiliated Privately Held Companies (cost: $14,631,117) | | | | | | | | | $ | 16,139,296 |
|
| | | | | | | | | |
Unaffiliated Publicly Traded Securities - | | | | | | | | | |
15.9% of net assets at value | | | | | | | | | |
| | | | | | | | | |
Adesto Technologies Corporation (4) | | | Semiconductors | | | | | | |
Developing low-power, high-performance solutions for the Internet of Things (IoT) | | | | | | | | | |
Common Stock (acquired 10/27/15-12/31/18) | (M) (L1) | | | | $ | 6,564,931 |
| | 1,116,675 |
| | $ | 4,913,370 |
|
| | | | | | | | | |
Airgain, Inc. (4) | | | Electronic Components | | | | | | |
Providing advanced antenna technologies for high-performance wireless networking | | | | | | | | | |
Common Stock (acquired 6/4/18-12/27/18) | (M) (L1) | | | | 1,614,289 |
| | 188,784 |
| | 1,870,849 |
|
| | | | | | | | | |
Emcore Corporation (4) | | | Communications Equipment | | | | | | |
Providing mixed-signal optical products | | | | | | | | | |
Common Stock (acquired 5/3/18-9/19/18) | (M) (L1) | | | | 2,684,497 |
| | 564,828 |
| | 2,372,278 |
|
| | | | | | | | | |
Intermolecular, Inc. (4) | | | Semiconductors | | | | | | |
Providing advanced materials innovation services and solutions | | | | | | | | | |
Common Stock (acquired 11/9/18-12/20/18) | (M) (L1) | | | | 1,328,661 |
| | 1,411,729 |
| | 1,425,846 |
|
| | | | | | | | | |
The accompanying notes are an integral part of these consolidated financial statements.
14
|
| | | | | | | | | |
180 DEGREE CAPITAL CORP.
CONSOLIDATED SCHEDULE OF INVESTMENTS AS OF DECEMBER 31, 2018 |
| | | | | | | | | |
| Method of Valuation (1) | | Industry | | Cost | | Shares/ Principal | | Value |
|
| | | | | | | | | | | | | | | |
Investments in Unaffiliated Companies (2) - | | | | | | | | | |
35.6% of net assets at value (cont.) | | | | | | | | | |
| | | | | | | | | |
Unaffiliated Publicly Traded Securities - | | | | | | | | | |
15.9% of net assets at value (cont.) | | | | | | | | | |
| | | | | | | | | |
Lantronix, Inc. (4) | | | Communications Equipment | | | | | | |
Providing secure data access and management solutions | | | | | | | | | |
Common Stock (acquired 9/18/18-12/17/18) | (M) (L1) | | | | $ | 1,475,580 |
| | 400,000 |
| | $ | 1,176,000 |
|
| | | | | | | | | |
Mersana Therapeutics, Inc. (4) | | | Biotechnology | | | | | | |
Developing antibody drug conjugates for cancer therapy | | | | | | | | | |
Common Stock (acquired 7/27/12-12/31/18) | (M) (L1) | | | | 4,414,817 |
| | 301,100 |
| | 1,228,488 |
|
| | | | | | | | | |
OpGen, Inc. (4) | | | Biotechnology | | | | | | |
Developing tools for genomic sequence assembly and analysis | | | | | | | | | |
Warrants for the Purchase of Common Stock expiring 5/8/20 (acquired 5/5/15) | (M) (L2) | | | | 425,579 |
| | 12,033 |
| | 989 |
|
Warrants for the Purchase of Common Stock expiring 2/17/25 (acquired 5/5/15) | (I) (L3) | | | | 785 |
| | 1,248 |
| | 202 |
|
| | | | | 426,364 |
| | | | 1,191 |
|
| | | | | | | | | |
Miscellaneous Common Stocks (4)(9) | (M) (L1) | | | | 46,863 |
| | | | 44,554 |
|
| | | | | | | | | |
Total Unaffiliated Publicly Traded Securities (cost: $18,556,002) | | | | | | | | | $ | 13,032,576 |
|
| | | | | | | | | |
Total Investments in Unaffiliated Companies (cost: $33,187,119) | | | | | | | | | $ | 29,171,872 |
|
| | | | | | | | | |
| | | | | | | | | |
| | | | | | | | | |
| | | | | | | | | |
The accompanying notes are an integral part of these consolidated financial statements.
15
|
| | | | | | | | | |
180 DEGREE CAPITAL CORP.
CONSOLIDATED SCHEDULE OF INVESTMENTS AS OF DECEMBER 31, 2018 |
| | | | | | | | | |
| Method of Valuation (1) | | Industry | | Cost | | Shares/ Principal | | Value |
|
| | | | | | | | | | | | | | | |
Investments in Non-Controlled Affiliated Companies (2) - | | | | | | | | | |
46.7% of net assets at value | | | | | | | | | |
| | | | | | | | | |
Privately Held Companies (Illiquid) - | | | | | | | | | |
32.2% of net assets at value | | | | | | | | | |
| | | | | | | | | |
ABSMaterials, Inc. (3) | | | Specialty Chemicals | | | | | | |
Developing nano-structured absorbent materials for water remediation and consumer applications | | | | | | | | | |
Series A Convertible Preferred Stock (acquired 2/17/10-10/24/11) | (I) (L3) | | | | $ | 435,000 |
| | 390,000 |
| | $ | 15,864 |
|
Series B Convertible Preferred Stock (acquired 11/8/13-6/25/14) | (I) (L3) | | | | 1,217,644 |
| | 1,037,751 |
| | 286,562 |
|
Secured Convertible Bridge Note, 8% PIK, (acquired 1/20/16, maturing 12/31/19) | (M) (L3) | | | | 123,605 |
| | $ | 100,000 |
| | 123,605 |
|
Secured Convertible Bridge Note, 8% PIK, (acquired 3/28/17, maturing 12/31/19) | (M) (L3) | | | | 28,529 |
| | $ | 25,000 |
| | 28,529 |
|
| | | | | 1,804,778 |
| | | | 454,560 |
|
| | | | | | | | | |
AgBiome, LLC (3)(4) | | | Fertilizers & Agricultural Chemicals | | | | | | |
Providing early-stage research and discovery for agriculture and utilizing the crop microbiome to identify products that reduce risk and improve yield | | | | | | | | | |
Series A-1 Convertible Preferred Units (acquired 1/30/13) | (I) (L3) | | | | 2,000,000 |
| | 2,000,000 |
| | 10,442,684 |
|
Series A-2 Convertible Preferred Units (acquired 4/9/13-10/15/13) | (I) (L3) | | | | 521,740 |
| | 417,392 |
| | 2,214,058 |
|
Series B Convertible Preferred Units (acquired 8/7/15) | (I) (L3) | | | | 500,006 |
| | 160,526 |
| | 951,079 |
|
| | | | | 3,021,746 |
| | | | 13,607,821 |
|
| | | | | | | | | |
Coba Therapeutics Corporation (3)(10) | | | | | | | | | |
Developed therapeutics for obesity, diabetes and liver diseases | | | Pharmaceuticals | | | | | | |
Unsecured Convertible Bridge Note, 6% PIK, (acquired 2/27/18, maturing 2/27/19) | (I) (L3) | | | | 151,606 |
| | $ | 145,530 |
| | 21,776 |
|
| | | | | | | | | |
| | | | | | | | | |
| | | | | | | | | |
| | | | | | | | | |
The accompanying notes are an integral part of these consolidated financial statements.
16
|
| | | | | | | | | |
180 DEGREE CAPITAL CORP.
CONSOLIDATED SCHEDULE OF INVESTMENTS AS OF DECEMBER 31, 2018 |
| | | | | | | | | |
| Method of Valuation (1) | | Industry | | Cost | | Shares/ Principal | | Value |
|
| | | | | | | | | | | | | | | |
Investments in Non-Controlled Affiliated Companies (2) - | | | | | | | | | |
46.7% of net assets at value (cont.) | | | | | | | | | |
| | | | | | | | | |
Privately Held Companies (Illiquid) - | | | | | | | | | |
32.2% of net assets at value (cont.) | | | | | | | | | |
| | | | | | | | | |
EchoPixel, Inc. (3)(4) | | | Health Care Equipment | | | | | | |
Developing virtual reality 3-D visualization software for life sciences and health care applications | | | | | | | | | |
Series Seed Convertible Preferred Stock (acquired 6/21/13-6/30/14) | (I) (L3) | | | | $ | 1,250,000 |
| | 4,194,630 |
| | $ | 1,201,023 |
|
Series Seed-2 Convertible Preferred Stock (acquired 1/22/16) | (I) (L3) | | | | 500,000 |
| | 1,476,668 |
| | 429,732 |
|
Series A-2 Convertible Preferred Stock (acquired 3/23/17) | (I) (L3) | | | | 350,000 |
| | 1,471,577 |
| | 499,616 |
|
| | | | | 2,100,000 |
| | | | 2,130,371 |
|
| | | | | | | | | |
Essential Health Solutions, Inc. (3) | | | Health Care Technology | | | | | | |
Developing software for information transfer amongst healthcare providers and consumers | | | | | | | | | |
Common Stock (acquired 11/18/16) | (I) (L3) | | | | 20 |
| | 200,000 |
| | 128,339 |
|
Series A Convertible Preferred Stock (acquired 11/18/16) | (I) (L3) | | | | 2,750,000 |
| | 2,750,000 |
| | 2,781,300 |
|
Unsecured Convertible Bridge Note, 8% PIK, (acquired 12/19/18, maturing 12/19/19) | (M) (L3) | | | | 50,142 |
| | $ | 50,000 |
| | 50,142 |
|
| | | | | 2,800,162 |
| | | | 2,959,781 |
|
| | | | | | | | | |
Lodo Therapeutics Corporation (3)(4) | | | Pharmaceuticals | | | | | | |
Developing and commercializing novel therapeutics derived from a metagenome-based Natural Product Discovery Platform | | | | | | | | | |
Series A Convertible Preferred Stock (acquired 12/21/15-4/22/16) | (I) (L3) | | | | 658,190 |
| | 658,190 |
| | 779,467 |
|
| | | | | | | | | |
NGX Bio, Inc. (3)(4)(10) | | | Research & Consulting Services | | | | | | |
Developing translational genomics solutions | | | | | | | | | |
Series Seed Convertible Preferred Stock (acquired 6/6/14-1/10/16) | (I) (L3) | | | | 500,002 |
| | 666,667 |
| | 17,273 |
|
Series Seed 2 Convertible Preferred Stock (acquired 8/20/15-9/30/15) | (I) (L3) | | | | 499,999 |
| | 329,989 |
| | 8,550 |
|
Series Seed 3 Convertible Preferred Stock (acquired 6/26/17) | (I) (L3) | | | | 686,329 |
| | 666,001 |
| | 17,256 |
|
| | | | | 1,686,330 |
| | | | 43,079 |
|
| | | | | | | | | |
The accompanying notes are an integral part of these consolidated financial statements.
17
|
| | | | | | | | | |
180 DEGREE CAPITAL CORP.
CONSOLIDATED SCHEDULE OF INVESTMENTS AS OF DECEMBER 31, 2018 |
| | | | | | | | | |
| Method of Valuation (1) | | Industry | | Cost | | Shares/ Principal | | Value |
|
| | | | | | | | | | | | | | | |
Investments in Non-Controlled Affiliated Companies (2) - | | | | | | | | | |
46.7% of net assets at value (cont.) | | | | | | | | | |
| | | | | | | | | |
Privately Held Companies (Illiquid) - | | | | | | | | | |
32.2% of net assets at value (cont.) | | | | | | | | | |
| | | | | | | | | |
ORIG3N, Inc. (3)(4) | | | Health Care Technology | | | | | | |
Developing consumer focused genetic tests | | | | | | | | | |
Series 1 Convertible Preferred Stock (acquired 2/5/15-8/5/15) | (H) (L3) | | | | $ | 500,000 |
| | 1,195,315 |
| | $ | 1,232,502 |
|
Series A Convertible Preferred Stock (acquired 11/25/15-9/7/16) | (H) (L3) | | | | 1,500,000 |
| | 1,364,666 |
| | 1,431,936 |
|
Series A-2 Convertible Preferred Stock (acquired 5/11/17-2/8/18) | (H) (L3) | | | | 200,002 |
| | 176,386 |
| | 189,592 |
|
| | | | | 2,200,002 |
| | | | 2,854,030 |
|
| | | | | | | | | |
Produced Water Absorbents, Inc. (3)(4)(11) | | | Oil & Gas Equipment & Services | | | | | | |
Providing integrated process separation solutions to the global oil and gas industries, enabling onsite treatment of produced and flowback water | | | | | | | | | |
Common Stock (acquired 4/30/16) | (M) (L3) | | | | 7,670,281 |
| | 50,243,350 |
| | 0 |
|
Warrants for Common Stock expiring upon liquidation event (acquired 4/30/16) | (M) (L3) | | | | 65,250 |
| | 450,000 |
| | 0 |
|
Senior Secured Debt, 15% commencing on 4/1/16, maturing on 12/31/19 (acquired 4/1/16) | (M) (L3) | | | | 2,323,680 |
| | $ | 2,533,766 |
| | 76,863 |
|
| | | | | 10,059,211 |
| | | | 76,863 |
|
| | | | | | | | | |
TARA Biosystems, Inc. (3)(4) | | | Life Sciences Tools & Services | | | | | | |
Developing human tissue models for toxicology and drug discovery applications | | | | | | | | | |
Common Stock (acquired 8/20/14) | (I) (L3) | | | | 20 |
| | 2,000,000 |
| | 659,162 |
|
Series A Convertible Preferred Stock (acquired 3/31/17) | (I) (L3) | | | | 2,545,493 |
| | 6,878,572 |
| | 2,842,393 |
|
| | | | | 2,545,513 |
| | | | 3,501,555 |
|
| | | | | | | | | |
Total Non-Controlled Affiliated Privately Held Companies (cost: $27,027,538) | | | | | | | | | $ | 26,429,303 |
|
| | | | | | | | | |
The accompanying notes are an integral part of these consolidated financial statements.
18
|
| | | | | | | | | |
180 DEGREE CAPITAL CORP.
CONSOLIDATED SCHEDULE OF INVESTMENTS AS OF DECEMBER 31, 2018 |
| | | | | | | | | |
| Method of Valuation (1) | | Industry | | Cost | | Shares/ Principal | | Value |
|
| | | | | | | | | | | | | | | |
Investments in Non-Controlled Affiliated Companies (2) - | | | | | | | | | |
46.7% of net assets at value (cont.) | | | | | | | | | |
| | | | | | | | | |
Non-Controlled Affiliated Publicly Traded Securities - | | | | | | | | | |
14.5% of net assets at value | | | | | | | | | |
| | | | | | | | | |
Synacor, Inc. (4)(12) | | | Application Software | | | | | | |
Providing technology development, multiplatform services and revenue partner for video, internet and communications providers, device manufacturers, and enterprises | | | | | | | | | |
Common Stock (acquired 4/6/17-12/31/18) | (M) (L1) | | | | $ | 4,338,396 |
| | 1,595,306 |
| | $ | 2,361,053 |
|
| | | | | | | | | |
TheStreet, Inc. (4)(13) | | | Financial Exchanges & Data | | | | | | |
Providing financial news and proprietary data to consumers and businesses | | | | | | | | | |
Common Stock (acquired 4/19/17-5/18/18) | (M) (L1) | | | | 4,949,734 |
| | 4,668,552 |
| | 9,477,161 |
|
Stock Options for Common Stock Expiring 1/1/25 (acquired 1/1/18) | (I) (L3) | | | | 0 |
| | 3,333 |
| | 1,995 |
|
Stock Options for Common Stock Expiring 5/18/25 (acquired 5/18/18) (3) | (I) (L3) | | | | 0 |
| | 10,000 |
| | 2,500 |
|
Restricted Stock Units (acquired 5/18/18) (3) | (M) (L3) | | | | 0 |
| | 33,333 |
| | 64,668 |
|
| | | | | 4,949,734 |
| | | | 9,546,324 |
|
| | | | | | | | | |
Total Non-Controlled Affiliated Publicly Traded Securities (cost: $9,288,130) | | | | | | | | | $ | 11,907,377 |
|
| | | | | | | | | |
Total Investments in Non-Controlled Affiliated Companies (cost: $36,315,668) | | | | | | | | | $ | 38,336,680 |
|
| | | | | | | | | |
| | | | | | | | | |
The accompanying notes are an integral part of these consolidated financial statements.
19
|
| | | | | | | | | |
180 DEGREE CAPITAL CORP.
CONSOLIDATED SCHEDULE OF INVESTMENTS AS OF DECEMBER 31, 2018 |
| | | | | | | | | |
| Method of Valuation (1) | | Industry | | Cost | | Shares/ Principal | | Value |
|
| | | | | | | | | | | | | | | |
Investments in Controlled Affiliated Companies (2) - | | | | | | | | | |
6.4% of net assets at value | | | | | | | | | |
| | | | | | | | | |
Privately Held Companies (Illiquid) - | | | | | | | | | |
6.4% of net assets at value | | | | | | | | | |
| | | | | | | | | |
Black Silicon Holdings, Inc. (3)(10)(14) | | | Semiconductors | | | | | | |
Holding company for interest in a company that develops silicon-based optoelectronic products | | | | | | | | | |
Series A Convertible Preferred Stock (acquired 8/4/15) | (M) (L3) | | | | $ | 750,000 |
| | 233,499 |
| | $ | 0 |
|
Series A-1 Convertible Preferred Stock (acquired 8/4/15) | (M) (L3) | | | | 890,000 |
| | 2,966,667 |
| | 0 |
|
Series A-2 Convertible Preferred Stock (acquired 8/4/15) | (M) (L3) | | | | 2,445,000 |
| | 4,207,537 |
| | 0 |
|
Series B-1 Convertible Preferred Stock (acquired 8/4/15) | (M) (L3) | | | | 1,169,561 |
| | 1,892,836 |
| | 0 |
|
Series C Convertible Preferred Stock (acquired 8/4/15) | (M) (L3) | | | | 1,171,316 |
| | 1,674,030 |
| | 0 |
|
Secured Convertible Bridge Note, 8% PIK, (acquired 8/25/16, maturing 8/4/21) | (M) (L3) | | | | 1,444,368 |
| | $ | 1,278,453 |
| | 476,187 |
|
| | | | | 7,870,245 |
| | | | 476,187 |
|
| | | | | | | | | |
HALE.life Corporation (3)(4) | | | Health Care Technology | | | | | | |
Developing a platform to facilitate precision health and medicine | | | | | | | | | |
Common Stock (acquired 3/1/16) | (I) (L3) | | | | 10 |
| | 1,000,000 |
| | 146,462 |
|
Series Seed-1 Convertible Preferred Stock (acquired 3/28/17) | (I) (L3) | | | | 1,896,920 |
| | 11,000,000 |
| | 2,147,894 |
|
Series Seed-2 Convertible Preferred Stock (acquired 12/28/18) | (I) (L3) | | | | 2,500,000 |
| | 12,083,132 |
| | 2,500,871 |
|
| | | | | 4,396,930 |
| | | | 4,795,227 |
|
| | | | | | | | | |
Total Controlled Affiliated Privately Held Companies (cost: $12,267,175) | | | | | | | | | $ | 5,271,414 |
|
| | | | | | | | | |
Total Investments in Controlled Affiliated Privately Held Companies (cost: $12,267,175) | | | | | | | | | $ | 5,271,414 |
|
| | | | | | | | | |
Total Investments in Privately Held Companies and Publicly Traded Securities (cost: $81,769,962) | | | | | | | | | $ | 72,779,966 |
|
| | | | | | | | | |
| | | | | | | | | |
The accompanying notes are an integral part of these consolidated financial statements.
20
|
| | | | | | | | | |
180 DEGREE CAPITAL CORP.
CONSOLIDATED SCHEDULE OF INVESTMENTS AS OF DECEMBER 31, 2018 |
| | | | | | | | | |
| Method of Valuation (1) | | Industry | | Cost | | Shares/ Principal | | Value |
|
| | | | | | | | | | | | | | | |
Investment in Equity Method Privately Held Company (2) - | | | | | | | | | |
0.3% of net assets at value | | | | | | | | | |
| | | | | | | | | |
Privately Held Company (Illiquid) - | | | | | | | | | |
0.3% of net assets at value | | | | | | | | | |
| | | | | | | | | |
Accelerator IV-New York Corporation (3)(4)(8)(15) | | | Research & Consulting Services | | | | | | |
Identifying and managing emerging biotechnology companies | | | | | | | | | |
Series A Common Stock (acquired 7/21/14-12/12/18) | (E) | | | | $ | 246,229 |
| | 833,333 |
| | $ | 246,229 |
|
| | | | | | | | | |
Total Investment in Equity Method Privately Held Company (cost: $246,229) | | | | | | | | | $ | 246,229 |
|
| | | | | | | | | |
Total Investments (cost: $82,016,191) | | | | | | | | | $ | 73,026,195 |
|
| | | | | | | | | |
Derivative Investments | | | | | | | | | |
| | | | | | | | | |
Unaffiliated Rights to Payments (Illiquid) - | | | | | | | | | |
2.5% of net assets at value | | | | | | | | | |
| | | | | | | | | |
Amgen, Inc. (3)(4)(16) | | | Biotechnology | | | | | | |
Rights to Milestone Payments from Acquisition of BioVex Group, Inc. (acquired 3/4/11) | (I) (L3) | | | | $ | 548,998 |
| | $ | 548,998 |
| | $ | 2,019,283 |
|
| | | | | | | | | |
Xenio Holdings, Inc. (3)(4)(17) | | | Technology Hardware, Storage & Peripherals | | | | | | |
Rights to Payments from the Merger with Xenio Systems, Inc. (acquired 10/20/17) | (I) (L3) | | | | 0 |
| | $ | 0 |
| | 0 |
|
| | | | | | | | | |
Total Unaffiliated Rights to Payments (cost: $548,998) | | | | | | | | | $ | 2,019,283 |
|
| | | | | | | | | |
Total Derivative Investments (cost: $548,998) | | | | | | | | | $ | 2,019,283 |
|
| | | | | | | | | |
Total Investments and Derivatives (cost: $82,565,189) | | | | | | | | | $ | 75,045,478 |
|
The accompanying notes are an integral part of these consolidated financial statements.
21
180 DEGREE CAPITAL CORP.
NOTES TO CONSOLIDATED SCHEDULE OF INVESTMENTS AS OF DECEMBER 31, 2018
Notes to Consolidated Schedule of Investments
| |
(1) | See "Note 2. Summary of Significant Accounting Policies: Portfolio Investment Valuations" of the Notes to Consolidated Financial Statements. |
| |
(2) | Investments in unaffiliated companies consist of investments in which we own less than five percent of the voting shares of the portfolio company. Investments in non-controlled affiliated companies consist of investments in which we own five percent or more, but less than 25 percent, of the voting shares of the portfolio company, or where we control one or more seats on the portfolio company’s board of directors but do not control the company. Investments in controlled affiliated companies consist of investments in which we own 25 percent or more of the outstanding voting rights of the portfolio company or otherwise control the company, including control of a majority of the seats on the board of directors, or more than 25 percent of the seats on the board of directors, with no other entity or person in control of more director seats than us. |
| |
(3) | We are subject to legal restrictions on the sale of our investment(s) in this company. The total amount of restricted securities held is $50,172,693, or 61.2 percent of net assets. |
| |
(4) | Represents a non-income producing investment. Investments that have not paid dividends or interest within the last 12 months are considered to be non-income producing. |
| |
(5) | We received LLC Interests of 1.25 percent in AutoTech Ventures Management I, LLC ("AutoTech") pursuant to an Administrative Services Agreement between us and AutoTech and due to us following the termination of a former employee of the Company. These LLC Interests were separate from the compensation received for providing the administrative services under the agreement that were paid in cash. We are not investors in AutoTech. The LLC interests have a capital percentage of 0 percent. |
| |
(6) | D-Wave Systems, Inc., is located and is doing business primarily in Canada. We invested in D-Wave Systems, Inc. through Parallel Universes, Inc., a Delaware company. Our investment is denominated in Canadian dollars and is subject to foreign currency translation. See "Note 2. Summary of Significant Accounting Policies." We may also be subject to certain taxation on this investment if we choose to sell our shares prior to a sale of the company or an initial public offering. See "Note 9. Income Taxes." |
| |
(7) | In January 2019, we agreed to sell our security of Genome Profiling, LLC to an undisclosed buyer for $230,000 plus accrued interest through the date of the transaction, January 31, 2019. |
| |
(8) | See "Note 10. Commitments and Contingencies" of the Notes to Consolidated Financial Statements. |
| |
(9) | The identities of these securities have been concealed to protect the Company while it completes a purchase or selling program for these securities. |
| |
(10) | Represents a non-operating entity that exists to collect future payments from licenses or other engagements, monetize assets for future distributions to investors and debt holders, or is in the process of shutting down and distributing remaining assets according to a liquidation waterfall. |
| |
(11) | Produced Water Absorbents, Inc., also does business as ProSep, Inc. |
| |
(12) | The Company is the Investment Manager and Managing Member of 180.2 SPV Series - a Series of 180 Degree Capital Management, LLC that owns 1,241,400 shares, or 3.2 percent of the voting securities, of Synacor, Inc. ("SYNC"). When combined with the Company's ownership of 4.1 percent of the voting securities of SYNC, the Company controls 7.3 percent of the voting securities of SYNC, based on 39,000,303 shares reported in SYNC's most recent Securities and Exchange Commission ("SEC") filing, Form 10-Q, as of September 30, 2018. |
| |
(13) | The stock options and restricted stock units were issued to Kevin Rendino for service on the Board of Directors of TheStreet, Inc. Mr. Rendino entered into an assignment and assumption agreement with the Company that transfers all beneficial and voting interest to the Company. |
The accompanying notes are an integral part of these consolidated financial statements.
22
180 DEGREE CAPITAL CORP.
NOTES TO CONSOLIDATED SCHEDULE OF INVESTMENTS AS OF DECEMBER 31, 2018
| |
(14) | On August 4, 2015, SiOnyx, Inc., reorganized its corporate structure to become a subsidiary of a new company, Black Silicon Holdings, Inc. Our security holdings of SiOnyx, Inc. were converted into securities of Black Silicon Holdings, Inc. SiOnyx, Inc. was then acquired by an undisclosed buyer. Black Silicon Holdings, Inc. owns a profit interest in the undisclosed buyer. |
| |
(15) | Under the equity method, investments are carried at cost, plus or minus the company's equity in the increases and decreases in the investee's net assets after the date of acquisition and certain other adjustments. The Company owns approximately 9 percent of Accelerator IV-New York Corporation. |
| |
(16) | If all the remaining milestones are met, we would receive $5,384,482. There can be no assurance as to how much of these amounts we will ultimately realize or when they will be realized, if at all. |
| |
(17) | In October 2017, Xenio Systems, Inc., merged with Xenio Holdings, Inc. In conjunction with this merger, all common stock of Xenio Systems, Inc., was canceled and shareholders were granted a right to a future payment in the event of a sale of Xenio Holdings, Inc. The maximum amount we could receive from such payments is approximately $11,000. There can be no assurance as to how much of these amounts we will ultimately realize or when they will be realized, if at all. |
The accompanying notes are an integral part of these consolidated financial statements.
23
180 DEGREE CAPITAL CORP.
NOTES TO CONSOLIDATED FINANCIAL STATEMENTS
NOTE 1. THE COMPANY
180 Degree Capital Corp. (f/k/a Harris & Harris Group, Inc.) (the "Company," "us," "our" and "we"), withdrew its election to be treated as a business development company on March 30, 2017, and subsequently returned to its prior status as a registered non-diversified closed-end management investment company ("Closed-End Fund" or "CEF") under the Investment Company Act of 1940 (the "1940 Act"). We operate as an internally managed investment company whereby our officers and employees, under the general supervision of our Board of Directors, conduct our operations.
H&H Ventures Management, Inc.SM ("Ventures") is a 100 percent owned subsidiary of the Company. Ventures is taxed under Subchapter C (a "C Corporation") of the Internal Revenue Code of 1986 (the "Code"). Harris Partners I, L.P, is a limited partnership and, from time to time, may be used to hold certain interests in our portfolio companies. The partners of Harris Partners I, L.P., are Ventures (sole general partner) and the Company (sole limited partner). Ventures pays taxes on income generated by its operations as well as on any non-passive investment income generated by Harris Partners I, L.P. For the year ended December 31, 2018, there was no non-passive investment income generated by Harris Partners I, L.P. Ventures, as the sole general partner, consolidates Harris Partners I, L.P. The Company consolidates Ventures for financial reporting purposes.
The Company is the Managing Member of H&H Co-Investment Partners, LLC, a limited liability company formed to facilitate the opportunity for interested investors to co-invest alongside the Company in its private portfolio companies. As of December 31, 2018, H&H Co-Investment Partners did not have any capital under management. The Company is also the Managing Member of 180 Degree Capital Management, LLC ("180CM"), a limited liability company formed to facilitate the opportunity for interested investors to co-invest alongside the Company in its publicly traded portfolio companies. As of December 31, 2018, the Company had $6.1 million in capital under management in two funds, TheStreet SPV Series ("TST SPV") and 180.2 SPV Series ("180.2 SPV"), each a series of 180CM.
The Company may, in certain cases, receive management fees and carried interest on profits generated on invested capital from any capital under management if and when capital is raised and if and when profits are realized, respectively. The Company does not consolidate the operations of any capital managed in separate series of 180CM and it does not expect to consolidate the operations of any capital managed in separate series of H&H Co-Investment Partners, if and when it has capital under management.
180 Degree Capital BD, LLC ("180BD") is a 100 percent owned subsidiary of the Company. 180BD was formed to provide services to the Company related to fundraising for co-investment funds and not for investment returns. 180BD is a registered broker-dealer with the Financial Industry Regulatory Authority ("FINRA"). The Company consolidates 180BD for financial reporting purposes. 180BD is currently a disregarded entity for tax purposes under the Code.
NOTE 2. SUMMARY OF SIGNIFICANT ACCOUNTING POLICIES
The following is a summary of significant accounting policies followed in the preparation of the consolidated financial statements:
Principles of Consolidation. The consolidated financial statements have been prepared in accordance with accounting principles generally accepted in the US ("GAAP") and Articles 6 and 12 of Regulation S-X of the SEC and include the accounts of the Company and its wholly owned subsidiaries. The Company is an investment company following accounting and reporting guidance in Accounting Standards Codification 946. In accordance with GAAP and Regulation S-X under 17 C.F.R. Part 210, the Company may only consolidate its interests in investment company subsidiaries and controlled operating companies whose business consists of providing services to the Company. Our wholly owned subsidiaries, Ventures and 180BD, are controlled operating companies that provide services to us and are, therefore, consolidated. All significant intercompany accounts and transactions have been eliminated in consolidation.
Use of Estimates. The preparation of the consolidated financial statements in conformity with GAAP requires management to make estimates and assumptions that affect the reported amounts of assets and liabilities and contingent assets and liabilities and the reported amounts of revenues and expenses. Actual results could differ from these estimates, and the differences could be material. The most significant estimates relate to the fair valuations of our investments.
Portfolio Investment Valuations. Investments are stated at "value" as defined in the 1940 Act and in the applicable regulations of the SEC and in accordance with GAAP. Value, as defined in Section 2(a)(41) of the 1940 Act, is (i) the market price for those securities for which a market quotation is readily available and (ii) the fair value as determined in good faith by, or under the direction of, the Board of Directors for all other assets. The Valuation Committee, comprised of all of the independent Board members, is responsible for determining the valuation of the Company’s assets within the guidelines established by the Board of Directors. The Valuation Committee receives information and recommendations from management. An independent valuation firm also reviews select portfolio company valuations. The independent valuation firm does not provide independent valuations. The fair values assigned to these investments are based on available information and do not necessarily represent amounts that might ultimately be realized when that investment is sold, as such amounts depend on future circumstances and cannot reasonably be determined until the individual investments are actually liquidated or become readily marketable. The Valuation Committee values the Company's investment assets as of the end of each calendar quarter and as of any other time requested by the Board of Directors.
Accounting Standards Codification Topic 820, "Fair Value Measurements," ("ASC 820") defines fair value as the price that would be received to sell an asset or paid to transfer a liability in an orderly transaction between market participants at the measurement date (exit price). It applies fair value terminology to all valuations whereas the 1940 Act applies market value terminology to readily marketable assets and fair value terminology to other assets.
The main approaches to measuring fair value utilized are the market approach, the income approach and the hybrid approach.
| |
• | Market Approach (M): The market approach focuses on inputs and not techniques. The market approach may use quantitative inputs such as prices and other relevant information generated by market transactions involving identical or comparable assets or liabilities and the values of market multiples derived from a set of comparable companies. The market approach may also use qualitative inputs such as progress toward milestones, the long-term potential of the business, current and future financing requirements and the rights and preferences of certain securities versus those of other securities. The selection of the relevant inputs used to derive value under the market approach requires judgment considering factors specific to the significance and relevance of each input to deriving value. |
| |
• | Income Approach (I): The income approach focuses on techniques and not inputs. The income approach uses valuation techniques to convert future amounts (for example, revenue, cash flows or earnings) to a single present value amount (discounted). The measurement is based on the value indicated by current market expectations about those future amounts. Those valuation techniques include present value techniques; option-pricing models, such as the Black-Scholes-Merton formula (a closed-form model) and a binomial model (a lattice model), which incorporate present value techniques; and the multi-period excess earnings method, which is used to measure the fair value of certain assets. |
| |
• | Hybrid Approach (H): The hybrid approach uses elements of both the market approach and the income approach. The hybrid approach calculates values using the market and income approach, individually. The resulting values are then distributed among the share classes based on probability of exit outcomes. |
ASC Topic 820 classifies the inputs used to measure fair value by these approaches into the following hierarchy:
| |
• | Level 1 (L1): Unadjusted quoted prices in active markets for identical assets or liabilities; |
| |
• | Level 2 (L2): Inputs other than quoted prices included within Level 1 that are observable for the asset or liability, either directly or indirectly. These include quoted prices in active markets for similar assets or liabilities, or quoted prices for identical or similar assets or liabilities in markets that are not active, or inputs other than quoted prices that are observable for the asset or liability, either directly or indirectly, for substantially the full term of the financial instrument. Level 2 inputs are in those markets for which there are few transactions, the prices are not current, little public information exists or instances where prices vary substantially over time or among brokered market makers; and |
| |
• | Level 3 (L3): Inputs to the valuation methodology are unobservable and significant to the fair value measurement. Unobservable inputs are those inputs that reflect our own assumptions that market participants would use to price the asset or liability based upon the best available information. |
Financial assets and liabilities are classified in their entirety based on the lowest level of input that is significant to the fair value measurement and are not necessarily an indication of risks associated with the investment.
As of December 31, 2018, our financial statements include investments fair valued by the Board of Directors of $49,929,650 and one investment valued under the equity method at $246,229. The fair values and equity method value were determined in good faith by, or under the direction of, the Board of Directors. The fair value amount includes the values of our privately held investments as well as our stock options and restricted stock units of TheStreet, Inc., and our warrants of OpGen, Inc., which are publicly traded companies. Our investment in Accelerator IV-New York Corporation is accounted for under the equity method of accounting as it represents non-controlling interest in operating entities that provide investment advisory services to the Company. Under the equity method, investments are carried at cost, plus or minus the Company’s equity in the increases and decreases in the investee’s net assets after the date of acquisition and certain other adjustments. The Company’s share of the net income or loss of the investee is included in "Share of loss on equity method investment" on the Company’s Consolidated Statement of Operations. Upon sale of investments, the values that are ultimately realized may be different from the fair value presented in the Company's financial statements. The difference could be material.
Cash. Cash includes demand deposits. Cash is carried at cost, which approximates fair value.
Restricted Cash. At December 31, 2018, we held $46,151 in "Restricted cash", as security deposits for a sub-lease. These funds are not considered part of operating cash of the Company.
Unaffiliated Rights to Payments. At December 31, 2018, the outstanding potential milestone payments from Amgen, Inc.’s acquisition of BioVex Group, Inc., were valued at $2,019,283. The milestone payments are derivatives and valued using the probability-adjusted, present value of proceeds from future payments that would be due upon successful completion of certain regulatory and sales milestones.
At December 31, 2018, the outstanding potential rights to payments from Xenio Holdings, Inc.'s merger with Xenio Systems, Inc., were valued at $0.
Prepaid Expenses. We include prepaid insurance premiums and deferred financing charges in "Prepaid expenses." Prepaid insurance premiums are recognized over the term of the insurance contract and are included in "Insurance expense" in the Company's Consolidated Statement of Operations.
Property and Equipment. Property and equipment are included in "Other assets" and are carried at $18,269 at December 31, 2018, representing cost of $201,404, less accumulated depreciation of $183,135. Depreciation is provided using the straight-line method over the estimated useful lives of the property and equipment. We estimate the useful lives to be five to ten years for furniture and fixtures, and three years for computer equipment.
Post-Retirement Plan Liabilities. Until it was terminated on April 27, 2017, the Company provided a Retiree Medical Benefit Plan for employees who met certain eligibility requirements. Until it was terminated on May 5, 2011, the Company also provided an Executive Mandatory Retirement Benefit Plan for certain individuals employed by us in a bona fide executive or high policy-making position. The net periodic post-retirement benefit cost includes service cost and interest on the accumulated post-retirement benefit obligation. Unrecognized actuarial gains of $ 183,297, are recognized as net periodic benefit cost, pursuant to the Company's historical accounting policy in "Salaries, bonus and benefits" in the Company's Consolidated Statement of Operations. The impact of plan amendments was amortized over the employee's average service period as a reduction of net periodic benefit cost. Unamortized prior service cost was fully amortized during 2017 as a result of the termination of the Retiree Medical Benefit Plan.
Interest Income Recognition. Interest income, including amortization of premium and accretion of discount, is recorded on an accrual basis. When accrued interest is determined not to be recoverable, the Company ceases accruing interest and writes off any previously accrued interest. Securities are deemed to be non-income producing if investments have not paid dividends or interest within the last 12 months. Write-offs are netted in interest income. During the year ended December 31, 2018, the Company had write-offs that netted a reduction of interest income of $30,544 in cash interest on senior secured debt, secured and unsecured convertible bridge notes, interest-bearing accounts and U.S. government securities. During the year ended December 31, 2018, the Company recorded, on a net basis, $19,206 of bridge note cash interest. During the year ended December 31, 2018, the Company recorded, on a net basis, $59,671 of bridge note PIK interest.
When the fair value of a security that includes PIK interest is less than the accrued interest, the Company may place the security on non-accrued status. Starting April 1, 2018 and through December 31, 2018, Black Silicon Holdings, Inc. is on non-accrued status. Had interest been accrued, an additional $78,128 in income would have been included in "Controlled affiliated companies-PIK" in the Company's Consolidated Statement of Operations. Starting July 1, 2018 and through December 31, 2018, Produced Water Absorbents, Inc. ("PWA") is on non-accrued status. Had interest been accrued, an additional $486,470 in income would have been included in "Non-controlled affiliated companies-cash" in the Company's Consolidated Statement of Operations. An additional $49,562 was written-off on the senior secured debt issued by PWA to the Company due to Management's assessment of collectibility.
Yield Enhancing Fee Income on Debt Securities. Yield enhancing fee income received in connection with our non-convertible debt investments are deferred. The unearned fee income is accreted into income based on the effective interest method over the life of the investment. During the year ended December 31, 2018, total yield enhancing fees accreted into investment income was $182,683.
Fee Income for Providing Managerial Assistance to Portfolio Companies. During the year ended December 31, 2018, the Company earned $75,000 in cash income and $57,940 in non-cash income, owing to certain of its employees providing managerial assistance to and/or as members of the board of directors of HALE.life Corporation and TheStreet, Inc. We recognize revenues from fee income for providing managerial assistance as those services are provided.
Management Fees and Carried Interest from Managed Fund. As of December 31, 2018, the Company managed $6.1 million of external capital as the investment manager of TST SPV and 180.2 SPV (together, the "Managed SPVs"). The Company receives management fees for its services as investment manager that are earned and accrued from the date of inception of each Managed SPV through the date of liquidation of the fund. These management fees will be paid to us upon liquidation of the fund regardless of the performance of the fund. The accrued management fees for the year ended December 31, 2018, were $73,214. Management fee income is recorded in "Management fee income" in the Company's Consolidated Statement of Operations. Management fee income is paid upon the termination of each Managed SPV.
As Managing Member of the Managed SPVs, we are entitled to carried interest on profits generated on the managed capital. If the Managed SPVs were liquidated as of December 31, 2018, we would receive approximately $421,000. We do not include accruals for carried interest in our financial statements until such carried interest is received and/or the possibility of reversal of such accrual is not probable. We assessed the possibility of a reversal of such accrual as probable as of December 31, 2018, and therefore do not include such accrual in our financial statements as of that date.
Rent Expense and Sub-lease Income. Our lease at 1450 Broadway, New York, New York, commenced on January 21, 2010. The lease expires on December 31, 2019. The base rent is $36 per square foot with a 2.5 percent increase per year over the 10 years of the lease, subject to a full abatement of rent for four months and a rent credit for six months throughout the lease term. We apply these rent abatements, credits, escalations and landlord payments on a straight-line basis in the determination of rent expense over the lease term.
On June 9, 2017, we entered into a sub-lease for our office space in New York that began on June 15, 2017, and extends through the remainder of our lease term of December 31, 2019. The base rent is $37 per square foot with a 3 percent increase per year, subject to an abatement of rent and a rent credit to the sub-lessee for 3.9 months. We apply the rent abatement and credit on a straight-line basis in the determination of rental income over the sub-lease term.
During the year ended December 31, 2018, the Company earned rental income of $248,666, from the sub-lease of our office space in New York, which is recorded as "Sub-lease income" under investment income in the Company's Consolidated Statement of Operations.
We currently lease and run our daily operations in approximately 1,250 square feet of office space in Montclair, New Jersey, on a month-to-month basis. The base rent is approximately $26 per square foot. Either the Company or the landlord may terminate the lease at any time with two months' written notice to either party.
Realized Gain or Loss and Unrealized Appreciation or Depreciation of Portfolio Investments. Realized gain or loss is recognized when an investment is disposed of and is computed as the difference between the Company's cost basis in the investment at the disposition date and the net proceeds received from such disposition. Realized gain or loss on investment transactions are determined by specific identification. Unrealized appreciation or depreciation is computed as the difference between the fair value of the investment and the cost basis of such investment.
Income Taxes. As discussed in Note 9. Income Taxes, we did not qualify as a Regulated Investment Company ("RIC") under Subchapter M of the Code in 2018 and therefore will be taxed as a C Corporation. We did not accrue for any income taxes as of December 31, 2018, as we did not generate ordinary income through that date. While we did not qualify as a RIC in 2018, we currently intend to qualify as a RIC in future years . The Company has capital loss carryforwards that can be used to offset net realized capital gains. The Company also has operating loss carryforwards that can be used to offset operating income and net realized capital gains in years when we fail to qualify as a RIC. The Company recognizes interest and penalties in income tax expense. We pay federal, state and local income taxes on behalf of our wholly owned subsidiary, Ventures, which is a C Corporation. See Note 9. Income Taxes for further discussion.
Foreign Currency Translation. The accounting records of the Company are maintained in U.S. dollars. All assets and liabilities denominated in foreign currencies are translated into U.S. dollars based on the rate of exchange of such currencies against U.S. dollars on the date of valuation. The Company does not isolate the portion of the results of operations that arises from changes in foreign currency rates on investments held on its Consolidated Statement of Operations.
Securities Transactions. Securities transactions are accounted for on the date the transaction for the purchase or sale of the securities is entered into by the Company (i.e., trade date). Securities transactions outside conventional channels, such as private transactions, are recorded as of the date the Company obtains the right to demand the securities purchased or to collect the proceeds from a sale and incurs the obligation to pay for the securities purchased or to deliver the securities sold.
Concentration of Credit Risk. The Company places its cash and cash equivalents with financial institutions and, at times, cash held in depository accounts may exceed the Federal Deposit Insurance Corporation's insured limit and is subject to the credit risk of such institutions to the extent it exceeds such limit.
Concentration of Investor Risk. As of December 31, 2018, two investors, Ariel Investments, LLC and Financial Consulate Inc., owned approximately 14.0 percent and 6.8 percent, respectively, of our outstanding shares.
Recent Accounting Pronouncements and Adoptions. The SEC adopted changes to Regulation S-X to simplify the reporting of information by registered investment companies in financial statements. The amendments require presentation of the total, rather than the components of distributable loss on the Company's Consolidated Statement of Assets and Liabilities. The amendments also removed the requirement for parenthetical disclosure of undistributed net investment income (loss) on the Consolidated Statement of Changes in Net Assets. The Company reflected these changes in its Consolidated Financial Statements.
On August 28, 2018, the FASB issued ASU 2018-13, "Disclosure Framework - Changes to the Disclosure Requirements for Fair Value Measurement." This ASU includes new, eliminated, and modified disclosure requirements. In addition, this ASU clarifies that materiality is an appropriate consideration for entities when evaluating disclosure requirements. The guidance is effective for fiscal years, and interim periods within those fiscal years, beginning after December 15, 2019. An entity is permitted to early adopt any eliminated or modified disclosures upon issuance of this ASU and delay adoption of the new disclosures until their effective date. The Company has early adopted the eliminated and modified disclosures, as permitted by this ASU, and it did not have a material impact in its Consolidated Financial Statements as the changes are solely disclosure related.
On March 10, 2017, the FASB issued ASU 2017-7, "Compensation - Retirement Benefits (Topic 715): Improving the Presentation of Net Periodic Pension Cost and Net Periodic Post-retirement Benefit Cost." This ASU covers disclosure requirement for service cost components related to pension and post-retirement benefit costs. The guidance is effective for fiscal years, and interim periods within those fiscal years, beginning after December 15, 2017, with early adoption permitted. The Company adopted this ASU in its Consolidated Financial Statements, and it did not have a material impact.
On August 26, 2016 and November 17, 2016, the FASB issued ASU 2016-15, "Statement of Cash Flows (Topic 230): Classification of Certain Cash Receipts and Cash Payments" and ASU 2016-18, "Statement of Cash Flows (Topic 230): Restricted Cash", respectively. These ASUs are intended to reduce diversity in practice in how certain transactions and restricted cash are classified and presented in the statement of cash flows. ASU 2016-15 affects how distributions received from equity method investees and ASU 2016-18 affects the presentation of restricted cash in the statement of cash flows will be reported. These ASUs will be effective for fiscal years, and interim periods within those fiscal years, beginning after December 15, 2017, with early adoption permitted. The Company adopted this ASU in its Consolidated Financial Statements, and it did not have a material impact.
On June 16, 2016, the FASB issued ASU 2016-13, "Financial Instruments - Credit Losses (Topic 326): Measurement of Credit Losses on Financial Instruments." This ASU is intended to introduce new guidance for the accounting for credit losses on instruments within scope based on an estimate of current expected credit losses. The guidance will be effective for fiscal years, and interim periods within those fiscal years, beginning after December 15, 2019, with early adoption permitted. The Company currently assesses the collectibility of any interest receivables and includes such determinations in the amounts included on its balance sheet. All other financial instruments owned by the Company are fair valued. As such, the Company does not currently anticipate that adoption of this ASU will have a material impact on its financial statements.
On February 25, 2016, the FASB issued ASU 2016-02, "Leases" (Topic 842). This ASU supersedes the existing guidance for the accounting for leases. Under the new guidance, lessees are required to recognize a right-of-use asset and a lease liability for all leases. The new guidance will continue to classify leases as either financing or operating, with classification affecting the pattern of expense recognition. The accounting applied by a lessor under the new guidance will be substantially equivalent to current lease accounting guidance. This ASU is required to be applied with a modified retrospective approach to each prior reporting period presented and provides for certain practical expedients. The guidance will be effective for fiscal years, and interim periods within those fiscal years, beginning after December 15, 2018, with early adoption permitted. For leases with a term of 12 months or less, a lessee is permitted to make an accounting policy election by class of underlying asset not to recognize lease assets and lease liabilities. If a lessee makes this election, it should recognize lease expense for such leases generally on a straight-line basis over the lease term. At the time of adoption of this ASU, the Company will have two leases, one that ends on December 31, 2019, related to its former space in New York, New York, and a month-to-month lease at its current location in Montclair, New Jersey. The Company currently plans to make the election discussed above, which is consistent with how the Company currently accounts for its leases. The Company, therefore, does not expect adoption of this ASU to have a material impact on its financial statements.
On May 28, 2014, the FASB and the International Accounting Standards Board ("IASB") issued ASU 2014-09, "Revenue from Contracts with Customers (Topic 606)," their final converged standard on revenue recognition. This ASU provides a single, comprehensive revenue recognition model for all contracts with customers and supersedes current revenue recognition guidance. The guidance contains principles that an entity will apply to determine the measurement of revenue and timing of when it is recognized. The underlying principle is that an entity will recognize revenue to depict the transfer of goods or services to customers at an amount that the entity expects to be entitled to in exchange for those goods or services. This ASU also includes enhanced disclosures that are significantly more comprehensive than those in existing revenue standards. This ASU, as amended, is applicable for most entities starting in 2018. The guidance is be effective for fiscal years, and interim periods within those fiscal years, beginning after December 15, 2017. The Company generates fees for providing managerial services to portfolio companies, management fees and carried interest from the management of capital in funds and special purpose vehicles. The Company adopted this ASU in its financial statements, and discloses the recognition of these revenues in its Consolidated Statement Financial Statements. The adoption of this ASU did not have a material impact on the Company's Consolidated Financial Statements as its revenue recognition policies were historically substantially similar to those prescribed by the ASU.
NOTE 3. BUSINESS RISKS AND UNCERTAINTIES
Our business activities contain elements of risk. We consider the principal types of market risk to be valuation risk, diversification risk, interest rate risk and foreign currency risk. Although we are risk-seeking rather than risk-averse in our investments, we consider the management of risk to be essential to our business.
Valuation Risk
Value, as defined in Section 2(a)(41) of the 1940 Act, is (i) the market price for those securities for which market quotations are readily available and (ii) fair value as determined in good faith by, or under the direction of, the Board of Directors for all other assets. See Note 2. Summary of Significant Accounting Policies for further discussion.
We have historically invested primarily in privately held companies, the securities of which are inherently illiquid. We are currently focused on investing in what we believe are deeply undervalued microcapitalization publicly traded companies. Our publicly traded investments account for approximately 33.2 percent of the value of our portfolio of investments. Although these companies are publicly traded, their stock may not trade at high volumes, which may restrict our ability to sell our positions and prices can be volatile. We may also be subject to restrictions on transfer and/or other lock-up provisions after these companies initially go public. Many of our privately held and publicly traded businesses tend to not have attained profitability, and many of these businesses also lack management depth and have limited or no history of operations. Because of the speculative nature of our investments and the lack of a liquid market for and restrictions on transfers of privately held investments, there is greater risk of loss relative to traditional marketable investment securities.
Approximately 66.5 percent of the portion of our portfolio that was fair valued was comprised of securities of privately held companies and rights to potential future milestone payments as well as our restricted stock units and stock options of TheStreet, Inc., and our warrants of OpGen, Inc., which are publicly traded companies. Approximately 0.3 percent of the portion of our equity-focused portfolio that was valued according to the equity method was comprised of one privately held company. Because there is typically no public or readily ascertainable market for our interests in the small privately held companies in which we invest, the valuation of the securities in that portion of our portfolio is determined in good faith by our Valuation Committee, which is comprised of all of the independent members of our Board of Directors. The values are determined in accordance with our Valuation Procedures and are subject to significant estimates and judgments. The fair value of the securities in our portfolio may differ significantly from the values that would be placed on these securities if a ready market for the securities existed. Any changes in valuation are recorded in the Company's Consolidated Statement of Operations as "Change in unrealized appreciation (depreciation) on investments." Changes in valuation of any of our investments in privately held companies from one period to another may be significant.
Diversification Risk
While we are subject to certain diversification requirements regarding the concentration of investments in any one industry or group of industries, we do not choose investments based on a strategy of diversification. We also do not rebalance the portfolio should one of our portfolio companies increase in value substantially relative to the rest of the portfolio. Therefore, the value of our portfolio may be more vulnerable to microeconomic events affecting a single sector, industry or portfolio company and to general macroeconomic events that may be unrelated to our portfolio companies. These factors may subject the value of our portfolio to greater volatility than a company that follows a diversification strategy. As of December 31, 2018 our largest 10 investments by value accounted for approximately 77 percent of the value of our investment portfolio. Our largest three investments, by value, AgBiome, LLC, TheStreet, Inc., and D-Wave Systems, Inc., accounted for approximately 18 percent, 13 percent and 13 percent, respectively, of our investment portfolio at December 31, 2018. AgBiome, LLC, and D-Wave Systems, Inc., are privately held portfolio companies, and TheStreet, Inc. is a publicly traded company.
Interest Rate Risk
Interest rate sensitivity refers to the change in earnings that may result from changes in the level of interest rates. We may invest in both short- and long-term U.S. government and agency securities. To the extent that we invest in short- and long-term U.S. government and agency securities, changes in interest rates result in changes in the value of these obligations that result in an increase or decrease of our net asset value. The level of interest rate risk exposure at any given point in time depends on the market environment, the expectations of future price and market movements, and the quantity and duration of long-term U.S. government and agency securities held by the Company, and it will vary from period to period.
In addition, market interest rates for high-yield corporate debt may be an input in determining value of our investments in debt securities of privately held and publicly traded companies. Significant changes in these market rates could affect the value of our debt securities as of the valuation date of measurement of value. While we do not currently have any investments in debt securities with floating interest rates, investment income in such securities should we acquire them in the future could be adversely affected by changes in interest rates.
Foreign Currency Risk
Most of our investments are denominated in U.S. dollars, based on country of issuer. We currently have one investment denominated in Canadian dollars. We are exposed to foreign currency risk related to potential changes in foreign currency exchange rates pertaining to this investment. The potential loss in fair value on this investment resulting from a 10 percent adverse change in quoted foreign currency exchange rates is $450,717 at December 31, 2018. We do not currently hedge our exposure to fluctuations in currencies.
NOTE 4. FAIR VALUE OF INVESTMENTS
At December 31, 2018, our financial assets valued at fair value were categorized as follows in the fair value hierarchy:
|
| | | | | | | | | | | | | | | | |
| | Fair Value Measurement at Reporting Date Using: |
Description | | Unadjusted Quoted Prices in Active Markets for Identical Assets (Level 1) |
| |
Significant Other Observable Inputs (Level 2) |
| |
Significant Unobservable Inputs (Level 3) |
| | December 31, 2018 |
|
| | | | | | | | |
Privately Held Portfolio Companies: | | | | |
| | |
| | |
|
| | | | | | | | |
Preferred Stock | | $ | 0 |
| | $ | 0 |
| | $ | 45,226,020 |
| | $ | 45,226,020 |
|
Bridge Notes | | 0 |
| | 0 |
| | 1,421,280 |
| | 1,421,280 |
|
Common Stock | | 0 |
| | 0 |
| | 933,963 |
| | 933,963 |
|
Warrants | | 0 |
| | 0 |
| | 31,887 |
| | 31,887 |
|
Senior Secured Debt | | 0 |
| | 0 |
| | 76,863 |
| | 76,863 |
|
LLC Interests | | 0 |
| | 0 |
| | 150,000 |
| | 150,000 |
|
| | | | | | | | |
Publicly Traded Portfolio Companies: | | | | | | | | |
| | | | | | | | |
Common Stock | | $ | 24,869,599 |
| | $ | 0 |
| | $ | 0 |
| | $ | 24,869,599 |
|
Warrants | | 0 |
| | 989 |
| | 202 |
| | 1,191 |
|
Restricted Stock Units and Stock Options | | 0 |
| | 0 |
| | 69,163 |
| | 69,163 |
|
| | | | | | | | |
Total Investments: | | $ | 24,869,599 |
| | $ | 989 |
| | $ | 47,909,378 |
| | $ | 72,779,966 |
|
| | | | | | | | |
Derivative Investments: | | | | | | | | |
| | | | | | | | |
Rights to Payments | | $ | 0 |
| | $ | 0 |
| | $ | 2,019,283 |
| | $ | 2,019,283 |
|
| | | | | | | | |
Total Financial Assets: | | $ | 24,869,599 |
| | $ | 989 |
| | $ | 49,928,661 |
| | $ | 74,799,249 |
|
Significant Unobservable Inputs
The table below presents the valuation technique and quantitative information about the significant unobservable inputs utilized by the Company in the fair value measurements of Level 3 assets. Unobservable inputs are those inputs for which little or no market data exists and, therefore, require an entity to develop its own assumptions.
|
| | | | | | | | | |
| Fair Value as of 12/31/2018 | | Valuation Approach(es) | | Unobservable Input(s) | | Range(s) (Weighted Average(a)) |
| | | | | | | |
| | | | | Public Comparable Adjustment (Including Non-Performance Risk) | | 0.0% (0.0%) |
| | | | | Price Per Share | | $1.30 ($1.30) |
| | | | | Volatility | | 82.5% (82.5%) |
Preferred Stock | $ | 2,854,030 |
| | Hybrid Approach | | Time to Exit / Cash Flows (Years) | | 4.4 (4.4) |
| | | | | Price Per Share | | $0.03 - $6.33 ($3.06) |
| | | | | Public Comparable Adjustment (Including Non-Performance Risk) | | -86.3% - 21.4% (-4.3%) |
| | | | | Volatility | | 46.5% - 91.6% (69.3%) |
Preferred Stock | 32,925,125 |
| | Income Approach | | Time to Exit / Cash Flows (Years) | | 5.0 - 7.8 (5.2) |
| | | | | Revenue Multiples | | 3.1 (3.1) |
| | | | | Time to Exit (Years) | | 1.0 (1.0) |
| | | | | Discount for Lack of Marketability | | 16.2% (16.2%) |
Preferred Stock | 9,446,865 |
| | Market Approach | | Price Per Share | | $1.84 ($1.84) |
Bridge Notes | 134,276 |
| | Income Approach | | Estimated Value to Cost Ratio at Payout | | 0.14 - 0.50 (0.44) |
|
|
| |
| | Revenue Multiples | | 3.1 (3.1) |
|
|
| |
| | Time to Exit (Years) | | 1.0 (1.0) |
|
|
| |
| | Discount for Lack of Marketability | | 16.2% (16.2%) |
Bridge Notes | 1,287,004 |
| | Market Approach | | Estimated Value to Cost Ratio at Conversion | | 1.00 (1.00) |
| | | | | Discount for Lack of Marketability | | 14.6% (14.6%) |
| | | | | Public Comparable Adjustment (Including Non-Performance Risk) | | 0.0% (0.0%) |
| | | | | Volatility | | 46.5% - 79.5% (69.8%) |
| | | | | Time to Exit (Years) | | 5.0 - 6.0 (5.2) |
Common Stock | 933,963 |
| | Income Approach | | Price Per Share | | $0.21 - $1.00 ($0.45) |
| | | | | Volatility | | 55.6% (55.6%) |
| | | | | Revenue Multiples | | 1.8 (1.8) |
| | | | | Time to Exit (Years) | | 0.5 (0.5) |
Common Stock | 0 |
| | Market Approach | | Discount for Lack of Marketability | | 9.3% (9.3%) |
| | | | | Price Per Share | | $1.14 - $2.27 ($2.21) |
| | | | | Volatility | | 28.6% - 95.0% (29.4%) |
Warrants | 32,089 |
| | Income Approach | | Time to Exit (Years) | | 0.4 - 6.1 (3.72) |
Warrants | 0 |
| | Market Approach | | Price Per Share | | $0.00 ($0.00) |
| | | | | Revenue Multiple | | 1.8x (1.8x) |
| | | | | Exit Date | | 0.5 (0.5) |
| | | | | Volatility Rate | | 55.6% (55.6%) |
Senior Secured Debt | 76,863 |
| | Market Approach | | Discount for Lack of Marketability | | 9.3% (9.3%) |
LLC Interests | 150,000 |
| | Market Approach | | Bid/Ask | | $50,000-$250,000 ($150,000) |
| | | | | | | |
|
| | | | | | | | | |
| Fair Value as of 12/31/2018 | | Valuation Approach(es) | | Unobservable Input(s) | | Range(s) (Weighted Average(a)) |
| | | | | Volatility | | 51.0% (51.0%) |
Restricted Stock Units and Stock Options | $ | 4,495 |
| | Income Approach | | Time to Exit (Years) | | 0.1 (0.1) |
| | | | | Discount for Lack of Marketability | | 4.4% (4.4%) |
| | | | | Volatility | | 51.0% (51.0%) |
Restricted Stock Units and Stock Options | 64,668 |
| | Market Approach | | Time to Exit | | 0.1 (0.1) |
| | | | | Probability of Achieving Independent Milestones | | 0.0% - 75.0% (75.0%) |
| | | | | Probability of Achieving Dependent Milestones | | 9.4% - 75.0% (52.0%) |
Rights to Payments | 2,019,283 |
| | Income Approach | | Time to Cash Flows (Years) | | 2.0 - 8.0 (4.9) |
| | | | | | | |
Total | $ | 49,928,661 |
| | | | | | |
(a) Weighted average based on fair value at December 31, 2018.
Valuation Methodologies and Inputs for Level 3 Assets
The following sections describe the valuation techniques and significant unobservable inputs used to measure Level 3 assets.
Preferred Stock, Preferred Units, LLC Interests, Bridge Notes and Common Stock
Preferred stock, preferred units, LLC interests, bridge notes and common stock are valued by either a market, income or hybrid approach using internal models with inputs, most of which are not market observable. Common inputs for valuing Level 3 investments include prices from recently executed private transactions in a company’s securities or unconditional firm offers, revenue multiples of comparable publicly traded companies, merger and acquisition ("M&A") transactions consummated by comparable companies, discounts for lack of marketability, rights and preferences of the class of securities we own as compared with other classes of securities the portfolio company has issued, particularly related to potential liquidity scenarios of an initial public offering ("IPO") or an acquisition transaction, estimated time to exit, volatilities of comparable publicly traded companies and management’s best estimate of risk attributable to non-performance risk. Certain securities are valued using the present value of future cash flows.
We may also consider changes in market values for sets of comparable companies when recent private transaction information is not available and/or in consideration of non-performance risk. We define non-performance risk as the risk that the price per share (or implied valuation of a portfolio company) or the effective yield of a debt security of a portfolio company, as applicable, does not appropriately represent the risk that a portfolio company with negative cash flow will be: (a) unable to raise capital, will need to be shut down and will not return our invested capital; or (b) able to raise capital, but at a valuation significantly lower than the implied post-money valuation of the last round of financing. We assess non-performance risk for each private portfolio company quarterly. Our assessment of non-performance risk typically includes an evaluation of the financial condition and operating results of the company, the company's progress towards milestones, and the long-term potential of the business and technology of the company and how this potential may or may not affect the value of the shares owned by us. An increase to the non-performance risk or a decrease in the private offering price of a future round of financing from that of the most recent round would result in a lower fair value measurement and/or a change in the distribution of value among the classes of securities we own.
Option pricing models place a high weighting on liquidation preferences, which means that small differences in how the preferences are structured can have a material effect on the fair value of our securities at the time of valuation and also on future valuations should additional rounds of financing occur with senior preferences. As such, valuations calculated by option pricing models may not increase if 1) rounds of financing occur at higher prices per share, 2) liquidation preferences include multiples on investment, 3) the amount of invested capital is small and/or 4) liquidation preferences are senior to prior rounds of financing. Additionally, an increase in the volatility assumption generally increases the enterprise value calculated in an option pricing model. An increase in the time to exit assumption also generally increases the enterprise value calculated in an option pricing model. Variations in the expected time to exit or expected volatility assumptions have a significant impact on fair value.
Bridge notes commonly contain terms that provide for the conversion of the full amount of principal, and sometimes interest, into shares of preferred stock at a defined price per share and/or the price per share of the next round of financing. The use of a discount for non-performance risk in the valuation of bridge notes would indicate the potential for conversion of only a portion of the principal, plus interest when applicable, into shares of preferred stock or the potential that a conversion event will not occur and that the likely outcome of a liquidation of assets would result in payment of less than the remaining principal outstanding of the note. An increase in non-performance risk would result in a lower fair value measurement.
Warrants and Options
We use the Black-Scholes-Merton option-pricing model to determine the fair value of warrants and options held in our portfolio unless there is a publicly traded active market for such warrants and options or another indication of value such as a sale of the portfolio company. Option pricing models, including the Black-Scholes-Merton model, require the use of subjective input assumptions, including expected volatility, expected life, expected dividend rate, and expected risk-free rate of return. In the Black-Scholes-Merton model, variations in the expected volatility or expected term assumptions have a significant impact on fair value. Because certain securities underlying the warrants in our portfolio are not publicly traded, many of the required input assumptions are more difficult to estimate than they would be if a public market for the underlying securities existed.
An input to the Black-Scholes-Merton option-pricing model is the value per share of the type of stock for which the warrant is exercisable as of the date of valuation. This input is derived according to the methodologies discussed in "Preferred Stock, Preferred Units, LLC Interests, Bridge Notes and Common Stock."
Rights to Payments
Rights to payments are valued using a probability-weighted discounted cash flow model. As part of Amgen Inc.’s acquisition of our former portfolio company, BioVex Group, Inc., we are entitled to potential future milestone payments based upon the achievement of certain regulatory and sales milestones. We are also entitled to future payments from Xenio Holdings, Inc., which merged with one of our former portfolio companies, Xenio Systems, Inc., in the event of a sale of Xenio Holdings, Inc. We assign probabilities to the achievements of the various milestones. Milestones identified as independent milestones can be achieved irrespective of the achievement of other contractual milestones. Dependent milestones are those that can only be achieved after another, or series of other, milestones are achieved. The interest rates used in these models are observable inputs from sources such as the published interest rates for corporate bonds of the acquiring or comparable companies.
Senior Secured Debt
We currently hold investments in senior secured debt securities. We value these securities either by an income or market approach. The income approach uses valuation techniques to convert future amounts (for example, cash flows or earnings) to a single present value amount (discounted). The measurement is based on the value indicated by current market expectations about those future amounts. Common inputs for valuing Level 3 debt investments include: the effective yield of the debt investment or, in the case where we have received warrant coverage, the warrant-adjusted effective yield of the security, adjustments for changes in the yields of comparable publicly traded high-yield debt funds and risk-free interest rates and an assessment of non-performance risk. For debt investments valued by the income approach, an increase in yields would result in a lower fair value measurement. Furthermore, yields would decrease, and value would increase, if the company is exceeding targets and risk has been substantially reduced from the level of risk that existed at the time of investment. Yields would increase, and values would decrease, if the company is failing to meet its targets and risk has been increased from the level of risk that existed at the time of investment. The market approach distributes an estimated value of the entity through the liquidation waterfall to derive value. Common inputs for valuing by the market approach include: multiples of publicly traded comparable companies, time to expected return/exit, discounts for lack of marketability and probability weighted expected return models.
Changes in Valuation Approaches
During the year ended December 31, 2018, the following changes in valuation methodology occurred since December 31, 2017:
| |
• | We changed the valuation methodology of our securities of ORIG3N, Inc., from the income approach to the hybrid approach owing to changes in the inputs used to derive value, particularly related to potential paths to exit. |
| |
• | We changed the valuation methodology of our securities of HALE.life Corporation from the market approach to the income approach owing to the completion of a round of financing that included conversion of outstanding convertible debt securities into convertible preferred securities. |
| |
• | We changed the valuation methodology of our warrants of D-Wave Systems, Inc. from the market approach to the income approach to reflect the impact of time in the valuation as the warrants expire in May 2019. |
| |
• | We changed the valuation methodology of our bridge note in Fleet Health Alliance, LLC from the market approach to the income approach to reflect our focus on repayment versus conversion of the note. |
| |
• | We changed the valuation methodology of our securities of Black Silicon Holdings, Inc. from the income approach to the market approach based on changes in the inputs used to derive value. |
The following chart shows the components of change in the financial assets categorized as Level 3 for the year ended December 31, 2018.
|
| | | | | | | | | | | | | | | | | | | | | | | | | | | | | | | |
| Beginning
Balance
1/1/2018 | | Total Realized
(Losses) Gains
Included in
Changes in
Net Assets | | Transfers | | Total Unrealized
Appreciation (Depreciation)
Included in
Changes in
Net Assets | | Investments in
Portfolio
Companies,
Interest on
Bridge Notes,
and
Amortization
of Loan
Fees, Net | | Disposals
and
Settlements | | Ending
Balance
12/31/2018 | | Amount of Total
Appreciation (Depreciation) for the
year Included in
Changes in Net
Assets Attributable
to the Change in
Unrealized Gains or
Losses Relating to
Assets Still Held at
the Reporting Date |
| | | | | | | | | | | | | | | |
Preferred Stock | $ | 47,610,695 |
| | $ | (11,574,396 | ) | 1 | $ | 2,336,501 |
| 3 | $ | 12,154,264 |
| | $ | 1,282,424 |
| | $ | (6,583,468 | ) | | $ | 45,226,020 |
| | $ | 2,605,454 |
|
| | | | | | | | | | | | | | | |
Bridge Notes | 3,384,394 |
| | (27,857 | ) | 1 | (2,336,501 | ) | 3 | (541,706 | ) | | 1,124,950 |
| | (182,000 | ) | | 1,421,280 |
| | (80,472 | ) |
| | | | | | | | | | | | | | | |
Common Stock | 6,208,189 |
| | (2,885,482 | ) | 1 | (4,937,423 | ) | 4 | 3,059,681 |
| | 0 |
| | (511,002 | ) | | 933,963 |
| | 329,864 |
|
| | | | | | | | | | | | | | | |
Warrants | 110,665 |
| | 13,637 |
| 2 | 0 |
| | (28,356 | ) | | 0 |
| | (63,857 | ) | | 32,089 |
| | (44,512 | ) |
| | | | | | | | | | | | | | | |
Senior Secured Debt | 357,407 |
| | 0 |
| | 0 |
| | (463,227 | ) | | 182,683 |
| | 0 |
| | 76,863 |
| | (463,227 | ) |
| | | | | | | | | | | | | | | |
LLC Interests | 0 |
| | 0 |
| | 0 |
| | 150,000 |
| | 0 |
| | 0 |
| | 150,000 |
| | 150,000 |
|
| | | | | | | | | | | | | | | |
Restricted Stock Units & Stock Options | 43,476 |
| | 0 |
|
| (43,476 | ) | 5 | 69,163 |
| | 0 |
| | 0 |
| | 69,163 |
| | 69,163 |
|
| | | | | | | | | | | | | | | |
Rights to Payments | 2,211,867 |
| | 0 |
|
| 0 |
| | (192,584 | ) | | 0 |
| | 0 |
| | 2,019,283 |
| | (192,584 | ) |
| | | | | | | | | | | | | | | |
Total | $ | 59,926,693 |
| | $ | (14,474,098 | ) | | $ | (4,980,899 | ) | | $ | 14,207,235 |
| | $ | 2,590,057 |
| | $ | (7,340,327 | ) | | $ | 49,928,661 |
| | $ | 2,373,686 |
|
1 Represents gross realized losses.
2 Represents gross realized gains of $40,600, net of gross realized losses of $26,963.
3 The transfer out of "Bridge Note" to "Preferred Stock" was owing conversions.
4 The transfer out of "Common Stock" Level 3 to Level 1 was owing to the Company's shares of TheStreet, Inc. becoming freely tradable following registration of these shares.
5 The transfer out of "Restricted Stock Units" Level 3 to Level 1 was owing to vesting of Restricted Stock Units and units being converted to public Common Stock of TheStreet, Inc.
We elected to use beginning of the year values to recognize transfers in and out of Level 3 investments. For the year ended December 31, 2018, there were transfers out of Level 3 investments totaling $4,937,423. A total of 3,636,363 of our Common Stock of TheStreet, Inc., transferred from Level 3 investments to Level 1 investments owing to the use of unadjusted closing price on its respective stock exchange on December 31, 2018. A total of 32,189 of our Restricted Stock Units of TheStreet, Inc., transferred from Level 3 investments to Level 1 investments owing to vesting and conversion to public Common Stock.
NOTE 5. INDUSTRY DIVERSIFICATION
The following table shows the percentage of our net assets invested by industry as of December 31, 2018.
|
| | | | | | | | | | | |
Industry | Value as of December 31, 2018 | | % of Net Assets | | Value as of December 31, 2018 | | % of Net Assets |
Apparel, Accessories & Luxury Goods | | | | | $ | 44,554 |
| | 0.1% |
Unaffiliated Portfolio Companies | $ | 44,554 |
| | 0.1% | | | | |
Non-Controlled Affiliated Portfolio Companies | 0 |
| | 0.0% | | | | |
Controlled Affiliated Portfolio Companies | 0 |
| | 0.0% | | | | |
Application Software | | | | | 2,361,053 |
| | 2.9% |
Unaffiliated Portfolio Companies | 0 |
| | 0.0% | | | | |
Non-Controlled Affiliated Portfolio Companies | 2,361,053 |
| | 2.9% | | | | |
Controlled Affiliated Portfolio Companies | 0 |
| | 0.0% | | | | |
Asset Management & Custody Banks | | | | | 150,000 |
| | 0.2% |
Unaffiliated Portfolio Companies | 150,000 |
| | 0.2% | | | | |
Non-Controlled Affiliated Portfolio Companies | 0 |
| | 0.0% | | | | |
Controlled Affiliated Portfolio Companies | 0 |
| | 0.0% | | | | |
Biotechnology | | | | | 3,248,962 |
| | 4.0% |
Unaffiliated Portfolio Companies | 3,248,962 |
| | 4.0% | | | | |
Non-Controlled Affiliated Portfolio Companies | 0 |
| | 0.0% | | | | |
Controlled Affiliated Portfolio Companies | 0 |
| | 0.0% | | | | |
Communications Equipment | | | | | 3,548,278 |
| | 4.3% |
Unaffiliated Portfolio Companies | 3,548,278 |
| | 4.3% | | | | |
Non-Controlled Affiliated Portfolio Companies | 0 |
| | 0.0% | | | | |
Controlled Affiliated Portfolio Companies | 0 |
| | 0.0% | | | | |
Electronic Components | | | | | 1,870,849 |
| | 2.3% |
Unaffiliated Portfolio Companies | 1,870,849 |
| | 2.3% | | | | |
Non-Controlled Affiliated Portfolio Companies | 0 |
| | 0.0% | | | | |
Controlled Affiliated Portfolio Companies | 0 |
| | 0.0% | | | | |
Fertilizers & Agricultural Chemicals | | | | | 13,607,821 |
| | 16.6% |
Unaffiliated Portfolio Companies | 0 |
| | 0.0% | | | | |
Non-Controlled Affiliated Portfolio Companies | 13,607,821 |
| | 16.6% | | | | |
Controlled Affiliated Portfolio Companies | 0 |
| | 0.0% | | | | |
Financial Exchanges & Data | | | | | 9,546,324 |
| | 11.6% |
Unaffiliated Portfolio Companies | 0 |
| | 0.0% | | | | |
Non-Controlled Affiliated Portfolio Companies | 9,546,324 |
| | 11.6% | | | | |
Controlled Affiliated Portfolio Companies | 0 |
| | 0.0% | | | | |
Health Care Equipment | | | | | 2,130,371 |
| | 2.6% |
Unaffiliated Portfolio Companies | 0 |
| | 0.0% | | | | |
Non-Controlled Affiliated Portfolio Companies | 2,130,371 |
| | 2.6% | | | | |
Controlled Affiliated Portfolio Companies | 0 |
| | 0.0% | | | | |
Health Care Technology | | | | | 10,721,538 |
| | 13.1% |
Unaffiliated Portfolio Companies | 112,500 |
| | 0.1% | | | | |
Non-Controlled Affiliated Portfolio Companies | 5,813,811 |
| | 7.1% | | | | |
Controlled Affiliated Portfolio Companies | 4,795,227 |
| | 5.9% | | | | |
| | | | | | | |
|
| | | | | | | | | | | |
Industry | Value as of December 31, 2018 | | % of Net Assets | | Value as of December 31, 2018 | | % of Net Assets |
Life Sciences Tools & Services | | | | | $ | 3,731,555 |
| | 4.6% |
Unaffiliated Portfolio Companies | $ | 230,000 |
| | 0.3% | | | | |
Non-Controlled Affiliated Portfolio Companies | 3,501,555 |
| | 4.3% | | | | |
Controlled Affiliated Portfolio Companies | 0 |
| | 0.0% | | | | |
Oil & Gas Equipment & Services | | | | | 76,863 |
| | 0.1% |
Unaffiliated Portfolio Companies | 0 |
| | 0.0% | | | | |
Non-Controlled Affiliated Portfolio Companies | 76,863 |
| | 0.1% | | | | |
Controlled Affiliated Portfolio Companies | 0 |
| | 0.0% | | | | |
Pharmaceuticals | | | | | 3,065,919 |
| | 3.8% |
Unaffiliated Portfolio Companies | 2,264,676 |
| | 2.8% | | | | |
Non-Controlled Affiliated Portfolio Companies | 801,243 |
| | 1.0% | | | | |
Controlled Affiliated Portfolio Companies | 0 |
| | 0.0% | | | | |
Research & Consulting Services | | | | | 722,064 |
| | 0.9% |
Unaffiliated Portfolio Companies | 432,756 |
| | 0.5% | | | | |
Non-Controlled Affiliated Portfolio Companies | 289,308 |
| | 0.4% | | | | |
Controlled Affiliated Portfolio Companies | 0 |
| | 0.0% | | | | |
Semiconductors | | | | | 6,815,403 |
| | 8.3% |
Unaffiliated Portfolio Companies | 6,339,216 |
| | 7.7% | | | | |
Non-Controlled Affiliated Portfolio Companies | 0 |
| | 0.0% | | | | |
Controlled Affiliated Portfolio Companies | 476,187 |
| | 0.6% | | | | |
Specialty Chemicals | | | | | 3,956,817 |
| | 4.8% |
Unaffiliated Portfolio Companies | 3,502,257 |
| | 4.3% | | | | |
Non-Controlled Affiliated Portfolio Companies | 454,560 |
| | 0.5% | | | | |
Controlled Affiliated Portfolio Companies | 0 |
| | 0.0% | | | | |
Technology Hardware, Storage & Peripherals | | | | | 9,447,107 |
| | 11.5% |
Unaffiliated Portfolio Companies | 9,447,107 |
| | 11.5% | | | | |
Non-Controlled Affiliated Portfolio Companies | 0 |
| | 0.0% | | | | |
Controlled Affiliated Portfolio Companies | 0 |
| | 0.0% | | | | |
Total | $ | 75,045,478 |
| | | | $ | 75,045,478 |
| | |
NOTE 6. DERIVATIVES
At December 31, 2018, we had rights to milestone payments from Amgen, Inc.’s acquisition of our former portfolio company, BioVex Group, Inc. These rights to milestone payments were fair valued at $2,019,283 as of December 31, 2018. At December 31, 2018, we had rights to payments from Xenio Holdings, Inc.'s merger with Xenio Systems, Inc. These rights to payments were fair valued at $0 as of December 31, 2018.
The following tables present the value of derivatives held at December 31, 2018, and the effect of derivatives held during the year ended December 31, 2018, along with the respective location in the financial statements.
Consolidated Statement of Assets and Liabilities:
|
| | | | | | | | | | |
| | Assets | | Liabilities |
Derivatives Instruments - Unaffiliated Rights to Payments | | Location | | Fair Value | | Location | | Fair Value |
| | | | | | | | |
Amgen, Inc. Rights to Milestones Payments from Acquisition of BioVex Group, Inc. | | Investments | | $ | 2,019,283 |
| | -- | | -- |
| | | | | | | | |
Xenio Holdings, Inc. Rights to Potential Payments from Merger with Xenio Systems, Inc. | | Investments | | $ | 0 |
| | -- | | -- |
| | | | | | | | |
Total | | | | $ | 2,019,283 |
| | | | |
Consolidated Statement of Operations:
|
| | | | | | | | | | |
Derivatives Instruments - Unaffiliated Rights to Payments | | Location | | Net Realized
Gain/Loss | | Net Change in Unrealized
Depreciation |
| | | | | | |
Amgen, Inc. Rights to Milestones Payments from Acquisition of BioVex Group, Inc. | | Net Realized Gain (Loss) from Investments and Net Change in Unrealized Appreciation (Depreciation) on Investments | | $ | 0 |
| | $ | (192,584 | ) |
| | | | | | |
Xenio Holdings, Inc. Rights to Potential Payments from Merger with Xenio Systems, Inc. | | Net Realized Gain (Loss) from Investments and Net Change in Unrealized Appreciation (Depreciation) on Investments | | $ | 0 |
| | $ | 0 |
|
| | | | | | |
Total | | | | $ | 0 |
| | $ | (192,584 | ) |
NOTE 7. OFFICERS' AND BOARD OF DIRECTORS' COMPENSATION
The aggregate compensation paid by the Company during the year ended December 31, 2018, to its officers amounted to $1,513,361. In addition, the Compensation Committee awarded a deferred bonus as of December 31, 2017, to certain of the Company's officers of $346,500 payable only upon achievement of certain metrics defined by the Compensation Committee over the next two years, starting December 31, 2017. The Compensation Committee determined the metrics for the payment of $173,250 of this deferred compensation from 2017 were met as of December 31, 2018. An additional $116,078 related to the remaining portion of the deferred bonus was included in the Company's Consolidated Statement of Assets and Liabilities as of December 31, 2018. This amount represents the additional time-elapsed portion of the deferred bonus accrued on a straight-line basis during the year ended December 31, 2018, based on the metric measurement date.
The aggregate compensation paid by the Company to the independent members of its Board of Directors during the year ended December 31, 2018 was $277,500.
Certain officers and directors currently and may in the future serve as members of the board of directors of our portfolio companies, including our controlled portfolio companies. These officers and directors do not receive any compensation for serving in such roles directly from the portfolio companies. Any such cash compensation paid by portfolio companies to members of their respective boards of directors is paid directly to the Company. In the case of securities-based compensation (restricted stock or stock options), the officer or director due such compensation assigns all beneficial interest, including but not limited to economic benefit and voting control, to such securities over to the Company.
NOTE 8. EMPLOYEE BENEFITS
401(k) Plan
We adopted a 401(k) Plan covering substantially all of our employees. Matching contributions to the plan are at the discretion of the Compensation Committee. For the year ended December 31, 2018, the Compensation Committee approved a 100 percent match, which amounted to approximately $86,000.
Medical Benefit Retirement Plan
We historically administered a plan to provide medical and dental insurance for retirees and their spouses who, at the time of their retirement, attained certain years of service with us and a certain age (the "Medical Benefit Retirement Plan"). On April 27, 2017, the Board of Directors terminated the plan. The termination does not affect benefits accrued by former employees who are grandfathered under the former terms of the plan, and the termination of the plan does not affect benefits accrued by certain former employees who were grandfathered under the amended terms of the plan. The Medical Benefit Retirement Plan was terminated for all other employees.
The plan is unfunded and has no assets. The following disclosures about changes in the benefit obligation under our plan to provide medical and dental insurance for retirees are as of the measurement date of December 31, 2018:
|
| | | |
| 2018 |
| |
Accumulated post-retirement benefit obligation - January 1, 2018 | $ | 1,144,829 |
|
Interest cost | 36,312 |
|
Actuarial gains | (170,066 | ) |
Benefits paid | (48,060 | ) |
Accumulated post-retirement benefit obligation - December 31, 2018 | $ | 963,015 |
|
In accounting for the plan, the assumption made for the discount rate was 3.98 percent for the year ended December 31, 2018. The discount rate was calculated using the December 31, 2018 FTSE Pension Liability Index. The assumed health care cost trend rates is assumed to be 7.25 percent in 2019 grading down to 6.75 percent uniformly over 3 years and then following the Getzen model thereafter for medical and 5 percent per year for dental.
The effect on the medical plan disclosure information of a one percentage point change in the assumed health care cost trend rate for each future year is shown below.
|
| | | | | | | | | | | |
| 1% Decrease in Rates | | Assumed Rates | | 1% Increase in Rates |
| | | | | |
Aggregated service and interest cost | $ | 33,106 |
| | $ | 36,312 |
| | $ | 40,143 |
|
Accumulated post-retirement benefit obligation | $ | 887,617 |
| | $ | 963,015 |
| | $ | 1,052,077 |
|
The net periodic post-retirement benefit cost for the year is determined as the sum of service cost for the year, interest on the accumulated post-retirement benefit obligation, and amortization of the transition obligation (asset) less previously accrued expenses over the average remaining service period of employees expected to receive plan benefits.
The following is the net periodic post-retirement benefit cost for the years ended December 31, 2018:
|
| | | |
| 2018 |
| |
Interest cost on accumulated post-retirement benefit obligation | $ | 36,312 |
|
Amortization of net losses | 13,231 |
|
Net periodic post retirement benefit cost | $ | 49,543 |
|
The Company estimates the following benefits to be paid in each of the following years:
|
| | | |
2019 | $ | 55,419 |
|
2020 | $ | 77,662 |
|
2021 | $ | 79,318 |
|
2022 | $ | 80,537 |
|
2023 | $ | 81,621 |
|
2024 through 2028 | $ | 344,848 |
|
For the year ended December 31, 2018, net unrecognized actuarial gains, which resulted primarily from the increase in the discount rate, increased by $183,297, which represents $170,066 of actuarial gains arising during the year, and by a reclassification adjustment of $13,231 that increased the net periodic benefit cost for the year.
Executive Mandatory Retirement Benefit Plan
On May 5, 2011, the Board of Directors terminated the Amended and Restated Executive Mandatory Retirement Benefit Plan. Our former President accrued benefits under this plan prior to his retirement, and the termination of this plan has no impact on his accrued benefits. At December 31, 2018, we had $177,391 accrued for benefits for this former employee under the plan, which is included in "Post-retirement plan liabilities" on the Company's Consolidated Statement of Assets and Liabilities.
NOTE 9. INCOME TAXES
We filed for the 1999 tax year to elect treatment as a RIC under Subchapter M of the Code and qualified for the same treatment for the years 2000 through 2015 and in 2017. We did not qualify as a RIC under Subchapter M of the Code in 2018 owing to the failure of the 50 percent Diversification Test as of the end of the first quarter of 2018. We will therefore be taxed as a C Corporation for 2018. We did not have any taxable income in 2018, so this failure to qualify as a RIC did not result in a tax liability. As a C Corporation, we are permitted to use historical operating loss carryforwards to offset income and gains for tax purposes. As of December 31, 2018, we had approximately $71 million in operating loss carryforwards that begin to expire in 2026. Pre-enactment loss carryforwards totaling $3.9 million expired unused in 2018.
We note that our ownership of D-Wave Systems, Inc. is currently held through Parallel Universes, Inc., which holds shares of D-Wave Systems, Inc. through a Canadian limited company, 4169841 Canada Ltd. ("CanCo"). We have rights to seek a reorganization of D-Wave Systems, Inc. upon certain events including a sale and/or an initial public offering of the company that we currently believe will enable us to use our accumulated operating and capital loss carryforwards to offset any gains from that investment. Should we decide to sell our shares of D-Wave Systems, Inc., ahead of such reorganization or if we are not able to complete such reorganization due to changes in tax laws or other factors, our returns on investment may be decreased due to taxation at the Parallel Universes, Inc. and/or CanCo entity levels. We do not currently plan to sell our shares prior to an event that would trigger our reorganization rights.
The Company's status as a RIC is irrevocable, but qualification is measured annually. Given the Company's status as a RIC and the ability or inability to use such operating loss carryforwards depends on qualification metrics measured in each taxable year separate from prior years, it does not include a deferred tax asset and valuation allowance on its Consolidated Statement of Assets and Liabilities.
For federal tax purposes, the Company’s 2015 through 2017 tax years remain open for examination by the tax authorities under the normal three-year statute of limitations. Generally, for state tax purposes, the Company’s 2014 through 2017 tax years remain open for examination by the tax authorities under a four-year statute of limitations.
For the year ended December 31, 2018, the Company recorded a consolidated expense of $6,003 in federal, state and local income taxes.
We pay federal, state and local taxes on behalf of Ventures, which is taxed as a C Corporation. For the year ended December 31, 2018, our income tax benefit for Ventures was $1,664.
For the year ended December 31, 2018, the Company recorded aggregate unrealized appreciation of $23,390,333, aggregate unrealized depreciation of $30,910,044 and net unrealized depreciation is $7,519,711. The aggregate book cost of investments is $82,565,189. For the year ended December 31, 2018, the Company recorded aggregate tax unrealized appreciation of $23,276,021, aggregate tax unrealized depreciation of $30,561,342 and net tax unrealized depreciation is $7,285,321. The aggregate tax cost of investments is $82,330,799.
As of December 31, 2018, we had post-enactment loss carryforwards under the provisions of the the Regulated Investment Company Modernization Act of 2010 (the "Act") of $21,205,166 long term. Post-enactment losses have no expiration date. Capital losses in the current year of $7,693,522 may be carried back 3 years or carried forward 5 years. As of December 31, 2017, we had pre-enactment loss carryforwards totaling $3,875,967, which expired unused in 2018.
On December 22, 2017, the Tax Cuts and Jobs Act of 2017 (the "2017 Act") was enacted, which among other changes, lowered the tax rates for corporations and how future loss carryforwards can be used against future gains. The change of corporate tax rate from 35 percent to 21 percent in the 2017 Act may impact future decisions regarding the issuance of deemed dividends should the Company be in a net taxable gain position on investments.
NOTE 10. COMMITMENTS AND CONTINGENCIES
On July 21, 2014, the Company invested in Accelerator IV-New York Corporation ("Accelerator"), a company that will identify emerging biotechnology companies for the Company to invest in directly. The investment consists of an operating capital commitment and an investment commitment to be invested in the identified portfolio companies over a five-year period. During the third quarter of 2016, the board of directors of Accelerator voted to modify the operating commitment and investment commitment distributions, which resulted in the Company's operating commitment to be set at $833,333 and investment commitment to be set at $3,166,667. During the year ended December 31, 2018, Accelerator called $113,906 in operating capital and $1,008,402 in investment capital, to fund two new tenant companies, Coba Therapeutics Corporation and Magnolia Neurosciences Corporation. As of December 31, 2018, the Company had remaining unfunded commitments of $0 and $475,025, or approximately 0.0 percent and 15.0 percent, of the total operating and investment commitments, respectively. The withdrawal of contributed capital is not permitted. The transfer or assignment of capital is subject to approval by Accelerator.
If the Company defaults on the remaining investment commitment, the other investors may purchase the Company's shares of Accelerator and any tenant companies of the Accelerator, currently Coba Therapeutics Corporation, Lodo Therapeutics Corporation, Magnolia Neurosciences Corporation and Petra Pharma Corporation, for $0.001 per share. The combined value of Accelerator, Coba Therapeutics Corporation, Lodo Therapeutics Corporation, Magnolia Neurosciences Corporation, and Petra Pharma Corporation is $3,312,148, or $0.11 per share as of December 31, 2018.
The Company's initial investment in Petra Pharma Corporation was in a round of financing that included investment of additional capital of up to of $260,504 upon achievement of certain quantitative and qualitative milestones. The milestones that would trigger this potential investment had yet to occur as of December 31, 2018. Should these milestones be successfully achieved and the Company decides to not invest such capital, the securities held by the Company in Petra Pharma Corporation may be subject to punitive action including, but not limited to, conversion from preferred stock to common stock and/or repurchase by the respective companies at a substantial discount to current carrying value. Additionally, portfolio companies may seek additional capital in the future and any decision by the Company to not participate in the round of financing could result in similar outcomes that could negatively impact the value of the Company's securities of those portfolio companies.
On September 24, 2009, we signed a ten-year lease for approximately 6,900 square feet of office space located at 1450 Broadway, New York, New York. On March 23, 2017, we signed a month-to-month lease for approximately 1,250 square feet of office space located at 7 N. Willow Street, Suite 4B, Montclair, New Jersey. See Note 2. Summary of Significant Accounting Policies for details of these leases. Upon an event of default, the leases each provide that the landlord may terminate the lease and require us to pay all rent that would have been payable during the remainder of the lease or until the date the landlord re-enters the premises.
NOTE 11. PORTFOLIO PURCHASES AND SALES
During the year ended December 31, 2018: |
| | | | | | | |
Company | Purchases/Cost | | Sales Proceeds |
Synacor, Inc. | $ | 665,750 |
| | $ | 0 |
|
ORIG3N, Inc. | 49,804 |
| | 0 |
|
Petra Pharma Corporation | 739,496 |
| | 0 |
|
Coba Therapeutics Corporation | 145,530 |
| | 0 |
|
Mersana Therapeutics, Inc. | 784,666 |
| | 1,612,575 |
|
Turtle Beach Corporation | 1,000,000 |
| | 4,893,675 |
|
Adesto Technologies Corporation | 2,773,712 |
| | 8,403,897 |
|
Senova Systems, Inc. | 0 |
| | 0 |
|
SynGlyco, Inc. | 0 |
| | 50,000 |
|
Muses Labs, Inc. | 0 |
| | 132,000 |
|
Accelerator IV-New York Corporation | 113,906 |
| | 0 |
|
Emcore Corporation | 2,688,299 |
| | 352,528 |
|
Airgain, Inc. | 1,627,116 |
| | 18,142 |
|
Intermolecular, Inc. | 1,328,661 |
| | 0 |
|
Lantronix, Inc. | 1,475,580 |
| | 0 |
|
PDL BioPharma, Inc. | 1,183,826 |
| | 1,493,632 |
|
Essential Health Solutions, Inc. | 50,000 |
| | 0 |
|
HALE.life Corporation | 500,000 |
| | 0 |
|
Magnolia Neurosciences Corporation | 862,872 |
| | 0 |
|
Ensemble Therapeutics Corporation | 0 |
| | 117,327 |
|
HZO, Inc. | 0 |
| | 7,000,000 |
|
Champions Oncology, Inc. | 0 |
| | 41,000 |
|
Miscellaneous Common Stocks | 73,825 |
| | 24,140 |
|
Totals | $ | 16,063,043 |
| | $ | 24,138,916 |
|
Note: The table above does not include purchases of short-term U.S. Treasury securities whose maturities at the time of acquisition were one year or less during the year ended December 31, 2018. The Company did not sell any such securities during the year ended December 31, 2018.
During the year ended December 31, 2018, the Company received $18,507 in additional sales proceeds on an investment that was realized in 2017.
NOTE 12. SHARE REPURCHASE PROGRAM
On February 21, 2018, our Board reauthorized the repurchase of up to $2.5 million of the Company's common stock within a six-month period from the date of notice to investors, which notice was mailed on or about February 27, 2018. On July 31, 2018, our Board reauthorized the repurchase of up to $2.5 million of the Company's common stock within a six-month period from the date of notice to investors, which notice was mailed on August 10, 2018. As of December 31, 2018, no repurchases had occurred.
On February 20, 2019, our Board reauthorized the repurchase of up to $2.5 million of the Company's common stock within a six-month period from the date of notice to investors, which notice is expected to be mailed on or about February 28, 2019.
NOTE 13. RELATED PARTY TRANSACTIONS
We have historically provided managerial assistance to some of our portfolio companies, including serving as members of the board of directors. In certain cases, we receive fees for providing such assistance. During the year ended December 31, 2018, we received fees totaling $75,000 in cash and $57,940 in non-cash, included in the Company's Consolidated Statement of Operations in "Fee income for providing managerial assistance to portfolio companies."
NOTE 14. UNCONSOLIDATED SIGNIFICANT SUBSIDIARIES
The following unconsolidated portfolio company is considered a significant subsidiary under SEC Regulation S-X Rule 10-01(b)(1) and Regulation S-X Rule 4-08(g) as of December 31, 2018. Accordingly, summarized financial information is presented for this unconsolidated significant subsidiary.
HALE.life Corporation
The following table shows unaudited summarized financial information for HALE.life Corporation:
|
| | | | |
| | December 31, 2018 |
|
Consolidated Balance Sheet | | |
Current assets | | $ | 574,550 |
|
Noncurrent assets | | 89,467 |
|
Current liabilities | | 140,651 |
|
| | |
Consolidated Statement of Operations | | |
Net sales | | $ | 24,500 |
|
Net operating loss | | (1,369,237 | ) |
Earnings before taxes | | (1,369,237 | ) |
Net loss | | (1,369,237 | ) |
| | |
NOTE 15. SUBSEQUENT EVENTS
The Company has evaluated subsequent events as of December 31, 2018, through the date these financial statements were issued, and include the following:
On January 31, 2019, the Company completed the sale of our bridge note of Genome Profiling, LLC to an undisclosed buyer for $230,000, plus accrued interest.
On February 12, 2019, the shareholders of TheStreet, Inc. ("TST"), approved the sale of TST's business-to-business segment to Euromoney Institutional Investor, PLC for $87.3 million (the "Sale"). With this approval, TST communicated in the proxy materials that it expects that a substantial portion of the net proceeds from the Sale, along with a portion of its current cash on hand, will be distributed to TheStreet’s stockholders. TST estimated that its cash on hand following the closing of the Sale and payment of certain Sale-related costs and expenses will be approximately $115-120 million in the aggregate. Should the amount be in excess of the invested capital and accrued management fees and expenses of TST SPV, the Company would receive carried interest from such distribution. The size and timing of any distribution remain uncertain as of the date of these financial statements.
NOTE 16. INVESTMENTS IN AND ADVANCES TO AFFILIATES - SCHEDULE 12-14
|
| | | | | | | | | | | | | | | | | | | | | | | | | | | | | | |
Name of Issuer | | Title of Issue or Nature of Indebtedness (A) | | Amount of Dividends or Interest Credited to Income (B) | | Net Realized Gain (Loss) | | Value as of December 31, 2017 | | Gross Additions (C) | | Gross Reductions (D) | | Net Change in Unrealized Appreciation (Depreciation) | | Value as of December 31, 2018 |
CONTROLLED AFFILIATED PRIVATELY HELD COMPANIES(E): | | | | | | | | | | | | | | | | |
Black Silicon Holdings, Inc. | | Series A Convertible Preferred Stock | | $ | 0 |
| | $ | 0 |
| | $ | 0 |
| | $ | 0 |
| | $ | 0 |
| | $ | 0 |
| | $ | 0 |
|
| | Series A-1 Convertible Preferred Stock | | 0 |
| | 0 |
| | 0 |
| | 0 |
| | 0 |
| | 0 |
| | 0 |
|
| | Series A-2 Convertible Preferred Stock | | 0 |
| | 0 |
| | 0 |
| | 0 |
| | 0 |
| | 0 |
| | 0 |
|
| | Series B-1 Convertible Preferred Stock | | 0 |
| | 0 |
| | 0 |
| | 0 |
| | 0 |
| | 0 |
| | 0 |
|
| | Series C Convertible Preferred Stock | | 0 |
| | 0 |
| | 0 |
| | 0 |
| | 0 |
| | 0 |
| | 0 |
|
| | Secured Convertible Bridge Notes(G) | | 25,569 |
| | 0 |
| | 288,759 |
| | 187,428 |
| | 0 |
| | 161,859 |
| | 476,187 |
|
HALE.life Corporation | | Common Stock | | $ | 0 |
| | $ | 0 |
| | $ | 10 |
| | $ | 146,452 |
| | $ | 0 |
| | $ | 146,452 |
| | $ | 146,462 |
|
| | Series Seed-1 Convertible Preferred Stock | | 0 |
| | 0 |
| | 1,896,920 |
| | 250,974 |
| | 0 |
| | 250,974 |
| | 2,147,894 |
|
| | Convertible Bridge Notes | | 0 |
| | 0 |
| | 2,000,000 |
| | 0 |
| | (2,000,000 | ) | | 0 |
| | 0 |
|
| | Series Seed-2 Convertible Preferred Stock | | 0 |
| | 0 |
| | 0 |
| | 2,500,871 |
| | 0 |
| | 871 |
| | 2,500,871 |
|
SynGlyco, Inc. | | Common Stock | | $ | 0 |
| | $ | (2,729,817 | ) | | $ | 0 |
| | $ | 0 |
| | $ | 0 |
| | $ | 2,729,817 |
| | $ | 0 |
|
| | Series A' Convertible Preferred Stock | | 0 |
| | (4,855,627 | ) | | 0 |
| | 0 |
| | 0 |
| | 4,855,627 |
| | 0 |
|
| | Senior Convertible Bridge Notes | | 0 |
| | (27,857 | ) | | 30,000 |
| | 0 |
| | (30,000 | ) | | 47,857 |
| | 0 |
|
Total Controlled Affiliated Privately Held Companies | | | | $ | 25,569 |
| | $ | (7,613,301 | ) | | $ | 4,215,689 |
| | $ | 3,085,725 |
| | $ | (2,030,000 | ) | | $ | 8,193,457 |
| | $ | 5,271,414 |
|
Total Controlled Affiliated Companies | | | | $ | 25,569 |
| | $ | (7,613,301 | ) | | $ | 4,215,689 |
| | $ | 3,085,725 |
| | $ | (2,030,000 | ) | | $ | 8,193,457 |
| | $ | 5,271,414 |
|
| | | | | | | | | | | | | | | | |
NON-CONTROLLED AFFILIATED PRIVATELY HELD COMPANIES(F): | | | | | | | | | | | | | | | | |
ABSMaterials, Inc. | | Series A Convertible Preferred Stock | | $ | 0 |
| | $ | 0 |
| | $ | 64,160 |
| | $ | 0 |
| | $ | (48,296 | ) | | $ | (48,296 | ) | | $ | 15,864 |
|
| | Series B Convertible Preferred Stock | | 0 |
| | 0 |
| | 527,055 |
| | 0 |
| | (240,493 | ) | | (240,493 | ) | | 286,562 |
|
| | Secured Convertible Bridge Note | | 10,000 |
| | 0 |
| | 142,134 |
| | 10,000 |
| | 0 |
| | 0 |
| | 152,134 |
|
| | | | | | | | | | | | | | | | |
|
| | | | | | | | | | | | | | | | | | | | | | | | | | | | | | |
Name of Issuer | | Title of Issue or Nature of Indebtedness (A) | | Amount of Dividends or Interest Credited to Income (B) | | Net Realized Gain (Loss) | | Value as of December 31, 2017 | | Gross Additions (C) | | Gross Reductions (D) | | Net Change in Unrealized Appreciation (Depreciation) | | Value as of December 31, 2018 |
NON-CONTROLLED AFFILIATED PRIVATELY HELD COMPANIES(F): | | | | | | | | | | | | | | | | |
AgBiome, LLC | | Series A-1 Convertible Preferred Stock | | $ | 0 |
| | $ | 0 |
| | $ | 8,583,935 |
| | $ | 1,858,749 |
| | $ | 0 |
| | $ | 1,858,749 |
| | $ | 10,442,684 |
|
| | Series A-2 Convertible Preferred Stock | | 0 |
| | 0 |
| | 1,838,865 |
| | 375,193 |
| | 0 |
| | 375,193 |
| | 2,214,058 |
|
| | Series B Convertible Preferred Stock | | 0 |
| | 0 |
| | 884,777 |
| | 66,302 |
| | 0 |
| | 66,302 |
| | 951,079 |
|
Coba Therapeutics Corporation | | Convertible Bridge Note | | $ | 6,076 |
| | $ | 0 |
| | $ | 0 |
| | $ | 21,776 |
| | $ | 0 |
| | $ | (129,830 | ) | | $ | 21,776 |
|
EchoPixel, Inc. | | Series Seed Convertible Preferred Stock | | $ | 0 |
| | $ | 0 |
| | $ | 945,726 |
| | $ | 255,297 |
| | $ | 0 |
| | $ | 255,297 |
| | $ | 1,201,023 |
|
| | Series Seed-2 Convertible Preferred Stock | | 0 |
| | 0 |
| | 337,930 |
| | 91,802 |
| | 0 |
| | 91,802 |
| | 429,732 |
|
| | Series A-2 Convertible Preferred Stock | | 0 |
| | 0 |
| | 412,209 |
| | 87,407 |
| | 0 |
| | 87,407 |
| | 499,616 |
|
Ensemble Therapeutics Corporation | | Series B Convertible Preferred Stock | | $ | 0 |
| | $ | (2,000,000 | ) | | $ | 0 |
| | $ | 0 |
| | $ | 0 |
| | $ | 2,000,000 |
| | $ | 0 |
|
| | Series B-1 Convertible Preferred Stock | | 0 |
| | (456,752 | ) | | 173,143 |
| | 0 |
| | (173,143 | ) | | 400,936 |
| | 0 |
|
Essential Health Solutions, Inc. | | Common Stock | | $ | 0 |
| | $ | 0 |
| | $ | 145,218 |
| | $ | 0 |
| | $ | (16,879 | ) | | $ | (16,879 | ) | | $ | 128,339 |
|
| | Series A Convertible Preferred Stock | | 0 |
| | 0 |
| | 3,169,662 |
| | 0 |
| | (388,362 | ) | | (388,362 | ) | | 2,781,300 |
|
| | Unsecured Convertible Bridge Note | | 142 |
| | 0 |
| | 0 |
| | 50,142 |
| | 0 |
| | 0 |
| | 50,142 |
|
HZO, Inc. | | Common Stock | | $ | 0 |
| | $ | (155,665 | ) | | $ | 473,896 |
| | $ | 0 |
| | $ | (473,896 | ) | | $ | 192,771 |
| | $ | 0 |
|
| | Series I Convertible Preferred Stock | | 0 |
| | (1,333,236 | ) | | 4,074,569 |
| | 0 |
| | (4,074,569 | ) | | 1,635,266 |
| | 0 |
|
| | Series II Convertible Preferred Stock | | 0 |
| | (583,747 | ) | | 1,571,541 |
| | 0 |
| | (1,571,541 | ) | | 928,465 |
| | 0 |
|
| | Series II-A Convertible Preferred Stock | | 0 |
| | (52,787 | ) | | 188,810 |
| | 0 |
| | (188,810 | ) | | 37,260 |
| | 0 |
|
| | Warrants for Series II-A Convertible Preferred Stock | | 0 |
| | (6,963 | ) | | 17,925 |
| | 0 |
| | (17,925 | ) | | 11,895 |
| | 0 |
|
Lodo Therapeutics Corporation | | Series A Convertible Preferred Stock | | $ | 0 |
| | $ | 0 |
| | $ | 777,896 |
| | $ | 1,571 |
| | $ | 0 |
| | $ | 1,571 |
| | $ | 779,467 |
|
NGX Bio, Inc. | | Series Seed Convertible Preferred Stock | | $ | 0 |
| | $ | 0 |
| | $ | 721,539 |
| | $ | 0 |
| | $ | (704,266 | ) | | $ | (704,266 | ) | | $ | 17,273 |
|
| | Series Seed 2 Convertible Preferred Stock | | 0 |
| | 0 |
| | 477,157 |
| | 0 |
| | (468,607 | ) | | (468,607 | ) | | 8,550 |
|
| | Series Seed 3 Convertible Preferred Stock | | 0 |
| | 0 |
| | 769,258 |
| | 0 |
| | (752,002 | ) | | (752,002 | ) | | 17,256 |
|
| | | | | | | | | | | | | | | | |
|
| | | | | | | | | | | | | | | | | | | | | | | | | | | | | | |
Name of Issuer | | Title of Issue or Nature of Indebtedness (A) | | Amount of Dividends or Interest Credited to Income (B) | | Net Realized Gain (Loss) | | Value as of December 31, 2017 | | Gross Additions (C) | | Gross Reductions (D) | | Net Change in Unrealized Appreciation (Depreciation) | | Value as of December 31, 2018 |
NON-CONTROLLED AFFILIATED PRIVATELY HELD COMPANIES(F): | | | | | | | | | | | | | | | | |
ORIG3N, Inc. | | Series 1 Convertible Preferred Stock | | $ | 0 |
| | $ | 0 |
| | $ | 907,129 |
| | $ | 325,373 |
| | $ | 0 |
| | $ | 325,373 |
| | $ | 1,232,502 |
|
| | Series A Convertible Preferred Stock | | 0 |
| | 0 |
| | 1,305,499 |
| | 126,437 |
| | 0 |
| | 126,437 |
| | 1,431,936 |
|
| | Series A-2 Convertible Preferred Stock | | 0 |
| | 0 |
| | 169,890 |
| | 19,702 |
| | 0 |
| | (30,102 | ) | | 189,592 |
|
Produced Water Absorbents, Inc. | | Warrants for Common Stock | | $ | 0 |
| | $ | 0 |
| | $ | 0 |
| | $ | 0 |
| | $ | 0 |
| | $ | 0 |
| | $ | 0 |
|
| | Common Stock | | 0 |
| | 0 |
| | 0 |
| | 0 |
| | 0 |
| | 0 |
| | 0 |
|
| | Senior Secured Debt (H) | | 133,121 |
| | 0 |
| | 357,407 |
| | 0 |
| | (280,544 | ) | | (463,227 | ) | | 76,863 |
|
Senova Systems, Inc. | | Series B-1 Convertible Preferred Stock | | $ | 0 |
| | $ | (1,083,960 | ) | | $ | 0 |
| | $ | 0 |
| | $ | 0 |
| | $ | 1,083,960 |
| | $ | 0 |
|
| | Series C Convertible Preferred Stock | | 0 |
| | (1,208,287 | ) | | 0 |
| | 0 |
| | 0 |
| | 1,208,287 |
| | 0 |
|
| | Warrants for Series B Preferred Stock | | 0 |
| | (20,000 | ) | | 0 |
| | 0 |
| | 0 |
| | 20,000 |
| | 0 |
|
TARA Biosystems, Inc. | | Common Stock | | $ | 0 |
| | $ | 0 |
| | $ | 651,642 |
| | $ | 7,520 |
| | $ | 0 |
| | $ | 7,520 |
| | $ | 659,162 |
|
| | Series A Convertible Preferred Stock | | 0 |
| | 0 |
| | 2,802,573 |
| | 39,820 |
| | 0 |
| | 39,820 |
| | 2,842,393 |
|
Total Non-Controlled Affiliated Privately Held Companies(I) | | | | $ | 149,339 |
| | $ | (6,901,397 | ) | | $ | 32,491,545 |
| | $ | 3,337,091 |
| | $ | (9,399,333 | ) | | $ | 7,512,247 |
| | $ | 26,429,303 |
|
| | | | | | | | | | | | | | | | |
NON-CONTROLLED AFFILIATED PUBLICLY TRADED SECURITIES(F): | | | | | | | | | | | | | | | | |
Synacor, Inc. | | Common Stock | | $ | 0 |
| | $ | 0 |
| | $ | 2,714,460 |
| | $ | 0 |
| | $ | (353,407 | ) | | $ | (1,019,155 | ) | | $ | 2,361,053 |
|
TheStreet, Inc. | | Common Stock | | $ | 0 |
| | $ | 0 |
| | $ | 6,387,423 |
| | $ | 3,089,738 |
| | $ | 0 |
| | $ | 3,031,798 |
| | $ | 9,477,161 |
|
| | Stock Options | | 0 |
| | 0 |
| | 0 |
| | 4,495 |
| | 0 |
| | 4,495 |
| | 4,495 |
|
| | Restricted Stock Units | | 0 |
| | 0 |
| | 43,476 |
| | 21,192 |
| | 0 |
| | 21,192 |
| | 64,668 |
|
Total Non- Controlled Affiliated Publicly Traded Securities | | | | $ | 0 |
| | $ | 0 |
| | $ | 9,145,359 |
| | $ | 3,115,425 |
| | $ | (353,407 | ) | | $ | 2,038,330 |
| | $ | 11,907,377 |
|
Total Non- Controlled Affiliated Privately Held Companies and Publicly Traded Securities | | | | $ | 149,339 |
| | $ | (6,901,397 | ) | | $ | 41,636,904 |
| | $ | 6,452,516 |
| | $ | (9,752,740 | ) | | $ | 9,550,577 |
| | $ | 38,336,680 |
|
| | | | | | | | | | | | | | | | |
|
| | | | | | | | | | | | | | | | | | | | | | | | | | | | | | |
Name of Issuer | | Title of Issue or Nature of Indebtedness (A) | | Amount of Dividends or Interest Credited to Income (B) | | Net Realized Gain (Loss) | | Value as of December 31, 2017 | | Gross Additions (C) | | Gross Reductions (D) | | Net Change in Unrealized Appreciation (Depreciation) | | Value as of December 31, 2018 |
EQUITY METHOD PRIVATELY HELD COMPANY: | | | | | | | | | | | | | | | | |
Accelerator IV-New York Corporation | | Series A Common Stock | | $ | 0 |
| | $ | 0 |
| | $ | 256,622 |
| | $ | 0 |
| | $ | (10,393 | ) | | $ | 0 |
| | $ | 246,229 |
|
Total Equity Method Privately Held Company | | | | $ | 0 |
| | $ | 0 |
| | $ | 256,622 |
| | $ | 0 |
| | $ | (10,393 | ) | | $ | 0 |
| | $ | 246,229 |
|
| | | | | | | | | | | | | | | | |
| |
(A) | Common stock, warrants, membership units and, in some cases, preferred stock are generally non-income producing and restricted. The principal amount of debt and the number of shares of common and preferred stock and number of membership units are shown in the accompanying Consolidated Schedule of Investments as of December 31, 2018. |
| |
(B) | Represents the total amount of interest or dividends and yield enhancing fees on debt securities credited/(debited) to income for the portion of the year an investment was a control or affiliate investment, as appropriate. Amounts credited to preferred or common stock represent accrued bridge note interest related to conversions that occurred during the year ended December 31, 2018. |
| |
(C) | Gross additions include increases in investments resulting from new portfolio investments, paid-in-kind interest or dividends, the amortization of discounts and fees. Gross additions also include net increases in unrealized appreciation or decreases in unrealized depreciation. |
| |
(D) | Gross reductions include decreases in investments resulting from principal collections related to investment repayments or sales, the amortization of premiums and acquisition costs. Gross reductions also include net increases in unrealized depreciation or decreases in unrealized appreciation. |
| |
(E) | "Controlled Affiliated" is defined as control of 50.1 percent or more of the voting securities outstanding and/or 50.1 percent or more control of the appointment of members of the board of directors. |
| |
(F) | "Non-Controlled Affiliated" is defined as ownership of five percent or more, but less than 25 percent, of the voting shares of the portfolio company, or where we hold the right to appoint one or more members to the portfolio company’s board of directors, but less than 25 percent of the members of the board of directors. |
| |
(G) | Debt security is on non-accrual status as of April 1, 2018 and, therefore, is considered non-income producing as of the year ended December 31, 2018. |
| |
(H) | Debt security is on non-accrual status as of July 1, 2018 and, therefore, is considered non-income producing as of the year ended December 31, 2018. |
| |
(I) | Realized Gain (Loss) on Non-Controlled Affiliated Privately Held Companies excludes a realized gain of $18,507 on an investment that was realized in 2017. |
**Information related to the amount of equity in the net profit and loss for the year for the investments listed has not been included in this schedule. This information is not considered to be meaningful owing to the complex capital structures of the portfolio companies, with different classes of equity securities outstanding with different preferences in liquidation. These investments are not consolidated, nor are they accounted for under the equity method of accounting, with the exception of Accelerator IV-New York Corporation, which are accounted for under the equity method.
|
| | | | | | | | | | | | | | | |
Line for Schedule of Investments | Method / Level | | Primary Industry | | # of Shares Purchased/Principal | | Cost of TURN's Investment | | Valuation |
CONTROLLED AFFILIATED COMPANIES | | | | | | | | | |
PRIVATELY HELD COMPANIES | | | | | | | | | |
Black Silicon Holdings, Inc. | | | Semiconductors | | | | | | |
Series A Convertible Preferred Stock (acquired 8/4/15) | (M) (L3) | | | | 233,499 |
| | $ | 750,000 |
| | $ | 0 |
|
Series A-1 Convertible Preferred Stock (acquired 8/4/15) | (M) (L3) | | | | 2,966,667 |
| | 890,000 |
| | 0 |
|
Series A-2 Convertible Preferred Stock (acquired 8/4/15) | (M) (L3) | | | | 4,207,537 |
| | 2,445,000 |
| | 0 |
|
Series B-1 Convertible Preferred Stock (acquired 8/4/15) | (M) (L3) | | | | 1,892,836 |
| | 1,169,561 |
| | 0 |
|
Series C Convertible Preferred Stock (acquired 8/4/15) | (M) (L3) | | | | 1,674,030 |
| | 1,171,316 |
| | 0 |
|
Secured Convertible Bridge Note, 8% PIK, (acquired 8/25/16, maturing 8/4/21) | (M) (L3) | | | | $ | 1,278,453 |
| | 1,444,368 |
| | 476,187 |
|
| | | | | | | 7,870,245 |
| | 476,187 |
|
HALE.life Corporation | | | Health Care Technology | | | | | | |
Common Stock (acquired 3/1/16) | (I) (L3) | | | | 1,000,000 |
| | $ | 10 |
| | $ | 146,462 |
|
Series Seed-1 Convertible Preferred Stock (acquired 3/28/17) | (I) (L3) | | | | 11,000,000 |
| | 1,896,920 |
| | 2,147,894 |
|
Series Seed-2 Convertible Preferred Stock (acquired 12/28/18) | (I) (L3) | | | | 12,083,132 |
| | 2,500,000 |
| | 2,500,871 |
|
| | | | | | | $ | 4,396,930 |
| | $ | 4,795,227 |
|
Total Controlled Affiliated Privately Held Companies (6.4%) | | | | | | | $ | 12,267,175 |
| | $ | 5,271,414 |
|
| | | | | | | | | |
NON-CONTROLLED AFFILIATED COMPANIES | | | | | | | | | |
PRIVATELY HELD COMPANIES | | | | | | | | | |
ABSMaterials, Inc. | | | Specialty Chemicals | | | | | | |
Series A Convertible Preferred Stock (acquired 2/17/10-10/24/11) | (I) (L3) | | | | 390,000 |
| | $ | 435,000 |
| | $ | 15,864 |
|
Series B Convertible Preferred Stock (acquired 11/8/13-6/25/14) | (I) (L3) | | | | 1,037,751 |
| | 1,217,644 |
| | 286,562 |
|
Secured Convertible Bridge Note, 8% PIK, (acquired 1/20/16, maturing 12/31/19) | (M) (L3) | | | | $ | 100,000 |
| | 123,605 |
| | 123,605 |
|
Secured Convertible Bridge Note, 8% PIK, (acquired 3/28/17, maturing 12/31/19) | (M) (L3) | | | | $ | 25,000 |
| | 28,529 |
| | 28,529 |
|
| | | | | | | $ | 1,804,778 |
| | $ | 454,560 |
|
AgBiome, LLC | | | Fertilizers & Agricultural Chemicals | | | | | | |
Series A-1 Convertible Preferred Units (acquired 1/30/13) | (I) (L3) | | | | 2,000,000 |
| | $ | 2,000,000 |
| | $ | 10,442,684 |
|
Series A-2 Convertible Preferred Units (acquired 4/9/13-10/15/13) | (I) (L3) | | | | 417,392 |
| | 521,740 |
| | 2,214,058 |
|
Series B Convertible Preferred Units (acquired 8/7/15) | (I) (L3) | | | | 160,526 |
| | 500,006 |
| | 951,079 |
|
| | | | | | | $ | 3,021,746 |
| | $ | 13,607,821 |
|
Coba Therapeutics Corporation | | | Pharmaceuticals | | | | | | |
Unsecured Convertible Bridge Note, 6% PIK, (acquired 2/27/18, maturing 2/27/19) | (I) (L3) | | | | $ | 145,530 |
| | $ | 151,606 |
| | $ | 21,776 |
|
| | | | | | | | | |
|
| | | | | | | | | | | | | | | |
Line for Schedule of Investments | Method / Level | | Primary Industry | | # of Shares Purchased/Principal | | Cost of TURN's Investment | | Valuation |
NON-CONTROLLED AFFILIATED COMPANIES | | | | | | | | | |
PRIVATELY HELD COMPANIES | | | | | | | | | |
EchoPixel, Inc. | | | Health Care Equipment | | | | | | |
Series Seed Convertible Preferred Stock (acquired 6/21/13-6/30/14) | (I) (L3) | | | | 4,194,630 |
| | $ | 1,250,000 |
| | $ | 1,201,023 |
|
Series Seed-2 Convertible Preferred Stock (acquired 1/22/16) | (I) (L3) | | | | 1,476,668 |
| | 500,000 |
| | 429,732 |
|
Series A-2 Convertible Preferred Stock (acquired 3/23/17) | (I) (L3) | | | | 1,471,577 |
| | 350,000 |
| | 499,616 |
|
| | | | | | | $ | 2,100,000 |
| | $ | 2,130,371 |
|
Essential Health Solutions, Inc. | | | Health Care Technology | | | | | | |
Common Stock (acquired 11/18/16) | (I) (L3) | | | | 200,000 |
| | $ | 20 |
| | $ | 128,339 |
|
Series A Convertible Preferred Stock (acquired 11/18/16) | (I) (L3) | | | | 2,750,000 |
| | 2,750,000 |
| | 2,781,300 |
|
Unsecured Convertible Bridge Note, 8% PIK, (acquired 12/19/18, maturing 12/19/19) | (M) (L3) | | | | $ | 50,000 |
| | 50,142 |
| | 50,142 |
|
| | | | | | | $ | 2,800,162 |
| | $ | 2,959,781 |
|
Lodo Therapeutics Corporation | | | Pharmaceuticals | | | | | | |
Series A Convertible Preferred Stock (acquired 12/21/15-4/22/16) | (I) (L3) | | | | 658,190 |
| | $ | 658,190 |
| | $ | 779,467 |
|
NGX Bio, Inc. | | | Research & Consulting Services | | | | | | |
Series Seed Convertible Preferred Stock (acquired 6/6/14-1/10/16) | (I) (L3) | | | | 666,667 |
| | $ | 500,002 |
| | $ | 17,273 |
|
Series Seed 2 Convertible Preferred Stock (acquired 8/20/15-9/30/15) | (I) (L3) | | | | 329,989 |
| | 499,999 |
| | 8,550 |
|
Series Seed 3 Convertible Preferred Stock (acquired 6/26/17) | (I) (L3) | | | | 666,001 |
| | 686,329 |
| | 17,256 |
|
| | | | | | | $ | 1,686,330 |
| | $ | 43,079 |
|
ORIG3N, Inc. | | | Health Care Technology | | | | | | |
Series 1 Convertible Preferred Stock (acquired 2/5/15-8/5/15) | (H) (L3) | | | | 1,195,315 |
| | $ | 500,000 |
| | $ | 1,232,502 |
|
Series A Convertible Preferred Stock (acquired 11/25/15-9/7/16) | (H) (L3) | | | | 1,364,666 |
| | 1,500,000 |
| | 1,431,936 |
|
Series A-2 Convertible Preferred Stock (acquired 5/11/17-2/8/18) | (H) (L3) | | | | 176,386 |
| | 200,002 |
| | 189,592 |
|
| | | | | | | $ | 2,200,002 |
| | $ | 2,854,030 |
|
Produced Water Absorbents, Inc. | | | Oil & Gas Equipment & Services | | | | | | |
Common Stock (acquired 4/30/16) | (M) (L3) | | | | 50,243,350 |
| | $ | 7,670,281 |
| | $ | 0 |
|
Warrants for Common Stock expiring upon liquidation event (acquired 4/30/16) | (M) (L3) | | | | 450,000 |
| | 65,250 |
| | 0 |
|
Senior Secured Debt, 15% commencing on 4/1/16, maturing on 12/31/19 (acquired 4/1/16) | (M) (L3) | | | | $ | 2,533,766 |
| | 2,323,680 |
| | 76,863 |
|
| | | | | | | $ | 10,059,211 |
| | $ | 76,863 |
|
| | | | | | | | | |
|
| | | | | | | | | | | | | | | |
Line for Schedule of Investments | Method / Level | | Primary Industry | | # of Shares Purchased/Principal | | Cost of TURN's Investment | | Valuation |
NON-CONTROLLED AFFILIATED COMPANIES | | | | | | | | | |
PRIVATELY HELD COMPANIES | | | | | | | | | |
TARA Biosystems, Inc. | | | Life Sciences Tools & Services | | | | | | |
Common Stock (acquired 8/20/14) | (I) (L3) | | | | 2,000,000 |
| | $ | 20 |
| | $ | 659,162 |
|
Series A Convertible Preferred Stock (acquired 3/31/17) | (I) (L3) | | | | 6,878,572 |
| | 2,545,493 |
| | 2,842,393 |
|
| | | | | | | $ | 2,545,513 |
| | $ | 3,501,555 |
|
Total Non-Controlled Affiliated Privately Held Companies (32.2%) | | | | | | | $ | 27,027,538 |
| | $ | 26,429,303 |
|
| | | | | | | | | |
NON-CONTROLLED AFFILIATED COMPANIES | | | | | | | | | |
PUBLICLY TRADED SECURITIES | | | | | | | | | |
Synacor, Inc. | | | Application Software | | | | | | |
Common Stock (acquired 4/6/17-12/31/18) | (M) (L1) | | | | 1,595,306 |
| | $ | 4,338,396 |
| | $ | 2,361,053 |
|
TheStreet, Inc. | | | Financial Exchanges & Data | | | | | | |
Common Stock (acquired 4/19/17-5/18/18) | (M) (L1) | | | | 4,668,552 |
| | $ | 4,949,734 |
| | $ | 9,477,161 |
|
Stock Options for Common Stock Expiring 1/1/25 (acquired 1/1/18) | (I) (L3) | | | | 3,333 |
| | 0 |
| | 1,995 |
|
Stock Options for Common Stock Expiring 5/18/25 (acquired 5/18/18) | (I) (L3) | | | | 10,000 |
| | 0 |
| | 2,500 |
|
Restricted Stock Units (acquired 5/18/18) | (M) (L3) | | | | 33,333 |
| | 0 |
| | 64,668 |
|
| | | | | | | $ | 4,949,734 |
| | $ | 9,546,324 |
|
Total Non-Controlled Affiliated Publicly Traded Securities (14.5%) | | | | | | | $ | 9,288,130 |
| | $ | 11,907,377 |
|
| | | | | | | | | |
EQUITY METHOD PRIVATELY HELD COMPANY | | | | | | | | | |
Accelerator IV-New York Corporation | | | Research & Consulting Services | | | | | | |
Series A Common Stock (acquired 7/21/14-12/12/18) | (E) | | | | 833,333 |
| | $ | 246,229 |
| | $ | 246,229 |
|
Total Equity Method Privately Held Company (0.3%) |
| | | |
| | $ | 246,229 |
| | $ | 246,229 |
|
Total Investments in Non-Controlled Affiliated Companies, Publicly Traded Securities and Equity Method Privately Held Company (47.0%) |
| | | |
| | $ | 36,561,897 |
| | $ | 38,582,909 |
|
Total Investments in Controlled, Non-Controlled Affiliated Companies, Publicly Traded Securities and Equity Method Privately Held Company (53.5%) | | | | | | | $ | 48,829,072 |
| | $ | 43,854,323 |
|
| | | | | | | | | |
Report of Independent Registered Public Accounting Firm
To the Board of Directors and Shareholders of 180 Degree Capital Corp.
Opinion on the Financial Statements
We have audited the accompanying consolidated statement of assets and liabilities, including the consolidated schedule of investments, of 180 Degree Capital Corp. and its subsidiaries (the "Company") as of December 31, 2018, the related consolidated statements of operations and cash flows for the year ended December 31, 2018, the consolidated statements of changes in net assets for each of the two years in the period ended December 31, 2018, including the related notes, and the financial highlights for each of the five years in the period ended December 31, 2018 (collectively referred to as the "consolidated financial statements"). In our opinion, the consolidated financial statements present fairly, in all material respects, the financial position of the Company as of December 31, 2018, the results of its operations and its cash flows for the year then ended, the changes in its net assets for each of the two years in the period ended December 31, 2018 and the financial highlights for each of the five years in the period ended December 31, 2018 in conformity with accounting principles generally accepted in the United States of America.
Basis for Opinion
These consolidated financial statements are the responsibility of the Company’s management. Our responsibility is to express an opinion on the Company’s consolidated financial statements based on our audits. We are a public accounting firm registered with the Public Company Accounting Oversight Board (United States) ("PCAOB") and are required to be independent with respect to the Company in accordance with the U.S. federal securities laws and the applicable rules and regulations of the Securities and Exchange Commission and the PCAOB.
We conducted our audits of these consolidated financial statements in accordance with the standards of the PCAOB. Those standards require that we plan and perform the audit to obtain reasonable assurance about whether the consolidated financial statements are free of material misstatement, whether due to error or fraud.
Our audits included performing procedures to assess the risks of material misstatement of the consolidated financial statements, whether due to error or fraud, and performing procedures that respond to those risks. Such procedures included examining, on a test basis, evidence regarding the amounts and disclosures in the consolidated financial statements. Our audits also included evaluating the accounting principles used and significant estimates made by management, as well as evaluating the overall presentation of the consolidated financial statements. Our procedures included confirmation of securities owned as of December 31, 2018 by correspondence with the custodian, portfolio companies and broker; when replies were not received from portfolio companies and broker, we performed other auditing procedures. We believe that our audits provide a reasonable basis for our opinion.
/s/ PricewaterhouseCoopers LLP
New York, New York
February 25, 2019
We have served as the Company's auditor since 2002.
Privacy Policy
We are committed to protecting your privacy. This privacy notice explains the privacy policies of 180 Degree Capital Corp. and its affiliates. This notice supersedes any other privacy notice you may have received from 180 Degree Capital Corp.
Generally, we do not receive any non-public personal information relating to our shareholders, although certain non-public personal information of our shareholders may become available to us. We maintain physical, electronic, and procedural safeguards, according to strict standards of security and confidentiality, all information we receive about you. The only information we collect from you is your name, address, and number of shares you hold. This information is used only so that we can send you annual reports and other information about us, and send you proxy statements or other information required by law. When the Company shares non-public shareholder personal information referred to above, the information is made available for limited business purposes and under controlled circumstances designed to protect our shareholders' privacy. We do not permit use of shareholder information for any non-business or marketing purpose, nor do we permit third parties to rent, sell, trade or otherwise release or disclose information to any other party.
We do not share this information with any non-affiliated third party except as described below.
| |
• | 180 Degree Capital Corp. and affiliate employees. It is our policy that only our authorized employees who need to know your personal information will have access to it. Our personnel who violate our privacy policy are subject to disciplinary action. |
| |
• | Service Providers. We may disclose your personal information to companies that provide services on our behalf, such as record keeping and mailing you information. These companies are required to protect your information and use it solely for the purpose for which they received it. |
| |
• | Courts and Government Officials. If required by law, we may disclose your personal information in accordance with a court order or at the request of government regulators. Only that information required by law, subpoena, or court order will be disclosed. |
Proxy Voting
We vote proxies relating to our portfolio securities in the best interest of our shareholders. We review on a case-by-case basis each proposal submitted to a shareholder vote to determine its impact on the portfolio securities held by us. Although we generally vote against proposals that may have a negative impact on our portfolio securities, we may vote for such a proposal if there exists compelling long-term reasons to do so.
Our proxy voting decisions are made by our Portfolio Managers, who are responsible for monitoring each of our investments. To ensure that our vote is not the product of a conflict of interest, we require that: (i) anyone involved in the decision making process disclose to our Chief Compliance Officer any potential conflict that he or she is aware of and any contact that he or she has had with any interested party regarding a proxy vote; and (ii) employees involved in the decision making process or vote administration are prohibited from revealing how we intend to vote on a proposal in order to reduce any attempted influence from interested parties.
Information regarding how the Company voted proxies relating to portfolio securities during the most recent 12-month period ended June 30 is available, without charge, upon request, by calling the Company toll-free at 833-293-1769 and on the SEC's website at http://www.sec.gov.
Portfolio Holdings
The Company files its complete schedule of portfolio holdings with the SEC for the first and third quarters of each fiscal year on Form N-Q. The Company's Forms N-Q are available on the SEC's website at http://www.sec.gov and may be reviewed and copied at the SEC's Public Reference Room in Washington D.C. Information on the operation of the Public Reference Room may be obtained by calling 1-800-SEC-0330.
180 Degree Capital Corp.
Board of Directors
|
| | |
Stacy R. Brandom1,2,4 | Charles E. Ramsey2,3,4 | Richard P. Shanley1,2,3,4,5 |
Parker A. Weil1,2,3 | Kevin M. Rendino6 | Daniel B. Wolfe |
1. Member of Audit Committee 2. Member of Valuation Committee 3. Member of Compensation Committee
4. Member of Nominating Committee 5. Lead Independent Director 6. Chairman of the Board
Officers
|
| |
Kevin M. Rendino | Chairman, Chief Executive Officer and Portfolio Manager |
Daniel B. Wolfe | President, Chief Financial Officer, Chief Compliance Officer and Portfolio Manager |
Alicia M. Gift | Senior Controller, Secretary and Treasurer |
Robert E. Bigelow III | Vice President, Head of Fund Development |
7 N. Willow Street, Suite 4B
Montclair, New Jersey 07042
Phone: 973-746-4500 Fax: 973-746-4508
Website: www.180degreecapital.com Email: ir@180degreecapital.com
Counsel: Schulte Roth & Zabel LLP
Independent Registered Public Accounting Firm: PricewaterhouseCoopers LLP
Custodian of Securities: MUFG Union Bank, N.A.
Transfer Agent & Registrar: American Stock Transfer & Trust Company, LLC
Stockholder Relations Department
6201 15th Avenue
Brooklyn, New York 11219
(877) 260-8188
Website: www.astfinancial.com Email: info@astfinancial.com
HOUSEHOLDING OPT-OUT NOTICE
To reduce expenses, we may only mail one copy of the 180 Degree Capital Corp.'s shareholder updates, such as prospectus, annual report, semi-annual report, to those addresses shared by two or more accounts. If you are a direct shareholder and wish to receive individual copies of these documents, please call us toll-free at 833-293-1769. If you are not a direct shareholder, please contact your financial institution to opt out of householding. We will begin sending you individual copies thirty days after receiving your request.
Item 2. Code of Ethics.
The Board has adopted a code of ethics that applicable to our senior executive officers that is designed to promote honest and ethical conduct, including the ethical handling of actual or apparent conflicts of interest between personal and professional relationships (the "Code of Conduct"). Our Code of Conduct is available on the Company's website at https://ir.180degreecapital.com/governance-docs. The Company did not make any substantive amendments to the Code of Conduct, nor grant any waivers from any provisions of the Code of Conduct during the reporting period.
Item 3. Audit Committee Financial Expert.
The Board has determined that all of the members of the Company's Audit Committee of the Board, Stacy R. Brandom, Richard P. Shanley and Parker A. Weil, meet the definition of "audit committee financial expert" as that term is defined by the SEC and are "independent" pursuant to paragraph (a)(2) of this Item.
Item 4. Principal Accountant Fees and Services.
The information set forth under the captions "Audit Committee's Pre-Approval Policies" and "Fees Paid to PwC for 2018 and 2017" in the Proxy Statement for the 2019 Annual Meeting of Shareholders, to be filed pursuant to Regulation 14A under the Exchange Act (the "2019 Proxy Statement") is herein incorporated by reference.
Item 5. Audit Committee List of Registrants.
The information set forth under the caption "Audit Committee" in our 2019 Proxy Statement is herein incorporated by reference.
Item 6. Investments.
(a) The schedule of investments in securities of unaffiliated issuers is included as part of the report to stockholders filed under Item 1 of this form.
(b) Not applicable.
Item 7. Disclosure of Proxy Voting Policies and Procedures for Closed-End Management Investment Companies.
We vote proxies relating to our portfolio securities in the best interest of our shareholders. We review on a case-by-case basis each proposal submitted to a shareholder vote to determine its impact on the portfolio securities held by us. Although we generally vote against proposals that may have a negative impact on our portfolio securities, we may vote for such a proposal if there exists compelling long-term reasons to do so.
Our proxy voting decisions are made by our Portfolio Managers, who are responsible for monitoring each of our investments. To ensure that our vote is not the product of a conflict of interest, we require that: (i) anyone involved in the decision making process disclose to our Chief Compliance Officer any potential conflict that he or she is aware of and any contact that he or she has had with any interested party regarding a proxy vote; and (ii) employees involved in the decision making process or vote administration are prohibited from revealing how we intend to vote on a proposal in order to reduce any attempted influence from interested parties.
Item 8. Portfolio Managers of Closed-End Management Investment Companies.
(a)(1) As of December 31, 2018, Kevin M. Rendino and Daniel B. Wolfe are primarily responsible for the day-to-day management of the Company's portfolio as Portfolio Managers.
Mr. Rendino has served as Chairman and Chief Executive Officer of the Company since March 2017 and as a member of the Board since June 2016. From 2012 to 2016, Mr. Rendino served as Chairman and Chief Executive Officer of RGJ Capital, where he led a Graham and Dodd approach to value investing. His team focused on a blend of long-only ideas and pair trades when a statistical anomaly and inconsistency between two variables are identified. Since November 2017, Mr. Rendino has served as a director of TheStreet, Inc., a publicly traded company in which we have an investment.
Mr. Wolfe has served as President since January 2009, as Chief Financial Officer and Chief Compliance Officer since July 2016, and as Portfolio Manager and a member of the Company's Board since March 2017. He served as Chief Operating Officer and a Managing Director from January 2008 to June 30, 2016. He served as Chief Financial Officer from January 2008 to December 31, 2012, as Treasurer from May 2008 to December 31, 2012, and from July 2016 to April 2017. He is President and a member of the board of directors of Black Silicon Holdings, Inc., a privately held company in which we have an investment. He is also a member of the board of directors of NGX Bio, Inc. and Produced Water Absorbents, Inc., privately held portfolio companies in which we have investments.
(a)(2) Not applicable.
(a)(3) The principal elements of our executive compensation program for 2018 are base salary, bonus, other benefits and perquisites, and severance benefits. The Compensation Committee of the Board believes that each element is essential to achieve the Company’s objectives as set forth above.
Base Salaries. We recognize the need to pay our named executive officers, and other employees, a competitive annual base salary. We review base salaries for our named executive officers annually, often employing data provided from independent compensation consultants. Base salaries have historically been adjusted annually for inflation and also based on changes in the marketplace and an executive’s individual performance, salary position among peers, career growth potential and/or a change in responsibilities.
Cash Bonuses. The Company provides annual bonuses at the discretion of the Committee derived from a number of quantitative and qualitative inputs including, but not limited to:
| |
• | Performance against individual and corporate targets and goals; |
| |
• | Performance as compared to indices and other observable entities that track or invest in microcapitalization publicly traded companies; |
| |
• | Full year actual versus estimated expenses and expenses as a percentage of assets; |
| |
• | Changes in the price per share of the Company’s stock, including dividends, if any; |
| |
• | Changes in the net asset value of the Company, including dividends, if any; and |
| |
• | The importance of retaining employees. |
The weighting of these inputs in the Committee’s determinations of bonuses are adjusted based on a retrospective full analysis of individual and corporate achievements and challenges during the year under consideration.
Severance Benefits. To further incentivize and retain Messrs. Rendino and Wolfe, we entered into an Executive Severance Agreement with each executive.
Each of Messrs. Rendino and Wolfe's Executive Severance Agreement provides that the executive will receive the following severance benefits in the event that an executive’s employment is terminated by us other than for “cause” or an executive resigns for “good reason.”
| |
• | Twelve months of base salary to be paid in cash periodically in accordance with the Company’s normal payroll policies; |
| |
• | a portion of executive’s incentive compensation in cash for the fiscal year in which executive's employment terminates, pro-rated based on time employed during the fiscal year, only to be paid to the extent that performance metrics in the plan are achieved and at the same time as payments to other executives in the applicable incentive compensation plan are paid; and |
| |
• | Twelve months of COBRA premiums. |
Further, under the terms of each Executive Severance Agreement for Messrs. Rendino and Wolfe, in the event an executive’s employment is terminated other than for “cause” or an executive resigns for “good reason” within the period commencing three months prior to a change in control and ending 12 months after a change in control, the severance will consist of:
| |
• | Twelve months of base salary to be paid in a single cash lump-sum; |
| |
• | a portion of an executive’s incentive compensation in cash for the fiscal year in which executive's employment terminates, pro-rated based on time employed during the fiscal year; |
| |
• | Twelve months of COBRA premiums. |
For purposes of the Executive Severance Agreements, "cause" generally means:
| |
• | an act of dishonesty made in connection with the executive’s responsibilities as an employee; |
| |
• | conviction of, or plea of nolo contendere to, a felony or any crime involving fraud or embezzlement; |
| |
• | unauthorized use or disclosure of any proprietary information or trade secrets; |
| |
• | willful breach of any obligations under any written agreement or covenant with the Company; |
| |
• | failure to cooperate in good faith with a governmental or internal investigation; or |
| |
• | continued failure to perform duties after receiving a written demand of performance. |
For purposes of the Executive Severance Agreements, "good reason" generally means a voluntary termination following the occurrence of one or more of the following, without the executive’s consent that is not cured within 30 days of notice to the Company:
| |
• | a material reduction of responsibilities; |
| |
• | a material reduction in base salary; or; |
| |
• | a material change (at least 50 miles) in the geographic location of Executive’s primary work facility or location. |
(a)(4) As of December 31, 2018, Mr. Rendino and Mr. Wolfe beneficially owned equity securities of the Company valued between $500,001 and $1,000,000 and $100,001 and $500,000, respectively.
Item 9. Purchases of Equity Securities by Closed-End Management Investment Company and Affiliated Purchasers.
|
| | | | | | | | | |
Period 2018 | (a) Total Number of Shares Purchased | (b) Average Price Paid Per Share | (c) Total Number of Shares Purchased as Part of Publicly Announced Plans or Programs | (d) Approximate Dollar Value of Shares that May Yet Be Purchased Under the Plans or Programs |
01/01 - 01/31 | 0 |
| 0 |
| 0 |
| $ | 0 |
|
02/01 - 02/28 | 0 |
| 0 |
| 0 |
| 0 |
|
03/01 - 03/31 | 0 |
| 0 |
| 0 |
| 2,500,000 |
|
04/01 - 04/30 | 0 |
| 0 |
| 0 |
| 2,500,000 |
|
05/01 - 05/31 | 0 |
| 0 |
| 0 |
| 2,500,000 |
|
06/01 - 06/30 | 0 |
| 0 |
| 0 |
| 2,500,000 |
|
07/01 - 07/31 | 0 |
| 0 |
| 0 |
| 2,500,000 |
|
08/01 - 08/31 | 0 |
| 0 |
| 0 |
| 2,500,000 |
|
09/01 - 09/30 | 0 |
| 0 |
| 0 |
| 2,500,000 |
|
10/01 - 10/31 | 0 |
| 0 |
| 0 |
| 2,500,000 |
|
11/01 - 11/30 | 0 |
| 0 |
| 0 |
| 2,500,000 |
|
12/01 - 12/31 | 0 |
| 0 |
| 0 |
| 2,500,000 |
|
| | | | |
Total for Year | 0 |
| | 0 |
| |
On July 31, 2018, our Board reauthorized the repurchase of up to $2.5 million of the Company's common stock within a six-month period from the date of notice to investors, which notice was mailed on August 10, 2018. As of December 31, 2018, no repurchases had occurred.
On February 20, 2019, our Board reauthorized the repurchase of up to $2.5 million of the Company's common stock within a six-month period from the date of notice to investors, which notice is expected to be mailed on or about February 28, 2019.
Item 10. Submission of Matters to a Vote of Shareholders.
There have been no material changes to the procedures by which shareholders may recommend nominees to the registrant's Board of Directors as set forth in the registrant's Proxy Statement, dated April 30, 2018.
Item 11. Controls and Procedures.
(a) Based on an evaluation of the Registrant's Disclosure Controls and Procedures (as defined in Rule 30a-3(c) under the Investment Company Act of 1940, the “Disclosure Controls”) as of a date within 90 days prior to the filing date (the “Filing Date”) of this Form N-CSR (the “Report”), the Chief Executive Officer (its principal executive officer) and Chief Financial Officer (its principal financial officer) have concluded that the Disclosure Controls are reasonably designed to ensure that information required to be disclosed by the Registrant in the Report is recorded, processed, summarized and reported by the Filing Date, including ensuring that information required to be disclosed in the Report is accumulated and communicated to the Registrant's management, including the Registrant's principal executive officer and principal financial officer, as appropriate to allow timely decisions regarding required disclosure.
(b) There were no changes in the Registrant’s internal control over financial reporting (as defined in Rule 30a-3(d) under the Investment Company Act of 1940) that occurred during the Registrant’s last fiscal quarter that have materially affected or are reasonably likely to materially affect the Registrant’s internal control over financial reporting.
Item 12. Disclosure of Securities Lending Activities for Closed-End Management Investment Companies.
(a) Not applicable.
(b) Not applicable.
Item 13. Exhibits.
(a)(1) The Code of Conduct is available on the Company's website at https://ir.180degreecapital.com/governance-docs.
(a)(2) Certifications of the principal executive officer and the principal financial officer pursuant to Rule 30a-2(a)under the Investment Company Act of 1940.
(a)(3) Not applicable.
(a)(4) Not applicable.
(b) Certifications of the principal executive officer and the principal financial officer, as required by Rule 30a-2(b) under the Investment Company Act of 1940.
SIGNATURES
Pursuant to the requirements of the Securities Exchange Act of 1934 and the Investment Company Act of 1940, the Registrant has duly caused this report to be signed on its behalf by the undersigned, thereunto duly authorized.
180 DEGREE CAPITAL CORP.
|
| |
By: | /s/ Daniel B. Wolfe |
| Name: Daniel B. Wolfe |
| Title: President and Chief Financial Officer |
| |
| Date: February 25, 2019 |
Pursuant to the requirements of the Securities Exchange Act of 1934 and the Investment Company Act of 1940, this report has been signed below by the following persons on behalf of the Registrant and in the capacities and on the dates indicated.
|
| | | | |
By: | /s/ Kevin M. Rendino | | By: | /s/ Daniel B. Wolfe |
| Name: Kevin M. Rendino | | | Name: Daniel B. Wolfe |
| Title: Chief Executive Officer | | | Title: President and Chief Financial Officer |
| (Principal Executive Officer) | | | (Principal Financial Officer) |
| | | | |
| Date: February 25, 2019 | | | Date: February 25, 2019 |