UNITED STATES
SECURITIES AND EXCHANGE COMMISSION
Washington, D.C. 20549
FORM N-CSR
CERTIFIED SHAREHOLDER REPORT OF REGISTERED
MANAGEMENT INVESTMENT COMPANY
Investment Company Act file number 811-07074
| | |
| 180 DEGREE CAPITAL CORP. |
| (Exact Name of Registrant as Specified in Its Charter) |
| | | | | | | | |
| 7 N. Willow Street, Suite 4B, Montclair NJ | | 07042 |
| (Address of Principal Executive Offices) | | (Zip Code) |
| | |
Daniel B. Wolfe
President and Chief Financial Officer
180 Degree Capital Corp.
7 N. Willow Street, Suite 4B
Montclair, NJ 07042 |
| (Name and address of agent for service) |
|
Copy to:
John J. Mahon, Esq.
Schulte Roth & Zabel, LLP
1152 Fifteenth Street, NW
Suite 850
Washington, DC 20005
(202) 729-7477 |
Registrant's telephone number, including area code: (973) 746-4500
Date of fiscal year end: December 31
Date of reporting period: June 30, 2020
Beginning on January 1, 2021, and as permitted by a rule adopted by the Securities and Exchange Commission ("SEC"), paper copies of the shareholder reports of 180 Degree Capital Corp. (the "Company") like this one, will no longer be sent to you by mail unless you specifically request that your financial intermediary (i.e., the broker-dealer or bank through which you own your shares) or the Company, as applicable, send you paper copies. Instead, shareholder reports will be made available on a website, and you will be notified by mail each time a report is posted and you will be provided with a website link to access the report.
If you already have elected to receive shareholder reports electronically, you will not be affected by this change and need not take any action. You may elect to receive all future shareholder reports of the Company in paper free of charge. If you own shares through a financial intermediary, you may contact your financial intermediary to elect to continue to receive paper copies of your shareholder reports, or if your shares are not held by a financial intermediary, you may contact the Company's transfer agent, American Stock Transfer & Trust Company, LLC at 800-937-5449, or the Company at 833-293-1769.
Item 1.
Fellow Shareholders,
Samuel Beckett’s classic play, Waiting for Godot, is the story of two characters, Vladimir and Estragon, who are engaged in the endless drivel of inane conversations and activities all while waiting for the mysterious “Godot”- a man who will supposedly save them by giving them food and a place to sleep. For those who are not familiar with or who have not seen the play, I apologize for spoiling the ending… He never comes. Essentially, Beckett’s masterpiece is a story describing the human condition of waiting for something to happen that never will. For many years, our business was solely focused on venture capital investments and our shareholders suffered through years and years waiting for monetization events with superior returns. The monetization events were few and far between, and there was no alternative strategy to create value for our shareholders. In 2016, we devised a new strategy of investing in the public markets focused on our micro-cap activism. Simply put, unlike Vladimir and Estragon, we no longer wanted 180 to be dependent on outside forces for which we have little control. The good news on that front is that we have been able to grow our book value because of our public stock picking. The better news for us this past quarter is, surprisingly, Godot showed up in the form of a monetization event of Petra Pharma Corporation, one of our private holdings. This past quarter, Petra was sold to an undisclosed buyer. Between our direct ownership in Petra and our indirect ownership through Accelerator IV-New York Corporation, we received approximately $4.7 million in cash, approximately $350,000 in potential additional proceeds held in escrow for one year from the close of the transaction, shares in a new spinout company that are fair valued at approximately $110,000, and the potential for future payments upon achieving development and business milestones of up to approximately $86.9 million. We fair valued the potential future milestone payments at approximately $6.4 million as of the end of this quarter. Largely driven by Petra, our private portfolio was up 30.6% and grew our book value by $0.34 per share. On the public side, our gross total return of 23.9% was solid on an absolute return basis, was mixed in relation to the Russell Microcap Index increase of 30.5% and the Russell Microcap Value Index 22.7%.
The primary difference with how we view our private portfolio today versus years ago needs to be discussed. It is not that we were ever sour on our private holdings, or that we didn’t believe in them. It was simply that we had and continue to have limited control over the duration it would take to monetize the investments. When coupled with the facts that: 1) we had no other strategy (versus today’s public markets focus); 2) we had annual operating expenses that were nearly 8% of assets (versus half that today); and 3) we had limited cash and securities of publicly traded companies ($17.1 million, net of debt, as of the end of Q2 2016, versus $44.6 million, and no debt as of the end of the Q2 2020), we were headed down a path where we were going to be forced into selling positions we didn’t want to sell. Forced liquidations would prove destructive to value for our shareholders. For an investor, there is a big difference between “wanting” to sell and “having” to sell. Unlike four years ago, we now have a balance sheet which provides us the luxury of seeing our private holdings through to their natural conclusions. And today, we are in a position where our shareholders can benefit from an acquisition of Petra. In the last 3.5 years alone, we have monetized Mersana, HZO, and now Petra for values greater than their NAV marks. At 180, we don’t sit idly waiting for Godot; but it is really nice when he/she shows up! We had a great quarter of NAV growth of 27.4%.
In terms of the public markets, what can I possibly add that hasn’t been repeated? I have lived through many a bear market, but I’ve never invested through a pandemic. The question from the beginning is when will normalcy return. In my view, there is an expiration date on COVID-19 and a return to some sense of normalcy – that expiration date is likely when we have an effective vaccine. The speed at which we contain the virus, find therapeutics for the virus, ensure testing for the virus, and find a vaccine for the virus will determine how quickly the economy can rebound and how the market performs over the course of the next year. I see both sides of the bull/bear debate. The bear case is that the virus is incredibly lethal in certain people, is highly contagious, and will be with us for a very long time without a vaccine. The bull case is that the market has already adjusted to that, we are starting to leave our homes again, therapeutics are coming, and a vaccine is on its way. Following the collapse of the stock market in March, the market began to recover following massive fiscal and monetary stimulus programs. This past quarter, the economy began to re-open as cases of COVID-19 flattened across many of the states that were hit hard early on (e.g. New York and New Jersey). I think we will continue to see sudden shocks to the economy depending on the number of waves of the virus. Presently, we are seeing Florida, Texas, Arizona, California, and Georgia suffering through the same vicious outbreak of COVID-19 cases that earlier, hard-hit states experienced.
So many questions linger unanswered: Will we have to shut down again? Will schools open? Will restrictions be lifted on restaurants? Will sports return and, if so, for how long? Will more stimulus be needed? At what capacity will air travel resume? One of my favorite books is Freakonomics by Steven Levitt and Stephen Dubner, which studies the riddles of everyday life through an economics lens. In the introduction of the book, it is noted that “Levitt’s underlying belief that the modern world, despite a surfeit of obfuscation, complication, and downright deceit, is NOT impenetrable, is not unknowable, and -if the right questions are asked- is even more intriguing than we think.” Is there any greater riddle than trying to figure how the world, the stock market, and the economy are going to play out on a day to day basis?
Here is how 180 seeks to ask the right questions. For my whole career, I have tried to take the complexities of investing and boil them down to the one or two things that actually matter. For us, that is the notion that the price that we pay for a business will be the predominant determining factor in driving investment returns. Of course, you need catalysts and alpha generating management teams to coincide with just buying “cheap” stocks; our unwavering Graham Dodd value approach forces us to focus on buying good companies at the right price at the right time. Through all the uncertainties of the world we live in, we believe having that micro-focus on a select few companies will give us the greatest chance of creating significant value for 180’s shareholders.
It is so easy to preoccupy my time trying justify in my head how, for example, in the middle of a pandemic, the Nasdaq 100 index is up 28% (through August 5, 2020… more on this later). Why should I care about that? I don’t care in as much as that question has no relevance to how we are going to create value for 180's shareholders. We spend our time only on the things that mater for 180 and its shareholders. What I care about are making sound investments, using our activist influence, and looking for companies that we believe have the potential for 100% or greater returns in about 3 years. The “right question” for us is not, “Where is this market are going to be in the next three minutes?”, or "Have you seen how much the QQQ Index is up?" The questions for us are, "What is SONM going to be earning in two years?" and "Do I think QMCO can grow its topline by over 50% in the next three years?" That might sound Pollyannaish and it could come across as being naïve to the nasty environment or macro issues that affect the markets. It is neither. We are simply very disciplined about our process, know what characteristics we are looking for in a company, and when we find one, we make it a big holding. It is how I have viewed investing since 1988, and hopefully will accrue to the benefit for all 180’s shareholders. So, after reviewing our change in NAV for the quarter, let’s spend the time talking about our individual companies.
NET ASSET VALUE PER SHARE
Our net asset value per share (“NAV”) increased this quarter from $2.12 to $2.70. Our Fund has three principal components to the variance in our NAV: our public portfolio, our private portfolio, and our expenses. For the quarter, our public portfolio companies increased our NAV by $0.27, while our private portfolio companies increased our NAV by $0.34. Operating expenses decreased NAV by $0.03.
| | | | | | | | | | | | | | | | | |
| Quarter | YTD | 1 Year | 3 Year | Inception to Date |
| Q2 2020 | Q4 2019-Q2 2020 | Q2 2019-Q2 2020 | Q2 2017-Q2 2020 | Q4 2016-Q2 2020 |
| | | | | |
| | | | | |
| Change in NAV | 27.4% | (11.8)% | (4.3)% | 10.7% | 15.4% |
| | | | | |
| Russell Microcap Index | 30.5% | (11.2)% | (4.8)% | 2.6% | 7.0% |
| Russell Microcap Value Index | 22.7% | (21.4)% | (14.9)% | (8.8)% | (6.4)% |
| Russell 2000 | 25.4% | (13.0)% | (6.7)% | 6.1% | 11.4% |
Public Portfolio
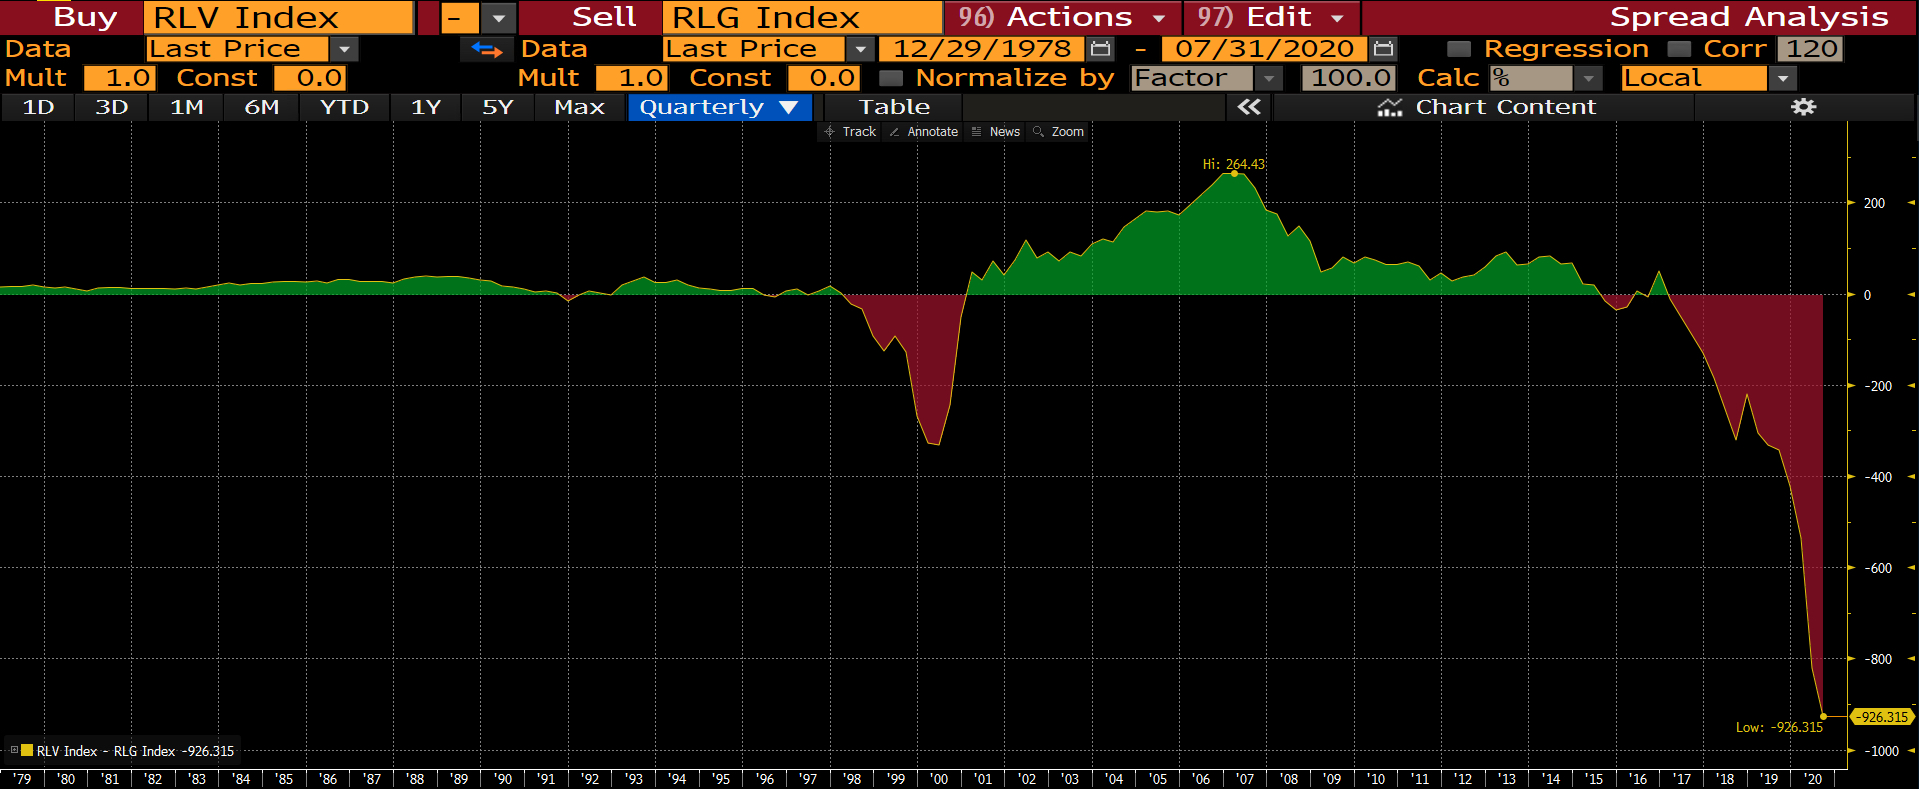
While we achieved a +23.9% gross total return, that was a mixed result relative to the Russell Microcap Index (+30.5%) and the Russell Microcap Value Index (+22.7%). I’ve never seen greater bifurcation of performance for the US Stock Market. For example, as of the end of July 2020, the Invesco QQQ (which tracks the Nasdaq 100) is +25.5% year to date while the Russell 2000 (which tracks mid-and small-cap stocks) is -10.6%. The Russell 1000 Growth Index is +18.3%, while the Russell 1000 Value Index is -13.0% year to date. We have seen the same discrepancy against the two indices we use to benchmark our performance. As of the end of July 2020, the Russell Microcap Growth Index is +5.7% while the Microcap Value Index is -21.7%. The differing returns are staggering. I mention this to serve as factual information because as you know, we play in the value sandbox of the market. While it is understandable that investors have gravitated towards those companies least impacted by COVID-19 (essentially large growth companies), the valuation discrepancy has never been so extreme as shown in the below screen.
Source: Bloomberg
Us value investors painfully lived through the all-of-nothing tech bubble back in 2000. As a matter of relative performance, the current period of draconian outperformance by the QQQ Index has led to an even greater disparity of performance between growth and value than the tech bubble by a factor of 3. As I said, I understand how we have gotten here given the meltdown of the economy. During periods like this, investors gravitate towards those companies showing growth. But I have also seen how it ends when investors pour money into only a select few companies. If and when this economy moves down the path of sustained recovery, there may be a huge catch up trade for the type of companies we invest in.
In the chart below, you see not only our quarter to date performance, but also our one year, three year, and inception to date performance. Fortunately, since the inception of 180, our focus on investing in publicly traded companies with our constructive activist approach has generated significant returns in that portion of our investment portfolio.
| | | | | | | | | | | | | | | | | |
| Quarter | YTD | 1 Year | 3 Year | Inception to Date |
| Q2 2020 | Q4 2019-Q2 2020 | Q2 2019-Q2 2020 | Q2 2017-Q2 2020 | Q4 2016-Q2 2020 |
TURN Public Portfolio
Gross Total Return | 23.9% | (14.3)% | 18.2% | 121.8% | 166.2% |
| | | | | |
| | | | | |
| | | | | |
| Russell Microcap Index | 30.5% | (11.2)% | (4.8)% | 2.6% | 7.0% |
| Russell Microcap Value Index | 22.7% | (21.4)% | (14.9)% | (8.8)% | (6.4)% |
| Russell 2000 | 25.4% | (13.0)% | (6.7)% | 6.1% | 11.4% |
Through the first month of Q3 2020 quarter, the gross total returns of our public portfolio is +11.7% versus +1.1% for the Russell Microcap Index and -0.4% for the Russell Microcap Value Index. For the year through July 31, 2020, our -4.3% gross total return beats both the Russell Microcap (-10.3%) and the Russell Microcap Value Index (-21.7%).
Let’s dig into the significant sources of the changes in value and some brief comments for our public portfolio in Q2 2020. We will then dig in on our latest new position, Sonim Technologies, Inc., in greater detail.
Sources of material increases in value:
•Quantum Corporation (NASDAQ:QMCO) renegotiated the covenants on its outstanding debt that provided increased operating flexibility and reduced investor concern over default risk. Hyperscaler customers are returning to purchasing, albeit not at the same rate as prior to the December 2019 pause. The positives during the quarter were tempered by an understandably lower than expected guidance for CYQ2 2020, due primarily to delays in purchasing by media and entertainment customers. QMCO was up 30.8% this quarter and added $0.04 to our NAV.
•Lantronix (NASDAQ:LTRX) reported record revenue for CYQ1 2020, despite supply chain and business disruptions due to the COVID-19 pandemic. LTRX saw increasing strength in the company’s remote connectivity solutions. LTRX has continued to add high-quality, former Microsemi experience to its senior leadership team (Paul Pickle, LTRX’s President/CEO was the former COO at Microsemi until its eventual takeover by Microchip). We purchased 86,269 shares at an average price per share of $3.03. LTRX was up 89.8% this quarter and added $0.07 to our NAV.
•Franchise Group (NASDAQ:FRG) is a leading North American operator and acquiror of franchised and franchisable businesses that uses its management team’s operating expertise to drive cost efficiencies and revenue synergies to grow its brands. We purchased shares of FRG in a PIPE transaction at an effective cost of $17.00 per share, which was a significant discount (~30%) to the low/mid-$20 share price at the time. FRG provided a business update in May that assuaged investor fears that the company was insolvent and/or at risk of bankruptcy. In the release, FRG estimated adjusted EPS for Q1 of $1.25 to $1.58, revenue of $585-$605 million, and cash on its balance sheet of over $120 million, which were all well above street estimates. This management team led by Brian Khan is stupendous. The company continued with its $0.25 quarterly dividend and the stock rose 160% in the quarter. We sold approximately half our position during the quarter at an average price per share of $25.80. FRG added $0.13 to our NAV in the quarter.
•Alta Equipment Group, Inc. (NYSE:ALTG) is a provider of premium materials handling equipment, construction equipment, cranes, warehouse solutions, power generation equipment, and contractors’ rental equipment. ALTG provided investors with a useful framework to understand the operating leverage in the company’s business in the face of COVID-19 related impacts. We encourage you to review their investor presentation from the prior quarter. It is a model for how companies should communicate with their investors. While business was impacted by stay-at-home orders early in the quarter, the lifting of those orders led to a quick recovery in certain markets (e.g., Florida construction-related business). ALTG also announced and closed on two acquisitions in the quarter. We purchased 104,340 shares during Q2 2020 at an average price of $4.61. ALTG stock was up 82.0% in the quarter and added $0.07 to our NAV.
Sources of material decreases in value:
•TheMaven, Inc. (OTC:MVEN) is a media coalition of professional content destinations, operating exclusively on a shared digital publishing, advertising, and distribution platform. MVEN provides a major media scale alternative to news and information on social platforms. The high-scale, unified platform offers operating leverage to all participants in MVEN’s ecosystem by eliminating all non-content operating expenses. MVEN’s distributed operating leverage enables its entire suite of services to be provided on a revenue share basis, which creates lower, non-fixed operating costs than if a media company was forced to run its own platform and digital ad sales team. MVEN provides distribution across 100+ million monthly users in a single platform, allowing advertisers to be more successful with return on investments in marketing. Among many properties, MVEN operates a 100-year license agreement to run Sports Illustrated, and it owns TheStreet.com, after purchasing that asset in 2019.
The COVID-19 pandemic shut down every sport in North America, which, in turn, caused a severe slowdown in advertising spend that has negatively impacted MVEN’s Sports Illustrated business. When you go through economic dislocation similar to what we have today, the first cost companies turn off is advertising. This economic dislocation has therefore had a severe impact on many big media companies who rely on advertising. The good news is MVEN has a significant portion of its revenues in relatively stable subscriptions revenues. MVEN has also built a tremendous platform and has seen skyrocketing views of video content. Given how widespread the weakness has been, MVEN may be in a position to take over other digital media assets from these big media companies who are looking at all ways to reduce their cost structures. However, for this stock to work, we believe major sports need to resume, the economy to stabilize, and for advertising to return to more normalized levels in the back half of the year.
MVEN is in the process of completing its financial statements so it can be up to date with all filings with the SEC. It is our expectation that after getting up to date with all filings sometime this year, MVEN will up-list to a national stock exchange. As part of our investment in the company, we are entitled to receive partial liquidating damages while the company is not up to date with its filings. As of June 30, 2020, these accrued liquidating damages are approximately $701,000, with $277,000 accrued this quarter, which partially offset the decline in the volume-weighted average price per share of MVEN’s common stock used to derive fair value. Of significant note, this quarter, 180 has joined the MVEN Board of Directors as a board observer. We currently believe, out of all the positions we own, MVEN has the chance to have the greatest return; although with that said, it carries short-term risks. MVEN is our largest publicly traded position. For the quarter, MVEN reduced our NAV by $0.05.
•Potbelly (NASDAQ:PBPB), unlike many of the holdings above, faces unique challenges through this pandemic. Stay-at-home orders have had a significant negative effect on the restaurant industry. Same store sales have plummeted throughout the industry, with full-service-only restaurants being the most impacted. Despite having zero bank debt coming into the crisis, PBPB drew its entire $40 million credit facility given the uncertain business outlook. As you know, we filed a 13D early this year noting our sizable position and intent to engage constructively with the company. Our expectation was PBPB was set to show improved results following its significant investment on a consulting project designed towards improving efficiency and comparable same store sales. If they couldn’t turn the business around, we were of the mindset that it would be time to turn the reigns over to a new team. Following the Q1 2020 earnings call, it became obvious that a change in leadership was necessary. In June 2020, we filed an amended 13D, noting the poor performance of the company under its CEO, while commending the Board for hiring a new CFO (Steve Cirulis) and two new Board members; all of whom have extensive restaurant experience. We also noted our increased ownership that makes 180 the largest reporting shareholder of PBPB. Most recently, the Board hired Robert Wright, the former COO of Wendy’s, as its new CEO. In our first encounter with Robert following the announcement of his hiring, we were more than impressed. The thing we liked the most was his decision to be paid in equity during the first year of his employment. His cash compensation for his first year is literally $1.00. Talk about an executive that understands and is fully aligned with his company’s shareholders. For the quarter, PBPB reduced our NAV by $0.04.
NEW POSITION: Sonim Technologies Inc.
Sonim Technologies Inc. (NASDAQ: SONM) is a communications company that provides rugged cellular phones and accessories specifically designed for workers who are physically engaged in their environments and often in mission-critical roles. These workers are typically in industrial/public sector enterprises operating across the construction, energy, utility, hospitality, logistics, manufacturing, public safety and transportation sectors. SONM’s business is divided into three product categories: smartphones (XP6, XP7, XP8), feature phones (XP3, XP5, XP5s), and accessories. SONM's products are generally sold to end customers by wireless carriers often on a subsidized basis. SONM generates over 90% of its revenues in the US and Canada. Primary competitors in the rugged handset market include Samsung, Kyocera, Bullitt Group Ltd. (provider of CAT branded rugged phones). Between May and September of 2019, SONM experienced technical and software issues with its devices, experienced significant carrier agreement delays, and grossly mismanaged sales delivery timing. This resulted in significantly reduced revised guidance of both the top and bottom lines and caused a decline of SONM's stock to ~$3 per share from a peak of ~$18 per share in June. SONM began restructuring efforts in September 2019 following the appointment of a new CEO (Tom Wilkinson) and CFO (Bob Tirva). Forward looking guidance was suspended as the restructuring efforts began.
In my former life following my days at Blackrock, I ran a fund called RGJ Capital where we were a significant shareholder in XPLORE Technologies (“XPLR”), which was led by Tom Wilkinson, the new CEO of SONM. Under Tom's leadership, XPLR’s business was dramatically improved and the company was ultimately acquired. 180 has confidence in Tom's abilities as an executive to engineer a similar turnaround at SONM. One of SONM’s first priorities was to clean up its balance sheet. SONM’s outstanding loans created substantial uncertainty as to the viability of the current business and prevented the company from investing in next-generation mobile devices and connectivity platforms. We believed that the removal of this debt overhang coupled with a cash infusion to fund development of future product lines could unlock value in the near term and allow management to focus on long-term value creation. This past quarter, 180 anchored a public offering of 36.8 million common shares at $0.75 per share that raised gross proceeds of $27.6 million. An additional 8.3 million shares were issued in exchange for conversion of 60% of the outstanding debt and $4 million was repaid in cash. SONM now has a clean balance sheet with no debt and substantial capital resources to fund development of its next-generation devices. 180's investment at $0.75 per share equates to an EV/TTM revenues of <0.2x. XPLR, a good comparable publicly traded company, was acquired at approximately 1x EV/TTM revenues. First responder connectivity has become increasingly important as the COVID-19 pandemic, as well as other domestic and global events, place additional importance on connectivity in all environments. This secular trend could provide meaningful growth opportunities for SONM.
Private Portfolio
For the quarter, our private portfolio increased in value by approximately $10.6 million, or $0.34 per share. The increase in value was led Petra ($0.29/share), with additional contributions from EchoPixel, Inc. ($0.03/share) and ORIG3N, Inc. ($0.03/share). These increases in value were offset in part by the decrease in Lodo Therapeutics Corporation ($0.01/share). Last quarter, a number of our private portfolio companies were adversely impacted by the COVID-19 pandemic. While many of these companies have recovered in part or in full from such impacts, it remains uncertain if negative impacts to value will return in future quarters.
We also noted that certain of our privately held companies were well positioned to provide valuable diagnostic and monitoring capabilities that could lead to material growth for those companies. For example, in April 2020, ORIG3N received an Emergency Use Authorization from the Food and Drug Administration for its novel COVID-19 diagnostic test. ORIG3N’s high-throughput automated test capabilities have generated meaningful growth for the company as it addresses this ever-increasing market need.
In last quarter’s shareholder letter we stated that, while we desire to shepherd our existing private portfolio to exits or explore opportunities to sell our positions in those companies, we have the luxury of being able to sell our private holdings when we believe it makes sense for shareholders rather than being forced to do so to survive. The remaking of our business and the significant cash and securities of publicly traded portfolio companies that we have grown mean that we don’t have to sell anything. This ability allowed us to benefit from the acquisition of Petra by an undisclosed party in Q2 2020, and possibly other liquidity events in the future.
As a refresher on the Petra acquisition, the acquiring company and the terms of the deal are confidential, so we can only speak to what 180 received from the transaction. We received approximately $4.4 million in cash at closing. In addition, we received $305,000 in cash from 180’s ownership in an entity affiliated with Petra, Accelerator IV-New York. Also, approximately $350,000 will be held in escrow for one year from the date of closing. 180 is also eligible, through its ownership in the acquired company and the affiliated entity, to receive up to approximately $86.9 million in potential future payments upon the achievement of undisclosed development and commercial milestones. 180 currently estimates that the first milestone payment could occur in 2-3 years, and subsequent milestone payments could occur at various points over the subsequent 10-20 years. The timing and likelihood of the acquirer achieving these milestones is highly uncertain, and if these milestones are achieved, the timing may be materially different than current estimates. These factors were used to develop a fair market value based on a probability-weighted net present value analysis of the potential future milestone payments of approximately $6.4 million. We note that successful completion of the first milestone alone would result in payment of approximately $6.8 million to 180. Lastly, simultaneous with the close of the transaction, Petra spun out certain assets into a new company. We own shares of this new company, Revanna Pharmaceuticals, Inc.
While we continue to believe there are other companies in the portfolio that hold promise to build value, the timelines and potential exit values for these companies are highly uncertain.
EXPENSES
As we have noted in previous letters, we have dramatically reduced our cost structure under our new strategy. In 2016, before our Fund’s change in investment focus and management team, our operating expenses, excluding stock-based compensation and interest on outstanding debt, averaged approximately $1.3 million per quarter. For Q2 2020, our operating expenses equaled approximately $893,000, a 17% increase from a year ago. A material portion of this increase was directly related to the legal expenses incurred with registering as a Registered Investment Adviser and other start-up costs associated with our new separate account for a portion of a publicly traded company’s pension fund.
TURN/NAV: SUM OF THE PARTS
As of the end of Q2 2020, TURN traded at 64.4% of its NAV. Our public securities, cash, and other assets net of liabilities were $1.40 per share. Our stock price was $1.74. If we received 100% credit for the value of these assets net of liabilities, the market is ascribing a value of approximately $0.34 per share, or approximately $10.5 million, to our private portfolio. Given our private assets are valued at approximately $40.5 million, the market is discounting the value of our private portfolio assets by 74% as of the end of Q2 2020.
As we grow our cash and liquid securities, the discount our stock trades to NAV should narrow. At the beginning of our strategy in 2017, we had 26.9% of our cash and total investments in cash and securities of public companies, and we were trading at a 41.0% discount to NAV. At the end of Q2 2020, we had 52.4% of our cash and total investments in cash and securities of public companies, and we traded at a 35.6% discount to NAV. While we have made considerable progress in changing the construct of our balance sheet, the market has barely rewarded us. There is more work to be done.
While it is aggravating to see a stock price for TURN that reflects receiving very little credit for the turnaround of our business, it is also noteworthy to comment on the lack of value attributed to our private portfolio. Petra is the most recent example that supports our belief that our stock price does not accurately reflect the value of our business. As already discussed, not only did we receive an immediate payment of $4.7 million (2x our Q1 2020 valuation), we have the ability to receive an additional $350,000 held in escrow for one year from the date of the closing of the transaction. We also retain ownership in a spinout company that will seek to monetize additional assets of the company, and we could receive future milestone payments of up to
approximately $86.9 million. We have some other biotech companies that saw their values increase this quarter due to their ability to provide needed products and services amidst the COVID-19 pandemic. AgBiome, in and of itself, has a $13.2 million value on our balance sheet and represents $0.43 of our book value. I believe the value of that position alone should allow our share price to be meaningfully above the value of our cash and public company investments, let alone others that not only have real value today, but have the potential to be monetized in the future. As always, if we don’t feel (and we absolutely do not) that we are properly being rewarded in the market for the assets we have on our balance sheet, 180’s management team will gladly head back to the open market and purchase TURN stock. As you know, I personally own approximately 900,000 shares and in total our board and management own 5.3% of 180. As you also know, because of restrictions in the Investment Company Act of 1940, we cannot pay our employees in stock. Therefore, all the stock we have bought in the open market since our inception in 2017 is with after-tax cash from our pockets.
CONCLUSION
In the middle of a global meltdown and the COVID-19 pandemic, we are proud to have received a mandate to manage a $25 million separate account for a pension fund. We started putting the money to work in early June 2020. We have talked often about exploring ways to seek capital. This announcement marks our first big win, but it won’t be our last. We will continue to build our asset base for those that want to invest in our strategy.
We live in interesting times. Not only has COVID-19 taken over our lives, real issues regarding racial injustice are dominating the day to day activities of our nation’s citizens. Add on top of all of that, we also have a presidential election in less than three months. We expect the market to experience extreme volatility as we exit the summer and into the home stretch of this calendar year. I would also note, that as of the writing of this letter (August 7, 2020), we have actually crossed from the red, with our public holdings gross total return now positive for the year; this transition is actually funny. If you took an Elon Musk shuttle around the universe for the last 8 months and four days, returned to planet Earth and saw 180 was flat for the year, you might say to yourself, “Wow, must have been a quiet year with not much happening.” Or… NOT. This has been both a wild and trying year, and I suspect we just completed the first section of this intense roller coaster. I make no assumptions that I know where this will all go, but I certainly think the meteoric rise over the last three months may have some misguided optimism regarding our ability to navigate through the COVID-19 virus pandemic. I do know this... Our quarter end book value is $2.70, and our share price starts with a “1”. Given our public portfolio gross total return is up 19.1% QTD through August 7, and our cash and securities of publicly traded companies currently equals approximately $1.70/share, I would like to think we have a long way to go to get the type of valuation our results warrant.
Thank you for your continued support.
Kevin Rendino
Chairman and Chief Executive Officer
| | |
180 DEGREE CAPITAL CORP.
CONSOLIDATED STATEMENT OF ASSETS AND LIABILITIES (UNAUDITED) |
| | | | | |
| | June 30, 2020 |
| ASSETS | |
| Investments in portfolio securities, at value: | |
| Unaffiliated privately held companies (cost: $16,371,995) | $ | 18,299,355 | |
| Unaffiliated publicly traded securities (cost: $15,145,385) | 18,195,511 | |
| Non-controlled affiliated privately held companies (cost: $34,101,772) | 14,305,640 | |
| Non-controlled affiliated publicly traded securities (cost: $23,109,373) | 17,745,078 | |
| Unaffiliated rights to payments (adjusted cost basis: $6,408,684) | 7,720,006 | |
| Cash | 7,934,245 | |
| Restricted cash | 11,639 | |
| Funds held in escrow from sales of investment, at value | 161,249 | |
| Receivable from portfolio companies and managed funds | 926,248 | |
| Prepaid expenses | 135,196 | |
| Interest receivable | 6,137 | |
| Other receivables | 71,121 | |
| Other assets | 30,319 | |
| Total assets | $ | 85,541,744 | |
| LIABILITIES & NET ASSETS | |
| |
| Post-retirement plan liabilities | $ | 1,252,460 | |
| Accounts payable and accrued liabilities | 334,041 | |
| Payable for securities purchased | 1,238 | |
| Total liabilities | $ | 1,587,739 | |
| Commitments and contingencies (Note 10) | |
| Net assets | $ | 83,954,005 | |
| Net assets are comprised of: | |
| Preferred stock, $0.10 par value, 2,000,000 shares authorized; none issued | $ | 0 | |
Common stock, $0.01 par value, 45,000,000 shares authorized; 34,623,341 issued | 334,594 | |
| Additional paid in capital | 122,785,067 | |
| Total accumulated distributable loss | (34,560,131) | |
Treasury stock, at cost 3,501,779 shares | (4,605,525) | |
| Net assets | $ | 83,954,005 | |
| Shares outstanding | 31,121,562 | |
| Net asset value per outstanding share | $ | 2.70 | |
The accompanying unaudited notes are an integral part of these unaudited consolidated financial statements.
9
| | |
180 DEGREE CAPITAL CORP.
CONSOLIDATED STATEMENT OF OPERATIONS (UNAUDITED) |
| | | | | |
| Six Months Ended
June 30, 2020 |
| Income: | |
| Interest from: | |
| Unaffiliated companies-PIK | $ | 28,685 | |
| Non-controlled affiliated companies-cash | 1,995 | |
| Non-controlled affiliated companies-PIK | 4,987 | |
| Other income (Note 2) | 595,160 | |
| Dividend income | 190,569 | |
| Fee income for providing managerial assistance to portfolio companies-non-cash | 26,895 | |
| Management fee income | 12,301 | |
| Carried interest | 4,640 | |
| Total income | 865,232 | |
| Operating fees and expenses: | |
| Salaries, bonus and benefits | 509,544 | |
| Professional | 390,492 | |
| Administration and operations | 182,473 | |
| Directors | 132,294 | |
| Insurance | 121,667 | |
| Rent | 13,674 | |
| Custody | 10,161 | |
| Other | 2,523 | |
| Total operating expenses | 1,362,828 | |
| Net investment loss before income tax expense | (497,596) | |
| Income tax expense | 122 | |
| Net investment loss | (497,718) | |
| Net realized gain (loss) from investments: | |
| Unaffiliated privately held companies | 7,963,973 | |
| Unaffiliated publicly traded securities | 1,306,521 | |
| Unaffiliated rights to payments | 23,976 | |
| Call options | (271,304) | |
| Funds held in escrow | 609 | |
| Net realized gain from investments | 9,023,775 | |
| Change in unrealized (depreciation) appreciation on investments: | |
| Unaffiliated privately held companies | (8,758,994) | |
| Unaffiliated publicly traded securities | (3,743,762) | |
| Non-controlled affiliated privately held companies | (1,758,797) | |
| Non-controlled affiliated publicly traded securities | (5,587,459) | |
| Unaffiliated rights to payments | 86,222 | |
| Net change in unrealized depreciation on investments | (19,762,790) | |
| Net realized gain from investments and change in unrealized depreciation on investments | (10,739,015) | |
| Share of loss on equity method investment | (22,901) | |
| Net decrease in net assets resulting from operations | $ | (11,259,634) | |
The accompanying unaudited notes are an integral part of these unaudited consolidated financial statements.
10
| | |
180 DEGREE CAPITAL CORP.
CONSOLIDATED STATEMENT OF CASH FLOWS (UNAUDITED) |
| | | | | |
| Six Months Ended
June 30, 2020 |
| Cash flows used in operating activities: | |
| Net decrease in net assets resulting from operations | $ | (11,259,634) | |
Adjustments to reconcile net decrease in net assets resulting from operations to net cash used in operating activities: | |
| Net realized gain from investments | (9,023,775) | |
Net change in unrealized depreciation on investments | 19,762,790 | |
| Share of loss on equity method investee | 22,901 | |
Depreciation of fixed assets | 2,523 | |
| Accretion of bridge note PIK interest income | (33,672) | |
| Fee income for providing managerial assistance to portfolio companies-non-cash | (26,895) | |
| Call options purchased | (523,562) | |
| Call options written | 252,258 | |
| Purchase of unaffiliated publicly traded securities | (11,184,359) | |
| Purchase of non-controlled affiliated publicly traded securities | (5,884,905) | |
| Distributions from sale of unaffiliated privately held companies | 4,605,796 | |
| Proceeds from sale of unaffiliated publicly traded securities | 12,803,921 | |
| Proceeds from unaffiliated rights to payments | 45,194 | |
| Changes in assets and liabilities: | |
| Increase in receivable from portfolio companies and managed funds | (681,449) | |
| Decrease in prepaid expenses | 132,757 | |
| Increase in interest receivable | (1,995) | |
| Increase in other receivables | (4,281) | |
| Decrease in other assets | 390 | |
| Decrease in receivable from sales of securities | 559,233 | |
| Decrease in post-retirement plan liabilities | (4,744) | |
| Decrease in accounts payable and accrued liabilities | (82,115) | |
| Decrease in bonus payable | (2,543,785) | |
| Decrease in payable for securities purchased | (355,375) | |
| Net cash used in operating activities | (3,422,783) | |
| Cash flows from investing activities: | |
| Purchase of fixed assets | (5,974) | |
| Net cash used in investing activities | (5,974) | |
| Net decrease in cash and restricted cash | (3,428,757) | |
| Cash and restricted cash at beginning of the period | 11,374,641 | |
| Cash and restricted cash at end of the period | $ | 7,945,884 | |
| Supplemental disclosures of cash flow information: | |
| Income taxes paid | $ | 122 | |
| |
| Cash | $ | 7,934,245 | |
| Restricted cash | 11,639 | |
| Total cash and restricted cash shown in the consolidated statement of cash flows | $ | 7,945,884 | |
The accompanying unaudited notes are an integral part of these unaudited consolidated financial statements.
11
| | |
180 DEGREE CAPITAL CORP.
CONSOLIDATED STATEMENTS OF CHANGES IN NET ASSETS |
| | | | | | | | | | | |
| Six Months Ended
June 30, 2020 | | Year Ended December 31, 2019 |
| (UNAUDITED) | | |
| Changes in net assets from operations: | | | |
| Net investment loss | $ | (497,718) | | | $ | (4,831,721) | |
| Net realized gain on investments | 9,023,775 | | | 9,642,262 | |
Net change in unrealized (depreciation) appreciation on investments | (19,762,790) | | | 8,410,882 | |
| Share of loss on equity method investment | (22,901) | | | (42,552) | |
| Net (decrease) increase in net assets resulting from operations | (11,259,634) | | | 13,178,871 | |
| Net (decrease) increase in net assets | (11,259,634) | | | 13,178,871 | |
| Net Assets: | | | |
| Beginning of the period/year | 95,213,639 | | | 82,034,768 | |
| End of the period/year | $ | 83,954,005 | | | $ | 95,213,639 | |
| | | |
The accompanying unaudited notes are an integral part of these unaudited consolidated financial statements.
12
| | |
180 DEGREE CAPITAL CORP.
CONSOLIDATED FINANCIAL HIGHLIGHTS |
| | | | | | | | | | | | | | | | | | | | | | | | | | | | | | | | | | | |
| Six Months Ended
June 30, 2020 | | Year Ended
Dec. 31, 2019 | | Year Ended
Dec. 31, 2018 | | Year Ended
Dec. 31, 2017 | | Year Ended
Dec. 31, 2016 | | Year Ended
Dec. 31, 2015 |
| (UNAUDITED) | | | | | | | | | | |
| Per Share Operating Performance: | | | | | | | | | | | |
| Net asset value per share, beginning of the period/year | $ | 3.06 | | | $ | 2.64 | | | $ | 2.60 | | | $ | 2.34 | | | $ | 2.88 | | | $ | 3.51 | |
Net investment loss* | (0.02) | | | (0.16) | | | (0.07) | | | (0.12) | | | (0.15) | | | (0.23) | |
Net realized gain (loss) from investments* | 0.29 | | | 0.31 | | | (0.25) | | | (0.38) | | | (0.26) | | | 0.15 | |
Net change in unrealized appreciation (depreciation) on investments and options*1 | (0.63) | | | 0.27 | | | 0.36 | | | 0.80 | | | (0.12) | | | (0.56) | |
Share of loss on equity method investment*2 | 0.00 | | | 0.00 | | | 0.00 | | | 0.00 | | | 0.00 | | | (0.01) | |
| Total* | (0.36) | | | 0.42 | | | 0.04 | | | 0.30 | | | (0.53) | | | (0.65) | |
Net (decrease) increase as a result of stock-based compensation expense*2 | 0.00 | | | 0.00 | | | 0.00 | | | (0.01) | | | 0.01 | | | 0.03 | |
Net increase as a result of purchase of treasury stock | 0.00 | | | 0.00 | | | 0.00 | | | 0.00 | | | 0.00 | | | 0.01 | |
Net decrease as a result of acquisition of vested restricted stock awards related to employee withholding2 | 0.00 | | | 0.00 | | | 0.00 | | | (0.02) | | | (0.01) | | | (0.01) | |
| Total (decrease) increase from capital stock transactions | 0.00 | | | 0.00 | | | 0.00 | | | (0.03) | | | 0.00 | | | 0.03 | |
Net (decrease) increase as a result of other comprehensive (loss) income*2 | 0.00 | | | 0.00 | | | 0.00 | | | (0.01) | | | (0.01) | | | (0.01) | |
| Net increase (decrease) in net asset value | (0.36) | | | 0.42 | | | 0.04 | | | 0.26 | | | (0.54) | | | (0.63) | |
| Net asset value per share, end of the period/year | $ | 2.70 | | | $ | 3.06 | | | $ | 2.64 | | | $ | 2.60 | | | $ | 2.34 | | | $ | 2.88 | |
| Stock price per share, end of the period/year | $ | 1.74 | | | $ | 2.15 | | | $ | 1.75 | | | $ | 1.97 | | | $ | 1.38 | | | $ | 2.20 | |
| Total return based on stock price | (19.07) | % | | 22.86 | % | | (11.17) | % | | 42.75 | % | | (37.27) | % | | (25.42) | % |
| Supplemental Data: | | | | | | | | | | | |
| Net assets, end of the period/year | $ | 83,954,005 | | | $ | 95,213,639 | | | $ | 82,034,768 | | | $ | 81,042,989 | | | $ | 72,255,610 | | | $ | 88,711,671 | |
Ratio of expenses, excluding taxes, to quarterly average net assets | 1.67 | % | 3 | 6.42 | % | ^ | 3.62 | % | ^ | 6.26 | % | ^ | 7.88 | % | | 8.15 | % |
Ratio of expenses, including taxes, to quarterly average net assets | 1.67 | % | 3 | 6.42 | % | ^ | 3.63 | % | ^ | 6.28 | % | 4^ | 7.89 | % | | 8.15 | % |
Ratio of net investment loss to quarterly average net assets | (0.61) | % | 3 | (5.42) | % | | (2.82) | % | | (4.68) | % | | (5.64) | % | | (7.22) | % |
| Average debt outstanding | $ | 0 | | | $ | 0 | | | $ | 0 | | | $ | 0 | | | $ | 4,590,164 | | | $ | 3,780,822 | |
| Average debt per share | $ | 0.00 | | | $ | 0.00 | | | $ | 0.00 | | | $ | 0.00 | | | $ | 0.15 | | | $ | 0.12 | |
| Portfolio turnover | 22.61 | % | | 30.17 | % | | 20.43 | % | | 8.83 | % | | ** | | ** |
Number of shares outstanding, end of the period/year | 31,121,562 | | | 31,121,562 | | | 31,121,562 | | | 31,121,562 | | | 30,904,209 | | | 30,845,754 | |
*Based on average shares outstanding.
^ The Company has entered into an expense offsetting arrangement with one of its unaffiliated brokers relating to broker fees paid. The total broker fee charged to the Company was applied as a credit to fees charged by an affiliate of the unaffiliated broker who the Company subscribes to for data services billed during the period/year. The Company received an offset to expense totaling approximately $15,700, $17,500 and $5,700 with that broker for the years ended December 31, 2019, December 31, 2018 and December 31, 2017, respectively. The Company received an offset to expense totaling approximately $11,300 with that broker for the period ended June 30, 2020.
**Prior to March 2017, the Company was a business development company investing primarily in privately held securities. Portfolio turnover was not a relevant indicator for such investments given that the Company did not generally pay brokerage fees on such investments.
1 Net unrealized losses include rounding adjustments to reconcile change in net asset value per share.
2 Amounts listed as zero are amounts calculated as less than $0.005.
3 Not annualized.
4 Ratio of expenses, including taxes and excluding expenses related to restructuring, to quarterly average net assets for the year ended December 31, 2017 was 5.19%.
The accompanying unaudited notes are an integral part of these unaudited consolidated financial statements.
13
| | | | | | | | | | | | | | | | | | | | | | | | | | | | | |
| 180 DEGREE CAPITAL CORP. CONSOLIDATED SCHEDULE OF INVESTMENTS AS OF JUNE 30, 2020 (UNAUDITED) | | | | | | | | | |
| | | | | | | | | |
| Method of
Valuation (1) | | Industry | | Shares/Principal | | Cost | | Value |
| | | | | | | | | | | | | | | | | | | | | | | | | | | | | |
| Investments in Unaffiliated Companies (2) - | | | | | | | | | |
| 43.5% of net assets at value | | | | | | | | | |
| | | | | | | | | |
| Privately Held Companies (Illiquid) - | | | | | | | | | |
| 21.8% of net assets at value | | | | | | | | | |
| | | | | | | | | |
| AgBiome, LLC (3)(4) | | | Fertilizers & Agricultural Chemicals | | | | | | |
| Develops agricultural products that reduce risk and improve yield | | | | | | | | | |
| Series A-1 Convertible Preferred Units (acquired 1/30/13) | (I) (L3) | | | | 2,000,000 | | | $ | 2,000,000 | | | $ | 10,144,876 | |
| Series A-2 Convertible Preferred Units (acquired 4/9/13-10/15/13) | (I) (L3) | | | | 417,392 | | | 521,740 | | | 2,154,611 | |
| Series B Convertible Preferred Units (acquired 8/7/15) | (I) (L3) | | | | 160,526 | | | 500,006 | | | 935,987 | |
| | | | | | | 3,021,746 | | | 13,235,474 | |
| | | | | | | | | |
| AutoTech Ventures Management I, LLC (3)(4)(5) | | | Asset Management & Custody Banks | | | | | | |
| Venture capital investing in automotive-related companies | | | | | | | | | |
| LLC Interests (acquired 12/1/17) | (M) (L3) | | | | 0 | | | 0 | | | 125,000 | |
| | | | | | | | | |
| DWSI Holdings, Inc. (3)(4)(6) | | | Technology Hardware, Storage & Peripherals | | | | | | |
| Develops high-performance quantum computing systems | | | | | | | | | |
| Class A Convertible Preferred Stock (acquired 4/14/20) | (I) (L3) | | | | 1,025,046 | | | 5,662,954 | | | 1,235,956 | |
| | | | | | | | | |
| Fleet Health Alliance, LLC (3)(4) | | | Health Care Technology | | | | | | |
| Develops software for information transfer amongst healthcare providers and consumers | | | | | | | | | |
| Unsecured Convertible Bridge Note, 0%, (acquired 4/22/16, no maturity date) | (I) (L3) | | | | $ | 225,000 | | | 225,000 | | | 0 | |
| | | | | | | | | |
| Lodo Therapeutics Corporation (3) | | | Pharmaceuticals | | | | | | |
| Develops novel therapeutics derived from a metagenome-based Natural Product Discovery Platform | | | | | | | | | |
| Series A Convertible Preferred Stock (acquired 12/21/15-4/22/16) | (I) (L3) | | | | 658,190 | | | 658,190 | | | 353,601 | |
| Secured Convertible Bridge Note, 6% PIK, (acquired 6/27/19, maturing 5/7/21) | (M) (L3) | | | | $ | 474,019 | | | 502,850 | | | 502,850 | |
| | | | | | | 1,161,040 | | | 856,451 | |
| | | | | | | | | |
The accompanying unaudited notes are an integral part of this unaudited consolidated financial statements.
14
| | | | | | | | | | | | | | | | | | | | | | | | | | | | | |
| 180 DEGREE CAPITAL CORP. CONSOLIDATED SCHEDULE OF INVESTMENTS AS OF JUNE 30, 2020 (UNAUDITED) | | | | | | | | | |
| | | | | | | | | |
| Method of
Valuation (1) | | Industry | | Shares/Principal | | Cost | | Value |
| | | | | | | | | | | | | | | | | | | | | | | | | | | | | |
| Investments in Unaffiliated Companies (2) - | | | | | | | | | |
| 43.5% of net assets at value (cont.) | | | | | | | | | |
| | | | | | | | | |
| Privately Held Companies (Illiquid) - | | | | | | | | | |
| 21.8% of net assets at value (cont.) | | | | | | | | | |
| | | | | | | | | |
| Magnolia Neurosciences Corporation (3)(4) | | | Pharmaceuticals | | | | | | |
| Develops novel therapeutics for treatment of neurodegeneration | | | | | | | | | |
| Series A Convertible Preferred Stock (acquired 8/3/18) | (I) (L3) | | | | 862,872 | | | $ | 862,872 | | | $ | 655,897 | |
| | | | | | | | | |
| Nanosys, Inc. (3)(4) | | | Specialty Chemicals | | | | | | |
| Develops inorganic nanowires and quantum dots for use in LED-backlit devices | | | | | | | | | |
| Series C Convertible Preferred Stock (acquired 4/10/03) | (I) (L3) | | | | 803,428 | | | 1,500,000 | | | 440,676 | |
| Series D Convertible Preferred Stock (acquired 11/7/05) | (I) (L3) | | | | 1,016,950 | | | 3,000,003 | | | 895,344 | |
| Series E Convertible Preferred Stock (acquired 8/13/10) | (I) (L3) | | | | 433,688 | | | 496,573 | | | 470,149 | |
| | | | | | | 4,996,576 | | | 1,806,169 | |
| | | | | | | | | |
| NanoTerra, Inc. (3)(4) | | | Research & Consulting Services | | | | | | |
| Develops surface chemistry and nano-manufacturing solutions | | | | | | | | | |
| Warrants for Common Stock expiring on 2/22/21 (acquired 2/22/11) | (I) (L3) | | | | 4,462 | | | 69,168 | | | 0 | |
| Warrants for Series A-3 Preferred Stock expiring on 11/15/22 (acquired 11/15/12) | (I) (L3) | | | | 47,508 | | | 35,403 | | | 0 | |
| | | | | | | 104,571 | | | 0 | |
| | | | | | | | | |
| Revanna Pharmaceuticals, Inc. (3)(4)(7)(8) | | | Pharmaceuticals | | | | | | |
| Holding company for intellectual property in oncology therapeutics | | | | | | | | | |
| Common Stock (acquired 5/14/20) | (M) (L3) | | | | 2,584,763 | | | 103,391 | | | 103,391 | |
| | | | | | | | | |
| Phylagen, Inc. (3)(4) | | | Research & Consulting Services | | | | | | |
| Develops technology to improve human health and business productivity | | | | | | | | | |
| Series A Convertible Preferred Stock (acquired 11/14/18) | (M) (L3) | | | | 548,031 | | | 233,845 | | | 281,017 | |
| | | | | | | | | |
| Total Unaffiliated Privately Held Companies (cost: $16,371,995) | | | | | | | | | $ | 18,299,355 | |
| | | | | | | | | |
The accompanying unaudited notes are an integral part of this unaudited consolidated financial statements.
15
| | | | | | | | | | | | | | | | | | | | | | | | | | | | | |
| 180 DEGREE CAPITAL CORP. CONSOLIDATED SCHEDULE OF INVESTMENTS AS OF JUNE 30, 2020 (UNAUDITED) | | | | | | | | | |
| | | | | | | | | |
| Method of
Valuation (1) | | Industry | | Shares/Principal | | Cost | | Value |
| | | | | | | | | | | | | | | | | | | | | | | | | | | | | |
| Investments in Unaffiliated Companies (2) - | | | | | | | | | |
| 43.5% of net assets at value (cont.) | | | | | | | | | |
| | | | | | | | | |
| Unaffiliated Publicly Traded Securities - | | | | | | | | | |
| 21.7% of net assets at value | | | | | | | | | |
| | | | | | | | | |
| Alta Equipment Group, Inc. (4) | | | Trading Companies & Distributors | | | | | | |
| Operates as an industrial and construction equipment company | | | | | | | | | |
| Common Stock (Unrestricted) (acquired 2/14/20-5/15/20) | (M) (L1) | | | | 558,628 | | | $ | 4,388,085 | | | $ | 4,340,540 | |
| Warrants for the Purchase of Common Stock expiring 4/8/24 (acquired 2/14/20) | (M) (L1) | | | | 150,000 | | | 222,879 | | | 157,095 | |
| | | | | | | 4,610,964 | | | 4,497,635 | |
| | | | | | | | | |
| Franchise Group, Inc. | | | Specialized Consumer Services | | | | | | |
| Operates franchised and franchisable businesses | | | | | | | | | |
| Common Stock (acquired 3/12/20) | (M) (L1) | | | | 143,169 | | | 2,433,874 | | | 3,132,538 | |
| | | | | | | | | |
| Lantronix, Inc. (4) | | | Communications Equipment | | | | | | |
| Provides secure data access and management solutions | | | | | | | | | |
| Common Stock (acquired 9/18/18-6/24/20) | (M) (L1) | | | | 1,215,671 | | | 3,882,559 | | | 4,510,139 | |
| | | | | | | | | |
| OpGen, Inc. (4)(9) | | | Biotechnology | | | | | | |
| Developing tools for genomic sequence assembly and analysis | | | | | | | | | |
| Warrants for the Purchase of Common Stock expiring 2/17/25 (acquired 5/5/15) | (I) (L3) | | | | 62 | | | 785 | | | 27 | |
| | | | | | | | | |
| Quantum Corporation (4) | | | Technology Hardware, Storage & Peripherals | | | | | | |
| Provides high-density data storage and high-speed data processing solutions | | | | | | | | | |
| Common Stock (acquired 2/4/19-4/7/20) | (M) (L1) | | | | 1,515,605 | | | 4,022,813 | | | 5,850,235 | |
| | | | | | | | | |
| Miscellaneous Common Stocks (10) | (M) (L1) | | | | | | 194,390 | | | 204,937 | |
| | | | | | | | | |
| Total Unaffiliated Publicly Traded Securities (cost: $15,145,385) | | | | | | | | | $ | 18,195,511 | |
| | | | | | | | | |
| Total Investments in Unaffiliated Companies (cost: $31,517,380) | | | | | | | | | $ | 36,494,866 | |
| | | | | | | | | |
The accompanying unaudited notes are an integral part of this unaudited consolidated financial statements.
16
| | | | | | | | | | | | | | | | | | | | | | | | | | | | | |
| 180 DEGREE CAPITAL CORP. CONSOLIDATED SCHEDULE OF INVESTMENTS AS OF JUNE 30, 2020 (UNAUDITED) | | | | | | | | | |
| | | | | | | | | |
| Method of
Valuation (1) | | Industry | | Shares/Principal | | Cost | | Value |
| | | | | | | | | | | | | | | | | | | | | | | | | | | | | |
| Investments in Non-Controlled Affiliated Companies (2) - | | | | | | | | | |
| 38.2% of net assets at value | | | | | | | | | |
| | | | | | | | | |
| Privately Held Companies (Illiquid) - | | | | | | | | | |
| 17.0% of net assets at value | | | | | | | | | |
| | | | | | | | | |
| ABSMaterials, Inc. (3) | | | Specialty Chemicals | | | | | | |
| Develops nano-structured absorbent materials for water remediation and consumer applications | | | | | | | | | |
| Series A Convertible Preferred Stock (acquired 2/17/10-10/24/11) | (I) (L3) | | | | 390,000 | | | $ | 435,000 | | | $ | 23,064 | |
| Series B Convertible Preferred Stock (acquired 11/8/13-6/25/14) | (I) (L3) | | | | 1,037,751 | | | 1,217,644 | | | 319,984 | |
| Secured Convertible Bridge Note, 8% PIK, (acquired 1/20/16, maturing 12/31/20) | (M) (L3) | | | | $ | 100,000 | | | 135,595 | | | 135,595 | |
| Secured Convertible Bridge Note, 8% PIK, (acquired 3/28/17, maturing 12/31/20) | (M) (L3) | | | | $ | 25,000 | | | 31,526 | | | 31,526 | |
| | | | | | | 1,819,765 | | | 510,169 | |
| | | | | | | | | |
| Accelerator IV-New York Corporation (3)(11) | | | Research & Consulting Services | | | | | | |
| Identifies and managing emerging biotechnology companies | | | | | | | | | |
| Series A Common Stock (acquired 7/21/14-12/12/18) | (I) (L3) | | | | 833,333 | | 0 | | 679,446 | |
| | | | | | | | | |
| Black Silicon Holdings, Inc. (3)(4)(8)(12) | | | Semiconductors | | | | | | |
| Holding company for interest in a company that develops silicon-based optoelectronic products | | | | | | | | | |
| Series A Convertible Preferred Stock (acquired 8/4/15) | (M) (L3) | | | | 233,499 | | | 750,000 | | | 0 | |
| Series A-1 Convertible Preferred Stock (acquired 8/4/15) | (M) (L3) | | | | 2,966,667 | | | 890,000 | | | 0 | |
| Series A-2 Convertible Preferred Stock (acquired 8/4/15) | (M) (L3) | | | | 4,207,537 | | | 2,445,000 | | | 0 | |
| Series B-1 Convertible Preferred Stock (acquired 8/4/15) | (M) (L3) | | | | 1,892,836 | | | 1,169,561 | | | 0 | |
| Series C Convertible Preferred Stock (acquired 8/4/15) | (M) (L3) | | | | 1,674,030 | | | 1,171,316 | | | 0 | |
| Secured Convertible Bridge Note, 8% PIK, (acquired 8/25/16, maturing 8/4/21) | (M) (L3) | | | | $ | 1,278,453 | | | 1,444,368 | | | 263,994 | |
| | | | | | | 7,870,245 | | | 263,994 | |
| | | | | | | | | |
The accompanying unaudited notes are an integral part of this unaudited consolidated financial statements.
17
| | | | | | | | | | | | | | | | | | | | | | | | | | | | | |
| 180 DEGREE CAPITAL CORP. CONSOLIDATED SCHEDULE OF INVESTMENTS AS OF JUNE 30, 2020 (UNAUDITED) | | | | | | | | | |
| | | | | | | | | |
| Method of
Valuation (1) | | Industry | | Shares/Principal | | Cost | | Value |
| | | | | | | | | | | | | | | | | | | | | | | | | | | | | |
| Investments in Non-Controlled Affiliated Companies (2) - | | | | | | | | | |
| 38.2% of net assets at value (cont.) | | | | | | | | | |
| | | | | | | | | |
| Privately Held Companies (Illiquid) - | | | | | | | | | |
| 17.0% of net assets at value (cont.) | | | | | | | | | |
| | | | | | | | | |
| EchoPixel, Inc. (3)(4) | | | Health Care Equipment | | | | | | |
| Develops virtual reality 3-D visualization software for life sciences and health care applications | | | | | | | | | |
| Series Seed Convertible Preferred Stock (acquired 6/21/13-6/30/14) | (I) (L3) | | | | 4,194,630 | | | $ | 1,250,000 | | | $ | 1,010,296 | |
| Series Seed-2 Convertible Preferred Stock (acquired 1/22/16) | (I) (L3) | | | | 1,476,668 | | | 500,000 | | | 360,137 | |
| Series A-2 Convertible Preferred Stock (acquired 3/23/17) | (I) (L3) | | | | 1,471,577 | | | 350,000 | | | 424,659 | |
| | | | | | | 2,100,000 | | | 1,795,092 | |
| | | | | | | | | |
| Essential Health Solutions, Inc. (3) | | | Health Care Technology | | | | | | |
| Develops software for information transfer amongst healthcare providers and consumers | | | | | | | | | |
| Common Stock (acquired 11/18/16) | (I) (L3) | | | | 200,000 | | | 20 | | | 132,476 | |
| Series A Convertible Preferred Stock (acquired 11/18/16) | (I) (L3) | | | | 2,750,000 | | | 2,750,000 | | | 2,677,951 | |
| Unsecured Convertible Bridge Note, 8%, (acquired 12/19/18, maturing 12/19/21) | (I) (L3) | | | | $ | 50,000 | | | 50,000 | | | 50,000 | |
| | | | | | | 2,800,020 | | | 2,860,427 | |
| | | | | | | | | |
| HALE.life Corporation (3)(4) | | | Health Care Technology | | | | | | |
| Develops a platform to facilitate precision health and medicine | | | | | | | | | |
| Common Stock (acquired 3/1/16) | (I) (L3) | | | | 1,000,000 | | | 10 | | | 68,198 | |
| Series Seed-1 Convertible Preferred Stock (acquired 3/28/17) | (I) (L3) | | | | 11,000,000 | | | 1,896,920 | | | 1,096,668 | |
| Series Seed-2 Convertible Preferred Stock (acquired 12/28/18) | (I) (L3) | | | | 12,083,132 | | | 2,500,000 | | | 1,287,815 | |
| | | | | | | 4,396,930 | | | 2,452,681 | |
| | | | | | | | | |
| ORIG3N, Inc. (3)(4) | | | Health Care Technology | | | | | | |
| Develops consumer focused genetic tests | | | | | | | | | |
| Series 1 Convertible Preferred Stock (acquired 2/5/15-8/5/15) | (H) (L3) | | | | 1,195,315 | | | 500,000 | | | 1,140,952 | |
| Series A Convertible Preferred Stock (acquired 11/25/15-9/7/16) | (H) (L3) | | | | 1,364,666 | | | 1,500,000 | | | 1,357,551 | |
| Series A-2 Convertible Preferred Stock (acquired 5/11/17-2/8/18) | (H) (L3) | | | | 176,386 | | | 200,002 | | | 185,280 | |
| | | | | | | 2,200,002 | | | 2,683,783 | |
| | | | | | | | | |
The accompanying unaudited notes are an integral part of this unaudited consolidated financial statements.
18
| | | | | | | | | | | | | | | | | | | | | | | | | | | | | |
| 180 DEGREE CAPITAL CORP. CONSOLIDATED SCHEDULE OF INVESTMENTS AS OF JUNE 30, 2020 (UNAUDITED) | | | | | | | | | |
| | | | | | | | | |
| Method of
Valuation (1) | | Industry | | Shares/Principal | | Cost | | Value |
| | | | | | | | | | | | | | | | | | | | | | | | | | | | | |
| Investments in Non-Controlled Affiliated Companies (2) - | | | | | | | | | |
| 38.2% of net assets at value (cont.) | | | | | | | | | |
| | | | | | | | | |
| Privately Held Companies (Illiquid) - | | | | | | | | | |
| 17.0% of net assets at value (cont.) | | | | | | | | | |
| | | | | | | | | |
| Produced Water Absorbents, Inc. (3)(4)(13)(14) | | | Oil & Gas Equipment & Services | | | | | | |
| Provides integrated process separation solutions to the global oil and gas industries, enabling onsite treatment of produced and flowback water | | | | | | | | | |
| Common Stock (acquired 4/30/16) | (M) (L3) | | | | 50,243,350 | | | $ | 7,670,281 | | | $ | 0 | |
| Warrants for Common Stock expiring upon liquidation event (acquired 4/30/16) | (M) (L3) | | | | 450,000 | | | 65,250 | | | 0 | |
| Senior Secured Debt, 15% commencing on 4/1/16, matured on 12/31/19 (acquired 4/1/16) | (M) (L3) | | | | $ | 2,533,766 | | | 2,533,766 | | | 0 | |
| | | | | | | 10,269,297 | | | 0 | |
| | | | | | | | | |
| TARA Biosystems, Inc. (3)(4) | | | Life Sciences Tools & Services | | | | | | |
| Develops human tissue models for toxicology and drug discovery applications | | | | | | | | | |
| Common Stock (acquired 8/20/14) | (I) (L3) | | | | 2,000,000 | | | 20 | | | 543,932 | |
| Series A Convertible Preferred Stock (acquired 3/31/17) | (I) (L3) | | | | 6,878,572 | | | 2,545,493 | | | 2,438,255 | |
| Series A-2 Convertible Preferred Stock (acquired 4/18/19) | (I) (L3) | | | | 208,577 | | | 100,000 | | | 77,861 | |
| | | | | | | 2,645,513 | | | 3,060,048 | |
| | | | | | | | | |
| Total Non-Controlled Affiliated Privately Held Companies (cost: $34,101,772) | | | | | | | | | $ | 14,305,640 | |
| | | | | | | | | |
| Non-Controlled Affiliated Publicly Traded Securities - | | | | | | | | | |
| 21.2% of net assets at value | | | | | | | | | |
| | | | | | | | | |
| Potbelly Corporation (4) | | | Restaurants | | | | | | |
| Operates a chain of sandwich shops | | | | | | | | | |
| Common Stock (acquired 6/24/19-6/1/20) | (M) (L1) | | | | 1,489,455 | | | $ | 6,195,900 | | | $ | 3,395,957 | |
| | | | | | | | | |
| Sonim Technologies, Inc. (4) | | | Technology Hardware, Storage & Peripherals | | | | | | |
| Provides rugged communications products | | | | | | | | | |
| Common Stock (acquired 6/5/20-6/30/20) | (M) (L1) | | | | 5,901,547 | | | 4,426,238 | | | 4,726,549 | |
| | | | | | | | | |
The accompanying unaudited notes are an integral part of this unaudited consolidated financial statements.
19
| | | | | | | | | | | | | | | | | | | | | | | | | | | | | |
| 180 DEGREE CAPITAL CORP. CONSOLIDATED SCHEDULE OF INVESTMENTS AS OF JUNE 30, 2020 (UNAUDITED) | | | | | | | | | |
| | | | | | | | | |
| Method of
Valuation (1) | | Industry | | Shares/Principal | | Cost | | Value |
| | | | | | | | | | | | | | | | | | | | | | | | | | | | | |
| Investments in Non-Controlled Affiliated Companies (2) - | | | | | | | | | |
| 38.2% of net assets at value (cont.) | | | | | | | | | |
| | | | | | | | | |
| Non-Controlled Affiliated Publicly Traded Securities - | | | | | | | | | |
| 21.2% of net assets at value (cont.) | | | | | | | | | |
| | | | | | | | | |
| Synacor, Inc. (4)(15) | | | Application Software | | | | | | |
| Provides technology development, multiplatform services and revenue partner for video, internet and communications providers, device manufacturers, and enterprises | | | | | | | | | |
| Common Stock (acquired 4/6/17-4/1/20) | (M) (L1) | | | | 1,720,888 | | | $ | 4,487,235 | | | $ | 1,944,603 | |
| Stock Options for Common Stock Expiring 2/28/29 (acquired 3/1/19) (3)(16) | (I) (L3) | | | | 50,000 | | | 0 | | | 24,607 | |
| Stock Options for Common Stock Expiring 5/16/29 (acquired 5/16/19) (3)(16) | (I) (L3) | | | | 15,000 | | | 0 | | | 7,692 | |
| Restricted Stock Units (acquired 2/27/20) (3)(16) | (M) (L2) | | | | 10,072 | | | 0 | | | 11,381 | |
| | | | | | | 4,487,235 | | | 1,988,283 | |
| | | | | | | | | |
| TheMaven, Inc. (3)(4) | | | Interactive Media & Services | | | | | | |
| Provides a shared digital publishing, advertising and distribution platform | | | | | | | | | |
| Series H Convertible Preferred Stock (acquired 6/27/19) | (M) (L2) | | | | 1,320 | | | 2,000,000 | | | 1,981,916 | |
| Series I Convertible Preferred Stock (acquired 6/28/19) | (M) (L2) | | | | 5,000 | | | 5,000,000 | | | 4,954,246 | |
| Series J Convertible Preferred Stock (acquired 10/7/19) | (M) (L2) | | | | 1,000 | | | 1,000,000 | | | 698,127 | |
| | | | | | | 8,000,000 | | | 7,634,289 | |
| | | | | | | | | |
| Total Non-Controlled Affiliated Publicly Traded Securities (cost: $23,109,373) | | | | | | | | | $ | 17,745,078 | |
| | | | | | | | | |
| Total Investments in Non-Controlled Affiliated Companies (cost: $57,211,145) | | | | | | | | | $ | 32,050,718 | |
| | | | | | | | | |
| Total Investments (cost: $88,728,525) | | | | | | | | | $ | 68,545,584 | |
| | | | | | | | | |
| | | | | | | | | |
The accompanying unaudited notes are an integral part of this unaudited consolidated financial statements.
20
| | | | | | | | | | | | | | | | | | | | | | | | | | | | | |
| 180 DEGREE CAPITAL CORP. CONSOLIDATED SCHEDULE OF INVESTMENTS AS OF JUNE 30, 2020 (UNAUDITED) | | | | | | | | | |
| | | | | | | | | |
| Method of
Valuation (1) | | Industry | | Shares/Principal | | Cost | | Value |
| | | | | | | | | | | | | | | | | | | | | | | | | | | | | |
| Other Financial Instruments (17) | | | | | | | | | |
| | | | | | | | | |
| Unaffiliated Rights to Payments (Illiquid) - | | | | | | | | | |
| 9.2% of net assets at value | | | | | | | | | |
| | | | | | | | | |
| Rights to Milestone Payments from Acquisition of BioVex Group, Inc. (acquired 3/4/11) (3)(4)(18) | (I) (L3) | | Biotechnology | | $ | 548,998 | | | $ | 548,998 | | | $ | 1,816,050 | |
| | | | | | | | | |
| Rights to Milestone Payments from Acquisition of Petra Pharma Corporation (acquired 5/14/20) (3)(4)(19) | (I) (L3) | | Pharmaceuticals | | $ | 5,859,686 | | | 5,859,686 | | | 5,903,956 | |
| | | | | | | | | |
| Rights to Payments from the Merger with Xenio Systems, Inc. (acquired 10/20/17) (3)(4)(20) | (I) (L3) | | Technology Hardware, Storage & Peripherals | | $ | 0 | | | 0 | | 0 | |
| | | | | | | | | |
| Total Unaffiliated Rights to Payments (adjusted cost: $6,408,684) | | | | | | | | | $ | 7,720,006 | |
| | | | | | | | | |
| Total Investments in Privately Held Companies and Publicly Traded Securities and Other Financial Instruments (cost: $95,137,209) | | | | | | | | | $ | 76,265,590 | |
The accompanying unaudited notes are an integral part of this unaudited consolidated financial statements.
21
180 DEGREE CAPITAL CORP.
NOTES TO CONSOLIDATED SCHEDULE OF INVESTMENTS AS OF JUNE 30, 2020
(UNAUDITED)
Notes to Consolidated Schedule of Investments
(1)See Note 2. Summary of Significant Accounting Policies of the Notes to Consolidated Financial Statements (Unaudited).
(2)Investments in unaffiliated companies consist of investments in which we own less than five percent of the voting shares of the portfolio company. Investments in non-controlled affiliated companies consist of investments in which we own five percent or more, but less than 25 percent, of the voting shares of the portfolio company, or where we control one or more seats on the portfolio company’s board of directors but do not control the company. Investments in controlled affiliated companies consist of investments in which we own 25 percent or more of the outstanding voting rights of the portfolio company or otherwise control the company, including control of a majority of the seats on the board of directors, or more than 25 percent of the seats on the board of directors, with no other entity or person in control of more director seats than us.
(3)We are subject to legal restrictions on the sale of all or a portion of our investment(s) in this company. The total amount of restricted securities held is $48,002,970, or 57.2 percent of net assets.
(4)Represents a non-income producing investment. Investments that have not paid dividends or interest within the last 12 months or are on non-accrual status for at least 12 consecutive months are considered to be non-income producing.
(5)We received LLC Interests of 1.25 percent in AutoTech Ventures Management I, LLC ("AutoTech") pursuant to an Administrative Services Agreement between us and AutoTech and due to us following the termination of a former employee of the Company. These LLC Interests were separate from the compensation received for providing the administrative services under the agreement that were paid in cash. The LLC interests have a capital percentage of 0 percent.
(6)The Company initially invested in D-Wave Systems, Inc. starting in 2008 and through 2014, acquiring various classes of preferred stock. On April 14, 2020, D-Wave Systems, Inc. reorganized as a subsidiary of a new company, DWSI Holdings, Inc. ("DWSI"). As part of the reorganization, all of the outstanding stock of D-Wave Systems, Inc., was consolidated into a single class of preferred stock of DWSI on a one-for-one basis. DWSI then completed a 1-for-5 reverse stock split. DWSI continues to do business as D-Wave Systems, Inc. and is located and doing business primarily in Canada. We invested in D-Wave Systems, Inc. and now DWSI, through Parallel Universes, Inc., a Delaware company.
(7)The Company received shares of Revanna Pharmaceuticals, Inc., as part of the consideration of the acquisition of Petra Pharma Corporation.
(8)Represents a non-operating entity that exists to collect future payments from licenses or other engagements, monetize assets for future distributions to investors and debt holders, or is in the process of shutting down and distributing remaining assets according to a liquidation waterfall.
(9)On August 28, 2019, OpGen, Inc. effectuated a 1:20 reverse stock split of its common stock. The warrants held by the Company are for the purchase of common stock.
(10)The identities of these securities have been concealed to protect the Company while it completes a purchase or selling program for these securities.
(11)Historically, Accelerator IV-New York Corporation ("Accelerator") was valued under the equity method of accounting. In May 2020, the Company received distributions of its pro rata share of the distribution Accelerator received from the acquisition of Petra Pharma Corporation. The Company could receive further distributions as is described in more detail in Note 2. Summary of Significant Accounting Policies. As a result of this transaction, Accelerator is fair valued by the Company's Board of Directors, under the income approach.
The accompanying unaudited notes are an integral part of this unaudited consolidated financial statements.
22
180 DEGREE CAPITAL CORP.
NOTES TO CONSOLIDATED SCHEDULE OF INVESTMENTS AS OF JUNE 30, 2020
(UNAUDITED)
(12)On August 4, 2015, SiOnyx, Inc., reorganized its corporate structure to become a subsidiary of a new company, Black Silicon Holdings, Inc. Our security holdings of SiOnyx, Inc. were converted into securities of Black Silicon Holdings, Inc. SiOnyx, Inc. was then acquired by an undisclosed buyer. Black Silicon Holdings, Inc. owns a profit interest in the undisclosed buyer.
(13)Produced Water Absorbents, Inc., also does business as ProSep, Inc.
(14)The Company's senior secured debt security of Produced Water Absorbents, Inc., matured on December 31, 2019, but was not repaid. The Company has agreed to extend the maturity date of the secured debt security and an agreement is in process. The repayment of the debt is uncertain.
(15)The Company is the Investment Manager and Managing Member of 180.2 SPV Series - a Series of 180 Degree Capital Management, LLC that owns 1,241,400 shares, or 3.2 percent of the voting securities, of Synacor, Inc. ("SYNC"). When combined with the Company's ownership of 4.4 percent of the voting securities of SYNC, the Company controls 7.6 percent of the voting securities of SYNC, based on 39,449,337 shares reported in SYNC's most recent Securities and Exchange Commission ("SEC") filing, Form 10-Q, as of March 31, 2020.
(16)The stock options and restricted stock units were issued to Kevin Rendino for service on the Board of Directors of SYNC. Mr. Rendino entered into an assignment and assumption agreement with the Company that transfers all beneficial and voting interest to the Company.
(17)Other financial instruments are holdings of the Company that do not meet the definition of a security or a derivative.
(18)If all the remaining milestones are met, we would receive $5,384,482. There can be no assurance as to how much of these amounts we will ultimately realize or when they will be realized, if at all.
(19)If all the remaining milestones are met, we would receive $80,603,393. There can be no assurance as to how much of these amounts we will ultimately realize or when they will be realized, if at all.
(20)In October 2017, Xenio Systems, Inc., merged with Xenio Holdings, Inc. In conjunction with this merger, all common stock of Xenio Systems, Inc., was canceled and shareholders were granted a right to a future payment in the event of a sale of Xenio Holdings, Inc. The maximum amount we could receive from such payments is approximately $11,100. There can be no assurance as to how much of these amounts we will ultimately realize or when they will be realized, if at all.
The accompanying unaudited notes are an integral part of this unaudited consolidated financial statements.
23
180 DEGREE CAPITAL CORP.
NOTES TO CONSOLIDATED FINANCIAL STATEMENTS
(UNAUDITED)
NOTE 1. THE COMPANY
180 Degree Capital Corp. (f/k/a Harris & Harris Group, Inc.) (the "Company," "us," "our" and "we"), withdrew its election to be treated as a business development company on March 30, 2017, and subsequently returned to its prior status as a registered non-diversified closed-end management investment company ("Closed-End Fund" or "CEF") under the Investment Company Act of 1940 (the "1940 Act"). We operate as an internally managed investment company whereby our officers and employees, under the general supervision of our Board of Directors, conduct our operations. As of May 22, 2020, we are also registered with the Securities and Exchange Commission as a Registered Investment Adviser under the Investment Advisers Act of 1940.
H&H Ventures Management, Inc.SM ("Ventures") is a 100 percent owned subsidiary of the Company. Ventures is taxed under Subchapter C (a "C Corporation") of the Internal Revenue Code of 1986 (the "Code"). Harris Partners I, L.P, is a limited partnership and, from time to time, may be used to hold certain interests in our portfolio companies. The partners of Harris Partners I, L.P., are Ventures (sole general partner) and the Company (sole limited partner). Ventures pays taxes on income generated by its operations as well as on any non-passive investment income generated by Harris Partners I, L.P. For the period ended June 30, 2020, there was no non-passive investment income generated by Harris Partners I, L.P. Ventures, as the sole general partner, consolidates Harris Partners I, L.P. The Company consolidates Ventures for financial reporting purposes.
The Company is the Managing Member of 180 Degree Capital Management, LLC ("180CM"), a limited liability company formed to facilitate the opportunity for interested investors to co-invest alongside the Company in individual publicly traded portfolio companies. As of June 30, 2020, the Company had $2.2 million in capital under management in 180.2 SPV Series ("180.2 SPV"), a series of 180CM. The Company raised $3.85 million in capital under management in TheStreet SPV Series ("TST SPV"), a series of 180CM in November 2017. Substantially all of this capital and the gains from investment were distributed to investors in TST SPV in 2019, with the remainder distributed following the dissolution of the entity in March 2020.
The Company is the General Partner of 180 Phoenix Fund, L.P. ("180 Phoenix"), a limited partnership formed to facilitate management of a fund that was formed to co-invest alongside the Company in its publicly traded companies on an on-going basis. As of June 30, 2020, 180 Phoenix did not have any capital under management.
The Company is also the Managing Member of H&H Co-Investment Partners, LLC, a limited liability company formed to facilitate the opportunity for interested investors to co-invest alongside the Company in its private portfolio companies. As of June 30, 2020, H&H Co-Investment Partners did not have any capital under management.
As of June 30, 2020, the Company managed approximately $25 million in a separately managed account.
The Company may, in certain cases, receive management fees and carried interest on profits generated on invested capital from any capital under management if and when capital is raised and if and when profits are realized, respectively. The Company does not consolidate the operations of any capital managed in separate series of 180CM, or in the separately managed account and it does not expect to consolidate the operations of any capital managed in separate series of H&H Co-Investment Partners or 180 Phoenix if and when either entity has capital under management.
180 Degree Capital BD, LLC ("180BD") is a 100 percent owned subsidiary of the Company. 180BD was formed to provide services to the Company related to fundraising for co-investment funds and not for investment returns. 180BD is a registered broker-dealer with the Financial Industry Regulatory Authority ("FINRA"). The Company consolidates 180BD for financial reporting purposes. 180BD is currently a disregarded entity for tax purposes under the Code.
NOTE 2. SUMMARY OF SIGNIFICANT ACCOUNTING POLICIES
The following is a summary of significant accounting policies followed in the preparation of the consolidated financial statements:
Principles of Consolidation. The consolidated financial statements have been prepared in accordance with accounting principles generally accepted in the US ("GAAP") and Articles 6 and 12 of Regulation S-X of the SEC and include the accounts of the Company and its wholly owned subsidiaries. The Company is an investment company following accounting and reporting guidance in Accounting Standards Codification 946. In accordance with GAAP and Regulation S-X under 17 C.F.R. Part 210, the Company may only consolidate its interests in investment company subsidiaries and controlled operating companies whose business consists of providing services to the Company. Our wholly owned subsidiaries, Ventures and 180BD, are controlled operating companies that provide services to us and are, therefore, consolidated. All significant intercompany accounts and transactions have been eliminated in the consolidation.
Use of Estimates. The preparation of the consolidated financial statements in conformity with GAAP requires management to make estimates and assumptions that affect the reported amounts of assets and liabilities and contingent assets and liabilities and the reported amounts of revenues and expenses. Actual results could differ from these estimates, and the differences could be material. The most significant estimates relate to the fair valuations of our investments.
Portfolio Investment Valuations. Investments are stated at "value" as defined in the 1940 Act and in the applicable regulations of the SEC and in accordance with GAAP. Value, as defined in Section 2(a)(41) of the 1940 Act, is (i) the market price for those securities for which a market quotation is readily available and (ii) the fair value as determined in good faith by, or under the direction of, the Board of Directors for all other assets. The Valuation Committee, comprised of all of the independent Board members, is responsible for determining the valuation of the Company’s assets within the guidelines established by the Board of Directors. The Valuation Committee receives information and recommendations from management. An independent valuation firm also reviews select portfolio company valuations. The independent valuation firm does not provide independent valuations. The fair values assigned to these investments are based on available information and do not necessarily represent amounts that might ultimately be realized when that investment is sold, as such amounts depend on future circumstances and cannot reasonably be determined until the individual investments are actually liquidated or become readily marketable. The Valuation Committee values the Company's investment assets as of the end of each calendar quarter and as of any other time requested by the Board of Directors.
Accounting Standards Codification Topic 820, "Fair Value Measurements," ("ASC 820") defines fair value as the price that would be received to sell an asset or paid to transfer a liability in an orderly transaction between market participants at the measurement date (exit price). It applies fair value terminology to all valuations whereas the 1940 Act applies market value terminology to readily marketable assets and fair value terminology to other assets.
The main approaches to measuring fair value utilized are the market approach, the income approach and the hybrid approach.
•Market Approach (M): The market approach focuses on inputs and not techniques. The market approach may use quantitative inputs such as prices and other relevant information generated by market transactions involving identical or comparable assets or liabilities and the values of market multiples derived from a set of comparable companies. The market approach may also use qualitative inputs such as progress toward milestones, the long-term potential of the business, current and future financing requirements and the rights and preferences of certain securities versus those of other securities. The selection of the relevant inputs used to derive value under the market approach requires judgment considering factors specific to the significance and relevance of each input to deriving value.
•Income Approach (I): The income approach focuses on techniques and not inputs. The income approach uses valuation techniques to convert future amounts (for example, revenue, cash flows or earnings) to a single present value amount (discounted). The measurement is based on the value indicated by current market expectations about those future amounts. Those valuation techniques include present value techniques; option-pricing models, such as the Black-Scholes-Merton formula (a closed-form model) and a binomial model (a lattice model), which incorporate present value techniques; and the multi-period excess earnings method, which is used to measure the fair value of certain assets.
•Hybrid Approach (H): The hybrid approach uses elements of both the market approach and the income approach. The hybrid approach calculates values using the market and income approach, individually. The resulting values are then distributed among the share classes based on probability of exit outcomes.
ASC Topic 820 classifies the inputs used to measure fair value by these approaches into the following hierarchy:
•Level 1 (L1): Unadjusted quoted prices in active markets for identical assets or liabilities;
•Level 2 (L2): Inputs other than quoted prices included within Level 1 that are observable for the asset or liability, either directly or indirectly. These include quoted prices in active markets for similar assets or liabilities, or quoted prices for identical or similar assets or liabilities in markets that are not active, or inputs other than quoted prices that are observable for the asset or liability, either directly or indirectly, for substantially the full term of the financial instrument. Level 2 inputs are in those markets for which there are few transactions, the prices are not current, little public information exists or instances where prices vary substantially over time or among brokered market makers; and
•Level 3 (L3): Inputs to the valuation methodology are unobservable and significant to the fair value measurement. Unobservable inputs are those inputs that reflect our own assumptions that market participants would use to price the asset or liability based upon the best available information.
Financial assets and liabilities are classified in their entirety based on the lowest level of input that is significant to the fair value measurement and are not necessarily an indication of risks associated with the investment.
As of June 30, 2020, our financial statements include investments fair valued by the Board of Directors of $48,164,246. The fair values were determined in good faith by, or under the direction of, the Board of Directors. The fair value amount includes the values of our investments in privately held companies as well as our preferred stock of TheMaven, Inc., stock options and restricted stock units of Synacor, Inc., and our warrants of OpGen, Inc., which are securities of publicly traded companies, and funds held in escrow from sales of investments.
Historically, our investment in Accelerator IV-New York Corporation ("Accelerator") was accounted for under the equity method of accounting. Under the equity method of accounting, investments are carried at cost, plus or minus the Company’s equity in the increases and decreases in the investee’s net assets after the date of acquisition and certain other adjustments. The Company’s share of the net income or loss of the investee is included in "Share of loss on equity method investment" on the Company’s Consolidated Statement of Operations, for the period ended through March 31, 2020. In May 2020, the Company received distributions of $305,169 from Accelerator for its pro rata share of the distribution Accelerator received from the acquisition of Petra Pharma Corporation by an undisclosed acquirer. Under the equity method of accounting, distributions reduce the cost of the investment. The distribution amount was greater than the carrying cost of the investment, which was $180,776 at the time of distribution. The cost was reduced to $0 and dividend was recorded for the excess over the carrying cost. In addition to the distribution, the Company has the potential to receive an additional $6,252,754 in potential future milestone payments from the acquisition through its ownership in Accelerator, as well as $25,109 in proceeds held in escrow from the acquisition. There can be no assurance as to how much of these amounts we will ultimately realize or when they will be realized, if at all. As a result of this transaction, the investment is fair valued by the Company's Board of Directors, under the income approach as of this reporting period. There are no investments currently being valued under the equity method of accounting.
Cash. Cash includes demand deposits. Cash is carried at cost, which approximates fair value.
Restricted Cash. At June 30, 2020, we held $11,639 in "Restricted cash", as security deposits for a sub-lease. The sub-lease agreement expired at December 31, 2019. These funds are not considered part of operating cash of the Company and are payable to the sub-lease tenant. As of June 30, 2020, the Company remitted $30,000 to the sub-lease tenant. The balance of Restricted cash will be remitted to the sub-lease tenant once the Company receives its own security deposit from the landlord.
Unaffiliated Rights to Payments. At June 30, 2020, the outstanding potential milestone payments from Amgen, Inc.’s acquisition of BioVex Group, Inc., were valued at $1,816,050. At June 30, 2020, the outstanding potential milestone payments from the acquisition of Petra Pharma Corporation by an undisclosed acquirer were valued at $5,903,956. At June 30, 2020, the outstanding potential rights to payments from Xenio Holdings, Inc.'s merger with Xenio Systems, Inc. were valued at $0. The milestone payments are valued using the probability-adjusted, present value of proceeds from future payments that would be due upon successful completion of certain regulatory and sales milestones. There can be no assurance as to how much of these amounts we will ultimately realize or when they will be realized, if at all.
Funds Held in Escrow from Sale of Investments. At June 30, 2020, there were funds held in escrow valued at $161,249, relating to the acquisition of Petra Pharma Corporation by an undisclosed acquirer.
Prepaid Expenses. We include prepaid insurance premiums and deferred financing charges in "Prepaid expenses." Prepaid insurance premiums are recognized over the term of the insurance contract and are included in "Insurance" in the Company's Consolidated Statement of Operations.
Property and Equipment. Property and equipment are included in "Other assets" and are carried at $20,605 at June 30, 2020, representing cost of $211,477, less accumulated depreciation of $190,872. Depreciation is provided using the straight-line method over the estimated useful lives of the property and equipment. We estimate the useful lives to be five to ten years for furniture and fixtures, and three years for computer equipment.
Post-Retirement Plan Liabilities. Until it was terminated on April 27, 2017, the Company provided a Retiree Medical Benefit Plan for employees who met certain eligibility requirements. Until it was terminated on May 5, 2011, the Company also provided an Executive Mandatory Retirement Benefit Plan for certain individuals employed by us in a bona fide executive or high policy-making position. The net periodic post-retirement benefit cost includes service cost and interest on the accumulated post-retirement benefit obligation. Unrecognized actuarial gains and losses are recognized as net periodic benefit cost, pursuant to the Company's historical accounting policy in "Salaries, bonus and benefits" in the Company's Consolidated Statement of Operations. The impact of plan amendments was amortized over the employee's average service period as a reduction of net periodic benefit cost. Unamortized prior service cost was fully amortized during 2017 as a result of the termination of the Retiree Medical Benefit Plan.
Interest Income Recognition. Interest income, including amortization of premium and accretion of discount, is recorded on an accrual basis. When accrued interest is determined not to be recoverable, the Company ceases accruing interest and writes off any previously accrued interest. Write-offs are netted in interest income. During the period ended June 30, 2020, the Company had interest income of $1,995 in cash interest on secured and unsecured convertible bridge notes. During the period ended June 30, 2020, the Company recorded, on a net basis, $33,672 of bridge note payment-in-kind ("PIK") interest. Securities are deemed to be non-income producing if investments have not paid dividends or interest within the last 12 months or are on non-accrual status for at least 12 consecutive months.
When the fair value of a security that includes PIK interest is less than the accrued interest, the Company may place the security on non-accrued status. Starting April 1, 2018 and through June 30, 2020, Black Silicon Holdings, Inc. is on non-accrued status. As of June 30, 2020, had interest been accrued an additional $51,706 in income would have been included in "Non-controlled affiliated companies-PIK" in the Company's Consolidated Statement of Operations. Starting July 1, 2018 and through December 31, 2020, Produced Water Absorbents, Inc. ("PWA") is on non-accrued status. The senior secured debt issued by PWA to the Company matured on December 31, 2020, but principal and interest were not repaid. The Company and the other holder of the debt security have agreed to extend the maturity date of the debt security and an agreement is in process. The timing of repayment of the debt and the amount realized, if any, however, remains uncertain.
Fee Income for Providing Managerial Assistance to Portfolio Companies. During the period ended June 30, 2020, the Company earned $26,895 in non-cash income, owing to certain of its employees providing managerial assistance to and/or as members of the board of directors of Synacor, Inc. The Company recognizes revenues from fee income for providing managerial assistance as those services are provided.
Management Fee Income and Carried Interest from Managed Funds. As of June 30, 2020, the Company manages $2.2 million of external capital as the investment manager of 180.2 SPV. The Company receives management fee income for its services as investment manager and calculated based on the investment management agreement between the Company and 180.2 SPV. Management fee income is earned and accrued from the date of inception of 180.2 SPV through the date of liquidation of 180.2 SPV. The management fee income will be paid to the Company upon liquidation of 180.2 SPV regardless of the performance.
The inception to date accrued but not collected management fee income from 180.2 SPV for the period ended June 30, 2020, were $58,793 and is recorded in "Receivable from portfolio companies and managed funds" in the Company's Consolidated Statement of Assets and Liabilities. Management fee income for the period ended June 30, 2020, for 180.2 SPV is $12,301. Management fee income from 180.2 SPV for the period ended June 30, 2020, is recorded in "Management fee income" in the Company's Consolidated Statement of Operations.
As Managing Member of 180.2 SPV, the Company is entitled to receive carried interest on realized profits generated on the managed capital and calculated based on the investment management agreement between the Company and 180.2 SPV. The Company does not include accruals for carried interest in the Consolidated Financial Statements until such carried interest is received and/or the Company concludes that it is probable that a reversal of any accrual will not occur.
The Company received and recognized $4,640 in carried interest from TST SPV during the period ended June 30, 2020, as a result of a realized gain from distributions from TheStreet, Inc. in March 2020, which is recorded in "Carried interest" in the Company's Consolidated Statement of Operations.
Other Income. The Company may purchase restricted securities issued by publicly traded companies that include provisions that provide for payment of partial liquidated damages in the event the issuer does not meet obligations specified in the purchase agreement or other ancillary documents associated with the transaction. These obligations most commonly are associated with the filing of registration statements and/or being up to date with the filing of the issuer's financial statements with the SEC. As of June 30, 2020, the Company is due $595,160 in partial liquidated damages from TheMaven, Inc., one of its publicly traded portfolio companies, as a result of the delay in filing of registration statements related to the Company's shares of Series H and Series I Convertible Preferred Stock and from the delay in filing of up-to-date financial information with the SEC. The amount for partial liquidated damages is recorded in "Other income" in the Company's Consolidated Statement of Operations and is included in "Receivable from portfolio companies and managed funds" in the Company's Consolidated Statement of Assets and Liabilities. The inception to date accrued but not collected amount is $701,752.
Put and Call Options. The Company may purchase options on publicly traded securities as an investment and/or with the intention of limiting its downside risk. When the Company purchases an option, an amount equal to the premium paid is recorded in the Consolidated Statements of Assets and Liabilities as an investment. The Company may also purchase an option at one price and write/sell an option at another price in a simultaneous transaction referred to as a spread. The amount of these assets is subsequently marked-to-market to reflect the current value of the options. In the event that the options are exercised, the Company would be required to deliver those shares to the counterparty. When the options expire unexercised, the Company realizes a loss on the premium paid, or the difference between the premium paid and the premium received, as applicable. Net realized loss from investments in purchased options and written options was $271,304.
Rent Expense. Our lease at 1450 Broadway, New York, New York, commenced on January 21, 2010. The lease expired on December 31, 2019. The security deposit has not been repaid and is held by the landlord as of June 30, 2020 and is included in "Other receivables" in the Company's Consolidated Statement of Assets and Liabilities."
The Company currently leases and runs daily operations in approximately 1,250 square feet of office space in Montclair, New Jersey, on a month-to-month basis. The base rent is approximately $26 per square foot. Either the Company or the landlord may terminate the lease at any time with two months' written notice to either party.
Realized Gain or Loss and Unrealized Appreciation or Depreciation of Portfolio Investments. Realized gain or loss is recognized when an investment is disposed of and is computed as the difference between the Company's cost basis in the investment at the disposition date and the net proceeds received from such disposition. Realized gain or loss on investment transactions are determined by specific identification. Unrealized appreciation or depreciation is computed as the difference between the fair value of the investment and the cost basis of such investment.
Income Taxes. As we currently intend to qualify as a Regulated Investment Company ("RIC") under Subchapter M of the Code in future years and distribute any ordinary income, the Company does not accrue for income taxes. The Company has capital loss carryforwards that can be used to offset net realized capital gains. The Company also has operating loss carryforwards that can be used to offset operating income and net realized capital gains in years when we fail to qualify as a RIC. The Company recognizes interest and penalties in income tax expense. We pay federal, state and local income taxes on behalf of our wholly owned subsidiary, Ventures, which is a C Corporation. See Note 9. Income Taxes for further discussion.
Foreign Currency Translation. The accounting records of the Company are maintained in U.S. dollars. All assets and liabilities denominated in foreign currencies are translated into U.S. dollars based on the rate of exchange of such currencies against U.S. dollars on the date of valuation. The Company does not isolate the portion of the results of operations that arises from changes in foreign currency rates on investments held on its Consolidated Statement of Operations.
Securities Transactions. Securities transactions are accounted for on the date the transaction for the purchase or sale of the securities is entered into by the Company (i.e., trade date). Securities transactions outside conventional channels, such as private transactions, are recorded as of the date the Company obtains the right to demand the securities purchased or to collect the proceeds from a sale and incurs the obligation to pay for the securities purchased or to deliver the securities sold.
Concentration of Credit Risk. The Company places its cash and cash equivalents with financial institutions and, at times, cash held in depository accounts may exceed the Federal Deposit Insurance Corporation's insured limit and is subject to the credit risk of such institutions to the extent it exceeds such limit.
Concentration of Investor Risk. As of June 30, 2020, two investors, Ariel Investments, LLC and Financial Consulate Inc., owned approximately 9.5 percent and 6.7 percent, respectively, of our outstanding shares.
Recent Accounting Pronouncements and Adoptions. On July 26, 2019, the FASB issued ASU 2019-07, "Codification Updates to SEC Sections." This ASU updates the Codification to reflect previously issued SEC final rules for Disclosure Update and Simplification and Investment Company Reporting Modernization. Other miscellaneous updates are included to update language for the Codification to the electronic Code of Federal Regulations. These updates have no material impact on the Company's Consolidated Financial Statements.
On January 16, 2020, the FASB issued ASU 2020-01, "Investments - Equity Securities (Topic 321), Investments - Equity Method and Joint Ventures (Topic 323), and Derivatives and Hedging (Topic 815)." This ASU among other things clarifies that an entity should consider observable transactions that require the entity to either apply or discontinue the equity method of accounting, for the purposes of applying the measurement alternative in accordance with Topic 321 immediately before applying or upon discontinuing the equity method. The guidance is effective for fiscal years, and interim periods within those fiscal years, beginning after December 15, 2020, with early adoption permitted. Our investment in Accelerator IV-New York Corporation which was historically accounted for under the equity method of accounting is now fair valued by the Board of Directors. The Company's invests in exchange traded and other warrants and options which are considered derivatives. This ASU is determined to have no immaterial impact on the Company's Consolidated Financial Statements, as there are no investments being accounted for using the equity method of accounting and the derivatives held by the Company are deemed immaterial and not held for hedging.
On June 16, 2016, the FASB issued ASU 2016-13, "Financial Instruments - Credit Losses (Topic 326): Measurement of Credit Losses on Financial Instruments." This ASU is intended to introduce new guidance for the accounting for credit losses on instruments within scope based on an estimate of current expected credit losses. The guidance will be effective for fiscal years, and interim periods within those fiscal years, beginning after December 15, 2019, with early adoption permitted. The Company assesses the collectibility of any interest receivables and includes such determinations in the amounts included on its Consolidated Financial Statements. All other financial instruments owned by the Company are fair valued. The Company has adopted this ASU. The disclosure changes did not have a material impact on the Company's Consolidated Financial Statements as the amounts to be disclosed have been deemed immaterial.
The FASB has an ongoing annual improvements project on ASU 2016-13 and on May 15, 2019 issued one such improvement, ASU 2019-05, "Financial Instruments-Credit Losses (Topic 326)" Targeted Transition Relief." This ASU provides entities within the scope of Subtopic 326-20, Financial Instruments-Measured at Amortized Cost, with an option to irrevocably elect the fair value option in Subtopic 825-10. These improvements have no material impact on the Company's Consolidated Financial Statements. The FASB has an ongoing annual improvements project on this ASU and on November 26, 2019 and March 9, 2020 issued such improvements, ASU 2019-11, "Codification Improvements to Topic 326, Financial Instruments-Credit Losses" and ASU 2020-03, "Codification Improvements to Financial Instruments", respectively. These ASUs, among other narrow-scope improvements, clarify guidance around how to report expected recoveries. These improvements have had no material impact on the Company's Consolidated Financial Statements.
NOTE 3. BUSINESS RISKS AND UNCERTAINTIES
Our business activities contain elements of risk. We consider the principal types of market risk to be valuation risk, diversification risk, interest rate risk and foreign currency risk. Although we are risk-seeking rather than risk-averse in our investments, we consider the management of risk to be essential to our business.
Valuation Risk
Value, as defined in Section 2(a)(41) of the 1940 Act, is (i) the market price for those securities for which market quotations are readily available and (ii) fair value as determined in good faith by, or under the direction of, the Board of Directors for all other assets. See Note 2. Summary of Significant Accounting Policies for further discussion.
We have historically invested primarily in privately held companies, the securities of which are inherently illiquid. We are currently focused on investing in what we believe are deeply undervalued microcapitalization publicly traded companies. Our publicly traded securities account for approximately 47.1 percent of the value of our portfolio of investments. Although
these companies are publicly traded, their stock may not trade at high volumes and/or we may own a significant portion of a company's outstanding stock, which may restrict our ability to sell our positions in an orderly fashion and prices at which sales can be made may be volatile and materially different than the closing prices of such positions at each financial statement date. We may also be subject to restrictions on transfer and/or other lock-up provisions after these companies complete public offerings and/or if we invest in unregistered securities of public companies. Many of our privately held and publicly traded businesses tend to not have attained profitability, and many of these businesses also lack management depth and have limited or no history of operations. Because of the speculative nature of our investments and the lack of a liquid market for and restrictions on transfers of privately held investments, there is greater risk of loss relative to traditional marketable investment securities.
Approximately 63.0 percent of our portfolio was fair valued and comprised of securities of privately held companies and rights to potential future milestone payments as well as our preferred stock of TheMaven, Inc. (a Level 2 investment), stock options and restricted stock of Synacor Inc. (a Level 3 investment and a Level 2 investment, respectively), and our warrants of OpGen, Inc. (a Level 3 investment), which are publicly traded companies, and funds held in escrow from sales of investments. Because there is typically no public or readily ascertainable market for our interests in the small privately held companies in which we invest, the valuation of the securities in that portion of our portfolio is determined in good faith by our Valuation Committee, which is comprised of all of the independent members of our Board of Directors. The values are determined in accordance with our Valuation Procedures and are subject to significant estimates and judgments. The fair value of the securities in our portfolio may differ significantly from the values that would be placed on these securities if a ready market for the securities existed. Additionally, inputs may become available after a financial statement date that could result in a material change in value at a future financial statement date from the value reported in the current financial statements. Any changes in valuation are recorded in the Company's Consolidated Statement of Operations as "Change in unrealized appreciation (depreciation) on investments." Changes in valuation of any of our investments in privately held companies from one period to another may be significant.
Diversification Risk
While we are subject to certain diversification requirements regarding the concentration of investments in any one industry or group of industries, we do not choose investments based on a strategy of diversification. We also do not rebalance the portfolio should one of our portfolio companies increase in value substantially relative to the rest of the portfolio. Therefore, the value of our portfolio may be more vulnerable to microeconomic events affecting a single sector, industry or portfolio company and to general macroeconomic events that may be unrelated to our portfolio companies. These factors may subject the value of our portfolio to greater volatility than a company that follows a diversification strategy. As of June 30, 2020 our largest 10 investments by value accounted for approximately 69 percent of the value of our investment portfolio. Our largest three investments, by value, AgBiome, LLC, TheMaven, Inc., and Quantum Corporation, accounted for approximately 17 percent, 10 percent and 8 percent, respectively, of our investment portfolio at June 30, 2020. AgBiome, LLC, is a privately held portfolio company and TheMaven, Inc. and Quantum Corporation are publicly traded companies.
Interest Rate Risk
Interest rate sensitivity refers to the change in earnings that may result from changes in the level of interest rates. We may invest in both short- and long-term U.S. government and agency securities. To the extent that we invest in short- and long-term U.S. government and agency securities, changes in interest rates result in changes in the value of these obligations that result in an increase or decrease of our net asset value. The level of interest rate risk exposure at any given point in time depends on the market environment, the expectations of future price and market movements, and the quantity and duration of long-term U.S. government and agency securities held by the Company, and it will vary from period to period.
In addition, market interest rates for high-yield corporate debt may be an input in determining value of our investments in debt securities of privately held and publicly traded companies. Significant changes in these market rates could affect the value of our debt securities as of the valuation date of measurement of value. While we do not currently have any investments in debt securities with floating interest rates, investment income in such securities should we acquire them in the future could be adversely affected by changes in interest rates.
Foreign Currency Risk
Our investments are not subject to foreign currency risk as they are all denominated in U.S. dollars. We have one investment in a company based in Canada, DWSI Holdings, Inc., however the price per share and terms of those shares are denominated in U.S. dollars.
Coronavirus (COVID-19) Pandemic
An outbreak of COVID-19 first detected in China in December 2019 has since spread globally and was declared a pandemic by the World Health Organization in March 2020. Developments that disrupt global economies and financial markets, such as the COVID-19 pandemic, may magnify factors that affect the Company's performance.
NOTE 4. FAIR VALUE OF INVESTMENTS
At June 30, 2020, our financial assets valued at fair value were categorized as follows in the fair value hierarchy:
| | | | | | | | | | | | | | | | | | | | | | | | | | |
| | | Fair Value Measurement at Reporting Date Using: | | | | | | |
Description | | Unadjusted Quoted Prices in Active Markets for Identical Assets (Level 1) | |
Significant Other Observable Inputs (Level 2) | |
Significant Unobservable Inputs (Level 3) | | June 30, 2020 |
| Privately Held Portfolio Companies: | | | | | | | | |
| Preferred Stock | | $ | 0 | | | $ | 0 | | | $ | 29,968,587 | | | $ | 29,968,587 | |
| Bridge Notes | | 0 | | | 0 | | | 983,965 | | | 983,965 | |
| Common Stock | | 0 | | | 0 | | | 1,527,443 | | | 1,527,443 | |
| Warrants | | 0 | | | 0 | | | 0 | | | 0 | |
| Senior Secured Debt | | 0 | | | 0 | | | 0 | | | 0 | |
| LLC Interests | | 0 | | | 0 | | | 125,000 | | | 125,000 | |
| | | | | | | | |
| Publicly Traded Portfolio Companies: | | | | | | | | |
| Common Stock | | $ | 28,105,498 | | | $ | 0 | | | $ | 0 | | | $ | 28,105,498 | |
| Preferred Stock | | 0 | | | 7,634,289 | | | 0 | | | 7,634,289 | |
| Warrants | | 157,095 | | | 0 | | | 27 | | | 157,122 | |
| Stock Options | | 0 | | | 0 | | | 32,299 | | | 32,299 | |
| Restricted Stock Units | | 0 | | | 11,381 | | | 0 | | | 11,381 | |
| Total Investments: | | $ | 28,262,593 | | | $ | 7,645,670 | | | $ | 32,637,321 | | | $ | 68,545,584 | |
| | | | | | | | |
| Other Financial Instruments: | | | | | | | | |
| Funds Held in Escrow from Sales of Investments | | $ | 0 | | | $ | 0 | | | $ | 161,249 | | | $ | 161,249 | |
| Rights to Payments | | 0 | | | 0 | | | 7,720,006 | | | 7,720,006 | |
| Total Financial Assets: | | $ | 28,262,593 | | | $ | 7,645,670 | | | $ | 40,518,576 | | | $ | 76,426,839 | |
Significant Unobservable Inputs
The table below presents the valuation technique and quantitative information about the significant unobservable inputs utilized by the Company in the fair value measurements of Level 3 assets. Unobservable inputs are those inputs for which little or no market data exists and, therefore, require an entity to develop its own assumptions.
| | | | | | | | | | | | | | | | | | | | | | | |
| Value as of June 30, 2020 | | Valuation Approach(es) | | Unobservable Input(s) | | Range(s) (Weighted Average(a)) |
| | | | | | | |
| | | | | Public Comparable Adjustment (Including Non-Performance Risk) | | 0.0% (0.0%) |
| | | | | Price Per Share | | $1.30 ($1.30) |
| | | | | Volatility | | 72.1% (72.1%) |
| Preferred Stock | $ | 2,683,783 | | | Hybrid Approach | | Time to Exit / Cash Flows (Years) | | 3.0 (3.0) |
| | | | | Price Per Share | | $0.21 - $6.33 ($3.45) |
| | | | | Public Comparable Adjustment (Including Non-Performance Risk) | | -84.4% - 0.8% (-23.2%) |
| | | | | Volatility | | 51.2% - 109.3% (78.6%) |
| Preferred Stock | 27,003,787 | | | Income Approach | | Time to Exit / Cash Flows (Years) | | 5.0 - 6.3 (5.0) |
| | | | | Public Comparable Adjustment (Including Non-Performance Risk) | | -25.0% (-25.0%) |
| | | | | Revenue Multiples | | 3.3 (3.3) |
| | | | | Time to Exit (Years) | | 0.8 (0.8) |
| | | | | Discount for Lack of Marketability | | 21.5% (21.5%) |
| Preferred Stock | 281,017 | | | Market Approach | | Price Per Share | | $0.68 ($0.68) |
| Bridge Notes | 50,000 | | | Income Approach | | Estimated Value to Cost Ratio at Payout | | 0.00 - 1.00 (1.00) |
| | | | | Revenue Multiples | | 3.3 (3.3) |
| | | | | Time to Exit (Years) | | 0.8 (0.8) |
| | | | | Discount for Lack of Marketability | | 21.5% (21.5%) |
| Bridge Notes | 933,965 | | | Market Approach | | Estimated Value to Cost Ratio at Conversion | | 1.00 (1.00) |
| | | | | Probability of Achieving Independent Milestones | | 3.4%-75.0% (46.7%) |
| | | | | Probability of Achieving Dependent Milestones | | 0.0%-14.1% (1.6%) |
| | | | | Public Comparable Adjustment (Including Non-Performance Risk) | | -50.0% - 0.0% (0.0%) |
| | | | | Volatility | | 78.6% - 109.3% (93.6%) |
| | | | | Time to Exit (Years) | | 5.0 - 13.4 (9.0) |
| Common Stock | 1,424,052 | | | Income Approach | | Price Per Share | | $0.21 - $1.00 ($0.76) |
| | | | | Volatility | | 104.3% (104.3%) |
| | | | | Revenue Multiples | | 1.1 (1.1) |
| | | | | Time to Exit (Years) | | 1.5 (1.5) |
| Common Stock | 103,391 | | | Market Approach | | Discount for Lack of Marketability | | 25.7% (25.7%) |
| | | | | Price Per Share | | $0.00 - $2.04 ($2.04) |
| | | | | Volatility | | 155.5% (155.5%) |
| Warrants | 27 | | | Income Approach | | Time to Exit (Years) | | 4.6 (4.6) |
| Warrants | 0 | | | Market Approach | | Price Per Share | | $0.00 ($0.00) |
| | | | | Revenue Multiple | | 1.1x (1.1x) |
| | | | | Exit Date | | 1.5 (1.5) |
| | | | | Volatility Rate | | 104.3% (104.3%) |
| Senior Secured Debt | 0 | | | Market Approach | | Discount for Lack of Marketability | | 25.7% (25.7%) |
| LLC Interests | 125,000 | | | Market Approach | | Bid/Ask | | $50,000-$250,000 ($150,000) |
| | | | | | | |
| | | | | | | | | | | | | | | | | | | | | | | |
| Value as of June 30, 2020 | | Valuation Approach(es) | | Unobservable Input(s) | | Range(s) (Weighted Average(a)) |
| | | | | Discount for Lack of Marketability | | 11.4% (11.4%) |
| | | | | Volatility | | 54.6% (54.6%) |
| Stock Options | $ | 32,299 | | | Income Approach | | Time to Exit (Years) | | 8.7 - 8.9 (8.7) |
| | | | | Probability of Achieving Independent Milestones | | 0.0% - 75.0% (52.7%) |
| | | | | Probability of Achieving Dependent Milestones | | 0.0% - 56.3% (11.0%) |
| Rights to Payments | 7,720,006 | | | Income Approach | | Time to Cash Flows (Years) | | 0.5 - 22.5 (13.1) |
| | | | | Probability of Receiving Full Payout Upon Expiration of Escrow Period | | 50% (50%) |
| Funds Held in Escrow from Sales of Investments | $ | 161,249 | | | Income Approach | | Time to Cash Flows (Years) | | 0.9 (0.9) |
| Total | $ | 40,518,576 | | | | | | | |
(a) Weighted average based on fair value at June 30, 2020.
Valuation Methodologies and Inputs for Level 3 Assets
The following sections describe the valuation techniques and significant unobservable inputs used to measure Level 3 assets.
Preferred Stock, Preferred Units, LLC Interests, Bridge Notes and Common Stock
Preferred stock, preferred units, LLC interests, bridge notes and common stock are valued by either a market, income or hybrid approach using internal models with inputs, most of which are not market observable. Common inputs for valuing Level 3 investments include prices from recently executed private transactions in a company’s securities or unconditional firm offers, revenue multiples of comparable publicly traded companies, merger and acquisition ("M&A") transactions consummated by comparable companies, discounts for lack of marketability, rights and preferences of the class of securities we own as compared with other classes of securities the portfolio company has issued, particularly related to potential liquidity scenarios of an initial public offering ("IPO") or an acquisition transaction, estimated time to exit, volatilities of comparable publicly traded companies and management’s best estimate of risk attributable to non-performance risk. Certain securities are valued using the present value of future cash flows.
We may also consider changes in market values for sets of comparable companies when recent private transaction information is not available and/or in consideration of non-performance risk. We define non-performance risk as the risk that the price per share (or implied valuation of a portfolio company) or the effective yield of a debt security of a portfolio company, as applicable, does not appropriately represent the risk that a portfolio company with negative cash flow will be: (a) unable to raise capital, will need to be shut down and will not return our invested capital; or (b) able to raise capital, but at a valuation significantly lower than the implied post-money valuation of the last round of financing. We assess non-performance risk for each private portfolio company quarterly. Our assessment of non-performance risk typically includes an evaluation of the financial condition and operating results of the company, the company's progress towards milestones, and the long-term potential of the business and technology of the company and how this potential may or may not affect the value of the shares owned by us. An increase to the non-performance risk or a decrease in the private offering price of a future round of financing from that of the most recent round would result in a lower fair value measurement and/or a change in the distribution of value among the classes of securities we own.
Option pricing models place a high weighting on liquidation preferences, which means that small differences in how the preferences are structured can have a material effect on the fair value of our securities at the time of valuation and also on future valuations should additional rounds of financing occur with senior preferences. As such, valuations calculated by option pricing models may not increase if 1) rounds of financing occur at higher prices per share, 2) liquidation preferences include multiples on investment, 3) the amount of invested capital is small and/or 4) liquidation preferences are senior to prior rounds of financing. Additionally, an increase in the volatility assumption generally increases the enterprise value calculated in an
option pricing model. An increase in the time to exit assumption also generally increases the enterprise value calculated in an option pricing model. Variations in the expected time to exit or expected volatility assumptions have a significant impact on fair value.
Bridge notes commonly contain terms that provide for the conversion of the full amount of principal, and sometimes interest, into shares of preferred stock at a defined price per share and/or the price per share of the next round of financing. The use of a discount for non-performance risk in the valuation of bridge notes would indicate the potential for conversion of only a portion of the principal, plus interest when applicable, into shares of preferred stock or the potential that a conversion event will not occur and that the likely outcome of a liquidation of assets would result in payment of less than the remaining principal outstanding of the note. An increase in non-performance risk would result in a lower fair value measurement.
Warrants and Stock Options
We use the Black-Scholes-Merton option-pricing model to determine the fair value of warrants and stock options held in our portfolio unless there is a publicly traded active market for such warrants and options or another indication of value such as a sale of the portfolio company. Option pricing models, including the Black-Scholes-Merton model, require the use of subjective input assumptions, including expected volatility, expected life, expected dividend rate, and expected risk-free rate of return. In the Black-Scholes-Merton model, variations in the expected volatility or expected term assumptions have a significant impact on fair value. Because certain securities underlying the warrants in our portfolio are not publicly traded, many of the required input assumptions are more difficult to estimate than they would be if a public market for the underlying securities existed.
An input to the Black-Scholes-Merton option-pricing model is the value per share of the type of stock for which the warrant is exercisable as of the date of valuation. This input is derived according to the methodologies discussed in "Preferred Stock, Preferred Units, LLC Interests, Bridge Notes and Common Stock."
Rights to Payments and Escrows
Rights to payments and escrows are valued using a probability-weighted discounted cash flow model. As part of Amgen Inc.’s acquisition of our former portfolio company, BioVex Group, Inc., we are entitled to potential future milestone payments based upon the achievement of certain regulatory and sales milestones. We are also entitled to future payments from Xenio Holdings, Inc., which merged with one of our former portfolio companies, Xenio Systems, Inc., in the event of a sale of Xenio Holdings, Inc. We are also entitled to future payments from the acquisition of Petra Pharma Corporation by an undisclosed acquirer. We assign probabilities to the achievements of the various milestones. Milestones identified as independent milestones can be achieved irrespective of the achievement of other contractual milestones. Dependent milestones are those that can only be achieved after another, or series of other, milestones are achieved. The interest rates used in these models are observable inputs from sources such as the published interest rates for corporate bonds of the acquiring or comparable companies.
Senior Secured Debt
We currently hold investments in senior secured debt securities. We value these securities either by an income or market approach. The income approach uses valuation techniques to convert future amounts (for example, cash flows or earnings) to a single present value amount (discounted). The measurement is based on the value indicated by current market expectations about those future amounts. Common inputs for valuing Level 3 debt investments include: the effective yield of the debt investment or, in the case where we have received warrant coverage, the warrant-adjusted effective yield of the security, adjustments for changes in the yields of comparable publicly traded high-yield debt funds and risk-free interest rates and an assessment of non-performance risk. For debt investments valued by the income approach, an increase in yields would result in a lower fair value measurement. Furthermore, yields would decrease, and value would increase, if the company is exceeding targets and risk has been substantially reduced from the level of risk that existed at the time of investment. Yields would increase, and values would decrease, if the company is failing to meet its targets and risk has been increased from the level of risk that existed at the time of investment. The market approach distributes an estimated value of the entity through the liquidation waterfall to derive value. Common inputs for valuing by the market approach include: multiples of publicly traded comparable companies, time to expected return/exit, discounts for lack of marketability and probability weighted expected return models.
Changes in Valuation Approaches
During the period ended June 30, 2020, the following changes in valuation methodology occurred since December 31, 2019:
•We changed the valuation methodology of our securities of Nanosys, Inc., from the market approach to the income approach to reflect a change in the financing status of the business.
•We changed the valuation methodology of our securities of D-Wave Systems, Inc. (now DWSI Holdings, Inc.) from the market approach to the income approach owing to consummation of new financing.
•We changed the valuation methodology of Accelerator IV-New York Corporation from the equity method of accounting to the market approach.
The following chart shows the components of change in the financial assets categorized as Level 3 for the period ended June 30, 2020.
| | | | | | | | | | | | | | | | | | | | | | | | | | | | | | | | | | | | | | | | | | | | | | | |
| | Beginning
Balance
1/1/2020 | | Total
Realized
(Losses) Gains
Included in
Changes in
Net Assets | | Transfers | | Total
Unrealized
Appreciation (Depreciation)
Included in
Changes in
Net Assets | | Investments in
Portfolio
Companies,
Interest on
Bridge Notes,
and
Amortization
of Loan
Fees, Net | | Disposals
and
Settlements | | Ending
Balance
6/30/2020 | | Amount of Total
Appreciation (Depreciation) for the
period Included in
Changes in Net
Assets Attributable
to the Change in
Unrealized Gains or
Losses Relating to
Assets Still Held at
the Reporting Date |
| | | | | | | | | | | | | | | |
| Preferred Stock | $ | 42,949,793 | | | $ | 7,963,973 | | 1 | $ | 0 | | | $ | (11,086,408) | | | 0 | | | $ | (9,858,771) | | | $ | 29,968,587 | | | $ | (11,862,407) | |
| | | | | | | | | | | | | | | |
| Bridge Notes | 1,455,248 | | | 0 | | | 0 | | | 185,011 | | | 33,672 | | | (689,966) | | | 983,965 | | | (152,721) | |
| | | | | | | | | | | | | | | |
| Common Stock | 1,018,118 | | | 0 | | | 203,677 | | 2 | 405,934 | | | 103,391 | | 3 | (203,677) | | | 1,527,443 | | | 405,934 | |
| | | | | | | | | | | | | | | |
| Warrants | 3 | | | 0 | | | 0 | | | 24 | | | 0 | | | 0 | | | 27 | | | 24 | |
| | | | | | | | | | | | | | | |
| Senior Secured Debt | 0 | | | 0 | | | 0 | | | 0 | | | 0 | | | 0 | | | 0 | | | 86,222 | |
| | | | | | | | | | | | | | | |
| LLC Interests | 147,330 | | | 0 | | | 0 | | | (22,330) | | | 0 | | | 0 | | | 125,000 | | | 0 | |
| | | | | | | | | | | | | | | |
| Stock Options | 61,514 | | | 0 | | | 0 | | | (29,215) | | | 0 | | | 0 | | | 32,299 | | | (22,330) | |
| | | | | | | | | | | | | | | |
| Rights to Payments | 1,795,316 | | | 23,976 | | 1 | 0 | | | 86,222 | | | 5,859,686 | | 3 | (45,194) | | | 7,720,006 | | | (29,215) | |
| | | | | | | | | | | | | | | |
| Funds Held in Escrow from Sales of Investments | 0 | | | 609 | | | 0 | | | 0 | | | 160,640 | | 3 | 0 | | | 161,249 | | | 0 | |
| | | | | | | | | | | | | | | |
| Total | $ | 47,427,322 | | | $ | 7,988,558 | | | $ | 203,677 | | | $ | (10,460,762) | | | $ | 6,157,389 | | | $ | (10,797,608) | | | $ | 40,518,576 | | | $ | (11,574,493) | |
1 Represents gross realized gains.
2 Historically, Accelerator IV-New York Corporation ("Accelerator") was valued under the equity method of accounting. The Company received distributions for its pro rata share of the distribution received by Accelerator from the acquisition of Petra Pharma Corporation. As a result of this transaction, Accelerator is now fair valued by the Company's Board of Directors.
3 The Company received non-cash distributions of common stock, rights to milestone payments and funds held in escrow from sales of investments for its pro rata share of the proceeds from the acquisition of Petra Pharma Corporation, which are now recorded as investments of the Company..
We elected to use beginning of the year values to recognize transfers in and out of Level 3 investments, when transfers occur.
NOTE 5. INDUSTRY DIVERSIFICATION
The following table shows the percentage of our net assets invested by industry as of June 30, 2020.
| | | | | | | | | | | | | | | | | | | | | | | |
| Industry | Value as of June 30, 2020 | | % of Net Assets | | Value as of June 30, 2020 | | % of Net Assets |
| Application Software | | | | | $ | 1,988,283 | | | 2.4% |
| Unaffiliated Portfolio Companies | $ | 0 | | | 0.0% | | | | |
| Non-Controlled Affiliated Portfolio Companies | 1,988,283 | | | 2.4% | | | | |
| Controlled Affiliated Portfolio Companies | 0 | | | 0.0% | | | | |
| Asset Management & Custody Banks | | | | | 125,000 | | | 0.1% |
| Unaffiliated Portfolio Companies | 125,000 | | | 0.1% | | | | |
| Non-Controlled Affiliated Portfolio Companies | 0 | | | 0.0% | | | | |
| Controlled Affiliated Portfolio Companies | 0 | | | 0.0% | | | | |
| Biotechnology | | | | | 1,816,077 | | | 2.2% |
| Unaffiliated Portfolio Companies | 1,816,077 | | | 2.2% | | | | |
| Non-Controlled Affiliated Portfolio Companies | 0 | | | 0.0% | | | | |
| Controlled Affiliated Portfolio Companies | 0 | | | 0.0% | | | | |
| Communications Equipment | | | | | 4,510,139 | | | 5.4% |
| Unaffiliated Portfolio Companies | 4,510,139 | | | 5.4% | | | | |
| Non-Controlled Affiliated Portfolio Companies | 0 | | | 0.0% | | | | |
| Controlled Affiliated Portfolio Companies | 0 | | | 0.0% | | | | |
| Fertilizers & Agricultural Chemicals | | | | | 13,235,474 | | | 15.8% |
| Unaffiliated Portfolio Companies | 13,235,474 | | | 15.8% | | | | |
| Non-Controlled Affiliated Portfolio Companies | 0 | | | 0.0% | | | | |
| Controlled Affiliated Portfolio Companies | 0 | | | 0.0% | | | | |
| Health Care Equipment | | | | | 1,795,092 | | | 2.1% |
| Unaffiliated Portfolio Companies | 0 | | | 0.0% | | | | |
| Non-Controlled Affiliated Portfolio Companies | 1,795,092 | | | 2.1% | | | | |
| Controlled Affiliated Portfolio Companies | 0 | | | 0.0% | | | | |
| Health Care Technology | | | | | 7,996,891 | | | 9.5% |
| Unaffiliated Portfolio Companies | 0 | | | 0.0% | | | | |
| Non-Controlled Affiliated Portfolio Companies | 7,996,891 | | | 9.5% | | | | |
| Controlled Affiliated Portfolio Companies | 0 | | | 0.0% | | | | |
| Interactive Media & Services | | | | | 7,634,289 | | | 9.1% |
| Unaffiliated Portfolio Companies | 0 | | | 0.0% | | | | |
| Non-Controlled Affiliated Portfolio Companies | 7,634,289 | | | 9.1% | | | | |
| Controlled Affiliated Portfolio Companies | 0 | | | 0.0% | | | | |
| Life Sciences Tools & Services | | | | | 3,060,048 | | | 3.6% |
| Unaffiliated Portfolio Companies | 0 | | | 0.0% | | | | |
| Non-Controlled Affiliated Portfolio Companies | 3,060,048 | | | 3.6% | | | | |
| Controlled Affiliated Portfolio Companies | 0 | | | 0.0% | | | | |
| Pharmaceuticals | | | | | 7,519,695 | | | 9.0% |
| Unaffiliated Portfolio Companies | 7,519,695 | | | 9.0% | | | | |
| Non-Controlled Affiliated Portfolio Companies | 0 | | | 0.0% | | | | |
| Controlled Affiliated Portfolio Companies | 0 | | | 0.0% | | | | |
| | | | | | | |
| | | | | | | | | | | | | | | | | | | | | | | |
| Industry | Value as of June 30, 2020 | | % of Net Assets | | Value as of June 30, 2020 | | % of Net Assets |
| Research & Consulting Services | | | | | $ | 960,463 | | | 1.1% |
| Unaffiliated Portfolio Companies | $ | 281,017 | | | 0.3% | | | | |
| Non-Controlled Affiliated Portfolio Companies | 679,446 | | | 0.8% | | | | |
| Controlled Affiliated Portfolio Companies | 0 | | | 0.0% | | | | |
| Restaurants | | | | | 3,395,957 | | | 4.0% |
| Unaffiliated Portfolio Companies | 0 | | | 0.0% | | | | |
| Non-Controlled Affiliated Portfolio Companies | 3,395,957 | | | 4.0% | | | | |
| Controlled Affiliated Portfolio Companies | 0 | | | 0.0% | | | | |
| Semiconductors | | | | | 263,994 | | | 0.3% |
| Unaffiliated Portfolio Companies | 0 | | | 0.0% | | | | |
| Non-Controlled Affiliated Portfolio Companies | 263,994 | | | 0.3% | | | | |
| Controlled Affiliated Portfolio Companies | 0 | | | 0.0% | | | | |
| Specialized Consumer Services | | | | | 3,132,538 | | | 3.7% |
| Unaffiliated Portfolio Companies | 3,132,538 | | | 3.7% | | | | |
| Non-Controlled Affiliated Portfolio Companies | 0 | | | 0.0% | | | | |
| Controlled Affiliated Portfolio Companies | 0 | | | 0.0% | | | | |
| Specialty Chemicals | | | | | 2,316,338 | | | 2.8% |
| Unaffiliated Portfolio Companies | 1,806,169 | | | 2.2% | | | | |
| Non-Controlled Affiliated Portfolio Companies | 510,169 | | | 0.6% | | | | |
| Controlled Affiliated Portfolio Companies | 0 | | | 0.0% | | | | |
| Technology Hardware, Storage & Peripherals | | | | | 11,812,740 | | | 14.1% |
| Unaffiliated Portfolio Companies | 7,086,191 | | | 8.5% | | | | |
| Non-Controlled Affiliated Portfolio Companies | 4,726,549 | | | 5.6% | | | | |
| Controlled Affiliated Portfolio Companies | 0 | | | 0.0% | | | | |
| Trading Companies & Distributors | | | | | 4,497,635 | | | 5.4% |
| Unaffiliated Portfolio Companies | 4,497,635 | | | 5.4% | | | | |
| Non-Controlled Affiliated Portfolio Companies | 0 | | | 0.0% | | | | |
| Controlled Affiliated Portfolio Companies | 0 | | | 0.0% | | | | |
| Undisclosed Common Stocks | | | | | 204,937 | | | 0.2% |
| Unaffiliated Portfolio Companies | 204,937 | | | 0.2% | | | | |
| Non-Controlled Affiliated Portfolio Companies | 0 | | | 0.0% | | | | |
| Controlled Affiliated Portfolio Companies | 0 | | | 0.0% | | | | |
| Total | $ | 76,265,590 | | | | | $ | 76,265,590 | | | |
NOTE 6. DERIVATIVES
The Company purchased and sold call options during the period ended June 30, 2020. A call option gives its holder the right to buy a specific security at a specific price (known as the exercise strike price) by a certain date.
Transactions in call options during the period ended June 30, 2020, were as follows:
| | | | | | | | | | | | | | |
| | Number of Contracts | | Premium |
| | | | |
| Call options outstanding as of December 31, 2019 | | 0 | | | $ | 0 | |
| Call options purchased | | (65,000) | | | (523,562) | |
| Call options written | | 65,000 | | | 252,258 | |
| Purchased call options expired | | 65,000 | | | 0 | |
| Written call options expired | | (65,000) | | | 0 | |
| Call options outstanding as of June 30, 2020 | | 0 | | | $ | (271,304) | |
The following table presents the effect of derivatives held during the period ended June 30, 2020, along with the respective location in the consolidated financial statements.
CONSOLIDATED STATEMENT OF OPERATIONS:
| | | | | | | | | | | | | | | | | | | | | | | |
| Derivatives | | Location | | Net Realized Gain (Loss) | | Net Change in Unrealized Appreciation (Depreciation) | |
| Call Options | | Net realized gain from investments | | $ | (271,304) | | | -- | |
| | | | | | | |
NOTE 7. OFFICERS' AND BOARD OF DIRECTORS' COMPENSATION
The aggregate compensation (salaries, 401(k) employer match, medical and dental benefits) paid by the Company during the period ended June 30, 2020, to its officers amounted to $672,972. In addition, and similar to prior years, the Compensation Committee had previously awarded a deferred bonus as of December 31, 2019, to certain of the Company's officers of $763,927 payable only upon achievement of certain metrics defined by the Compensation Committee over the next two years. As of December 31, 2019, a portion of the deferred bonus in the amount of $317,030 was included in accounts payable, which represented the time-elapsed portion of the deferred bonus accrued on a straight-line basis through December 31, 2019 based on each metric measurement date. This amount was reversed as of June 30, 2020, as determined by the Compensation Committee.
The aggregate compensation paid by the Company to the independent members of its Board of Directors during the period ended June 30, 2020 was $132,294.
Certain officers and directors currently and may in the future serve as members of the board of directors of our portfolio companies, including our controlled portfolio companies. These officers and directors do not receive any compensation for serving in such roles directly from the portfolio companies. Any such cash compensation paid by portfolio companies to members of their respective boards of directors is paid directly to the Company. In the case of securities-based compensation (restricted stock or stock options), the officer or director due such compensation assigns all beneficial interest, including but not limited to economic benefit and voting control, to such securities over to the Company.
NOTE 8. EMPLOYEE BENEFITS
401(k) Plan
We adopted a 401(k) Plan covering substantially all of our employees. Matching contributions to the plan are at the discretion of the Compensation Committee. For the period ended June 30, 2020, the Compensation Committee approved a 100 percent match, which amounted to approximately $55,250.
Medical Benefit Retirement Plan
We historically administered a plan to provide medical and dental insurance for retirees and their spouses who, at the time of their retirement, attained certain years of service with us and a certain age (the "Medical Benefit Retirement Plan"). On April 27, 2017, the Board of Directors terminated the plan. The termination does not affect benefits accrued by former employees who are grandfathered under the former terms of the plan, and the termination of the plan does not affect benefits accrued by certain former employees who were grandfathered under the amended terms of the plan. The Medical Benefit Retirement Plan was terminated for all other employees.
Executive Mandatory Retirement Benefit Plan
On May 5, 2011, the Board of Directors terminated the Amended and Restated Executive Mandatory Retirement Benefit Plan. Our former President accrued benefits under this plan prior to his retirement, and the termination of this plan has no impact on his accrued benefits. At June 30, 2020, we had $180,358 accrued for benefits for this former employee under the plan, which is included in "Post-retirement plan liabilities" on the Company's Consolidated Statement of Assets and Liabilities.
NOTE 9. INCOME TAXES
We filed for the 1999 tax year to elect treatment as a RIC under Subchapter M of the Code and qualified for the same treatment for the years 2000 through 2015, and in 2017. We did not qualify as a RIC under Subchapter M of the Code in 2016 and in 2018. We did not have net taxable income in 2016 and 2018, so our failure to qualify as a RIC did not result in a tax liability for the Company. We qualified as a RIC under Subchapter M of the Code in 2019. We currently intend to qualify as a RIC in 2020, but we cannot guarantee we will do so.
Under certain circumstances, even if we qualified for Subchapter M treatment for a given year, we might act in a subsequent year to ensure that we would be taxed in that subsequent year as a C Corporation, rather than as a RIC. We will fail to qualify for RIC tax treatment for a taxable year if we do not satisfy the 90 percent Income Test or Annual Distribution Requirement for such year. In the event we do not satisfy the 90 percent Income Test, the Diversification Tests or the Annual Distribution Requirement for any taxable year, we will be subject to federal tax with respect to all our taxable income, whether or not distributed. In addition to the corporate tax that would be paid by the Company, all our distributions to shareholders in that situation generally will be taxable as ordinary dividends and generally subject to up to a 30 percent withholding tax if received by a non-U.S. shareholder, although such dividends may qualify for long-term capital gain treatment as "qualified dividends" for U.S. shareholders meeting certain holding period requirements. If the aggregate values of our non-qualifying assets remain below 50 percent of total assets and no non-qualifying asset represents more than 25 percent of the total assets, we will continue to pass the Diversification Tests. Rather than selling portfolio companies that are performing well in order to pass our RIC diversification tests, we may opt instead not to qualify as a RIC. We will choose to take such action only if we believe that the result of the action will benefit the Company and our shareholders.
On April 14, 2020, D-Wave Systems, Inc. reorganized as a subsidiary of a new company, DWSI Holdings, Inc. ("DWSI"). As part of the reorganization, all of the outstanding stock of D-Wave Systems, Inc., was consolidated into a single class of preferred stock of DWSI on a one-for-one basis. DWSI then completed a 1-for-5 reverse stock split. DWSI continues to do business as D-Wave Systems. D-Wave Systems is located and is doing business primarily in Canada. We invested in D-Wave Systems, and now DWSI, through Parallel Universes, Inc., a Delaware company, which holds shares of D-Wave Systems, Inc. through a Canadian limited company, 4169841 Canada Ltd. ("CanCo"). We have rights to seek a reorganization of D-Wave Systems, Inc. upon certain events including a sale and/or an initial public offering of the company that we currently believe will enable us to use our accumulated operating and capital loss carryforwards to offset any gains from that investment. Should we decide to sell our shares of D-Wave Systems, Inc., ahead of such reorganization or if we are not able to complete such reorganization due to changes in tax laws or other factors, our returns on investment may be decreased due to taxation at the Parallel Universes, Inc. and/or CanCo entity levels. We do not currently plan to sell our shares prior to an event that would trigger our reorganization rights.
The Company's status as a RIC is irrevocable, but qualification is measured annually. Given the Company's status as a RIC and that the ability or inability to use such operating loss carryforwards depends on qualification metrics measured in each taxable year separate from prior years, the Company does not include a deferred tax asset and valuation allowance on its Consolidated Statement of Assets and Liabilities.
For federal tax purposes, the Company’s 2016 through 2018 tax years remain open for examination by the tax authorities under the normal three-year statute of limitations. Generally, for New Jersey state tax purposes, the Company’s 2015 through 2018 tax years remain open for examination by the tax authorities under a four-year statute of limitations. The Company will filed its 2019 federal and state taxes.
For the period ended June 30, 2020, the Company recorded a consolidated expense of $122 in federal, state and local income taxes.
We pay federal, state and local taxes on behalf of Ventures, which is taxed as a C Corporation.
For the period ended June 30, 2020, the Company recorded aggregate unrealized appreciation of $16,799,915, aggregate unrealized depreciation of $35,671,534 and net unrealized depreciation is $18,871,619. The aggregate book cost of investments is $95,137,209.
Post-enactment losses have no expiration date in years where we qualify as a RIC. As of December 31, 2019, we had post-enactment loss carryforwards under the provisions of the Regulated Investment Company Modernization Act of 2010 (the "Act") of $3,400,173 long term. As of December 31, 2019, we had capital losses, which were derived during years when the Company failed as a RIC, totaling $15,856,257, which may only be carried forward for 5 years.
On December 22, 2017, the Tax Cuts and Jobs Act of 2017 (the "2017 Act") was enacted, which among other changes, lowered the tax rates for corporations and how future loss carryforwards can be used against future gains. The change of the federal corporate tax rate from 35 percent to 21 percent in the 2017 Act may impact future decisions regarding the issuance of deemed dividends should the Company fail to qualify as a RIC under Subchapter M of the Code and be in a net taxable gain position on investments.
NOTE 10. COMMITMENTS AND CONTINGENCIES
As of June 30, 2020, the Company has no commitment or contingencies to invest additional capital in any of its privately held portfolio companies. Portfolio companies may seek additional capital in the future and any decision by the Company to not participate in the round of financing could result in outcomes that negatively impact the value of the Company's securities of those portfolio companies.
On March 23, 2017, we signed a month-to-month lease for approximately 1,250 square feet of office space located at 7 N. Willow Street, Suite 4B, Montclair, New Jersey. Upon an event of default, the lease provides that the landlord may terminate the lease and require us to pay all rent that would have been payable during the remainder of the lease or until the date the landlord re-enters the premises.
NOTE 11. PORTFOLIO PURCHASES AND SALES
During the period ended June 30, 2020:
| | | | | | | | | | | |
| Company | Purchases/Cost | | Sales Proceeds/Distributions |
| Adesto Technologies Corporation | $ | 0 | | | $ | 2,451,552 | |
| Alta Equipment Group, Inc. | 4,935,160 | | | 360,272 | |
| Emcore Corporation | 55,158 | | | 1,938,922 | |
| Franchise Group, Inc. | 4,500,003 | | | 3,136,029 | |
| Iteris, Inc. | 0 | | | 1,680,253 | |
| Lantronix, Inc. | 636,463 | | | 0 | |
| Mersana Therapeutics, Inc. | 0 | | | 734,820 | |
| Miscellaneous Common Stocks (1) | 806,862 | | | 361,273 | |
| OpGen, Inc. | 0 | | | 8,671 | |
| Potbelly Corporation | 1,360,800 | | | 0 | |
| Quantum Corporation | 250,713 | | | 2,132,129 | |
| Sonim Technologies, Inc. | 4,426,238 | | | 0 | |
| Synacor, Inc. (2) | 124,762 | | | 0 | |
| TheStreet, Inc. | 0 | | | 45,194 | |
| Total Public Portfolio Purchases/Sales Proceeds | $ | 17,096,159 | | | $ | 12,849,115 | |
| | | |
| Accelerator IV-New York Corporation (3) | $ | 0 | | | $ | 305,169 | |
| Petra Pharma Corporation (4) | 0 | | | 10,548,737 | |
| Revanna Pharmaceuticals, Inc. (5) | 103,391 | | | 0 | |
| Total Private Portfolio Cost and Distributions | $ | 103,391 | | | $ | 10,853,906 | |
| Total Portfolio Purchases/Cost and Sales Proceeds/Distributions | $ | 17,199,550 | | | $ | 23,703,021 | |
Note: The table above does not include transactions in short-term call options whose maturities at the time of acquisition were one year or less during the period ended June 30, 2020.
(1) Miscellaneous Common Stocks are unrestricted common stocks of publicly traded companies that the Company has not disclosed publicly.
(2) During the period ended June 30, 2020, the Company received restricted stock units from Synacor, Inc. ("SYNC") which were issued to the Company for Kevin Rendino's service on the Board of Directors of SYNC. These restricted stock units had a cost basis of $26,895 on the date the restricted stock units vested. Amounts related to restricted stock units are also presented as "Fee income for providing managerial assistance to portfolio companies-non-cash" on the Company's Consolidated Statement of Cash Flows.
(3) During the period ended June 30, 2020, the Company received distributions of $305,169 from Accelerator IV-New York Corporation ("Accelerator") which reduced carrying cost of Accelerator of $180,776 to $0. The excess amount over carrying cost was recorded as dividend.
(4) During the period ended June 30, 2020, the Company received distributions of financial instruments, valued at $6,123,717 on the date issued, for the acquisition of Petra Pharma Corporation by an undisclosed acquirer.
(5) During the period ended June 30, 2020, the Company received shares of common stock from Revanna Pharmaceuticals, Inc. as part of the consideration for the acquisition of Petra Pharma Corporation by an undisclosed acquirer. These shares of common stock had a cost basis of $103,391 on the date issued.
NOTE 12. SHARE REPURCHASE PROGRAM
On February 20, 2020, our Board reauthorized the repurchase of up to $2.5 million of the Company's common stock within a six-month period from the date of notice to investors, which notice was mailed on or about February 26, 2020. As of June 30, 2020, no repurchases had occurred.
NOTE 13. RELATED PARTY TRANSACTIONS
We have historically provided managerial assistance to some of our portfolio companies, including serving as members of the board of directors. In certain cases, we receive fees for providing such assistance. During the period ended June 30, 2020, we received fees totaling $26,895 in non-cash, included in the Company's Consolidated Statement of Operations in "Fee income for providing managerial assistance to portfolio companies."
NOTE 14. SUBSEQUENT EVENTS
The Company has evaluated subsequent events as of June 30, 2020, through the date these financial statements were issued, and include the following:
On August 10, 2020, our Board reauthorized the repurchase of up to $2.5 million of the Company's common stock within a six-month period from the date of notice to investors, which notice was mailed on or about August 17, 2020.
NOTE 15. INVESTMENTS IN AND ADVANCES TO AFFILIATES - SCHEDULE 12-14 (UNAUDITED)
| | | | | | | | | | | | | | | | | | | | | | | | | | | | | | | | | | | | | | | | | | | | | | | | | | |
| Name of Issuer | | Title of Issue or Nature of Indebtedness (A) | | Amount of Dividends or Interest Credited to Income (B) | | Net Realized Gain (Loss) | | Value as of December 31, 2019 | | Gross Additions (C) | | Gross Reductions (D) | | Net Change in Unrealized Appreciation (Depreciation) | | Value as of June 30, 2020 |
| NON-CONTROLLED AFFILIATED PRIVATELY HELD COMPANIES(E): | | | | | | | | | | | | | | | | |
| ABSMaterials, Inc. | | Series A Convertible Preferred Stock | | $ | 0 | | | $ | 0 | | | $ | 22,297 | | | $ | 767 | | | $ | 0 | | | $ | 767 | | | $ | 23,064 | |
| | Series B Convertible Preferred Stock | | 0 | | | 0 | | | 306,556 | | | 13,428 | | | 0 | | | 13,428 | | | 319,984 | |
| | Secured Convertible Bridge Note | | 4,987 | | | 0 | | | 162,134 | | | 4,987 | | | 0 | | | 0 | | | 167,121 | |
| Accelerator IV-New York Corporation | | Series A Common Stock | | $ | 0 | | | $ | 0 | | | $ | 203,677 | | | $ | 475,769 | | | $ | 0 | | | $ | 679,446 | | | $ | 679,446 | |
| Black Silicon Holdings, Inc. | | Series A Convertible Preferred Stock | | $ | 0 | | | $ | 0 | | | $ | 0 | | | $ | 0 | | | $ | 0 | | | $ | 0 | | | $ | 0 | |
| | Series A-1 Convertible Preferred Stock | | 0 | | | 0 | | | 0 | | | 0 | | | 0 | | | 0 | | | 0 | |
| | Series A-2 Convertible Preferred Stock | | 0 | | | 0 | | | 0 | | | 0 | | | 0 | | | 0 | | | 0 | |
| | Series B-1 Convertible Preferred Stock | | 0 | | | 0 | | | 0 | | | 0 | | | 0 | | | 0 | | | 0 | |
| | Series C Convertible Preferred Stock | | 0 | | | 0 | | | 0 | | | 0 | | | 0 | | | 0 | | | 0 | |
| | Secured Convertible Bridge Notes (F) | | 0 | | | 0 | | | 360,465 | | | 0 | | | (96,471) | | | (96,471) | | | 263,994 | |
| EchoPixel, Inc. | | Series Seed Convertible Preferred Stock | | $ | 0 | | | 0 | | $ | 1,369,554 | | | $ | 0 | | | $ | (359,258) | | | $ | (359,258) | | | $ | 1,010,296 | |
| | Series Seed-2 Convertible Preferred Stock | | 0 | | | 0 | | | 488,352 | | | 0 | | | (128,215) | | | (128,215) | | | 360,137 | |
| | Series A-2 Convertible Preferred Stock | | 0 | | | 0 | | | 556,486 | | | 0 | | | (131,827) | | | (131,827) | | | 424,659 | |
| Essential Health Solutions, Inc. | | Common Stock | | $ | 0 | | | $ | 0 | | | $ | 143,349 | | | $ | 0 | | | $ | (10,873) | | | $ | (10,873) | | | $ | 132,476 | |
| | Series A Convertible Preferred Stock | | 0 | | | 0 | | | 2,868,134 | | | 0 | | | (190,183) | | | (190,183) | | | 2,677,951 | |
| | Convertible Bridge Note | | 0 | | | 0 | | | 50,000 | | | 0 | | | 0 | | | 0 | | | 50,000 | |
| HALE.life Corporation | | Common Stock | | $ | 0 | | | $ | 0 | | | $ | 117,016 | | | $ | 0 | | | $ | (48,818) | | | $ | (48,818) | | | $ | 68,198 | |
| | Series Seed-1 Convertible Preferred Stock | | 0 | | | 0 | | | 1,613,660 | | | 0 | | | (516,992) | | | (516,992) | | | 1,096,668 | |
| | Series Seed-2 Convertible Preferred Stock | | 0 | | | 0 | | | 1,853,786 | | | 0 | | | (565,971) | | | (565,971) | | | 1,287,815 | |
| | | | | | | | | | | | | | | | |
| | | | | | | | | | | | | | | | | | | | | | | | | | | | | | | | | | | | | | | | | | | | | | | | | | |
| Name of Issuer | | Title of Issue or Nature of Indebtedness (A) | | Amount of Dividends or Interest Credited to Income (B) | | Net Realized Gain (Loss) | | Value as of December 31, 2019 | | Gross Additions (C) | | Gross Reductions (D) | | Net Change in Unrealized Appreciation (Depreciation) | | Value as of June 30, 2020 |
| NON-CONTROLLED AFFILIATED PRIVATELY HELD COMPANIES(E): | | | | | | | | | | | | | | | | |
| ORIG3N, Inc. | | Series 1 Convertible Preferred Stock | | $ | 0 | | | $ | 0 | | | $ | 885,200 | | | $ | 255,752 | | | $ | 0 | | | $ | 255,752 | | | $ | 1,140,952 | |
| | Series A Convertible Preferred Stock | | 0 | | | 0 | | | 1,060,501 | | | 297,050 | | | 0 | | | 297,050 | | | 1,357,551 | |
| | Series A-2 Convertible Preferred Stock | | 0 | | | 0 | | | 146,262 | | | 39,018 | | | 0 | | | 39,018 | | | 185,280 | |
| Produced Water Absorbents, Inc. | | Warrants for Common Stock | | $ | 0 | | | $ | 0 | | | $ | 0 | | | $ | 0 | | | $ | 0 | | | $ | 0 | | | $ | 0 | |
| | Common Stock | | 0 | | | 0 | | | 0 | | | 0 | | | 0 | | | 0 | | | 0 | |
| | Senior Secured Debt (G) | | 0 | | | 0 | | | 0 | | | 0 | | | 0 | | | 0 | | | 0 | |
| TARA Biosystems, Inc. | | Common Stock | | $ | 0 | | | 0 | | $ | 757,753 | | | $ | 0 | | | $ | (213,821) | | | $ | (213,821) | | | $ | 543,932 | |
| | Series A Convertible Preferred Stock | | 0 | | | 0 | | | 3,196,883 | | | 0 | | | (758,628) | | | (758,628) | | | 2,438,255 | |
| | Series A-2 Convertible Preferred Stock | | 0 | | | 0 | | | 101,062 | | | 0 | | | (23,201) | | | (23,201) | | | 77,861 | |
| Total Non-Controlled Affiliated Privately Held Companies | | | | $ | 4,987 | | | $ | 0 | | | $ | 16,263,127 | | | $ | 1,086,771 | | | $ | (3,044,258) | | | $ | (1,758,797) | | | $ | 14,305,640 | |
| NON-CONTROLLED AFFILIATED PUBLICLY TRADED SECURITIES(F): | | | | | | | | | | | | | | | | |
| Potbelly Corporation | | Common Stock | | $ | 0 | | | $ | 0 | | | $ | 4,735,047 | | | $ | 0 | | | $ | (1,339,090) | | | $ | (2,699,890) | | | $ | 3,395,957 | |
| Sonim Technologies, Inc. | | Common Stock | | $ | 0 | | | $ | 0 | | | $ | 0 | | | $ | 4,726,549 | | | $ | 0 | | | $ | 300,311 | | | $ | 4,726,549 | |
| Synacor, Inc. | | Common Stock | | $ | 0 | | | $ | 0 | | | $ | 2,450,061 | | | $ | 0 | | | $ | (505,458) | | | $ | (630,220) | | | $ | 1,944,603 | |
| | Stock Options | | 0 | | | 0 | | | 61,514 | | | 0 | | | (29,215) | | | (29,215) | | | 32,299 | |
| | Restricted Stock Units | | 0 | | | 0 | | | 14,384 | | | 0 | | | (3,003) | | | (3,003) | | | 11,381 | |
| TheMaven, Inc. | | Series H Convertible Preferred Stock | | $ | 0 | | | $ | 0 | | | $ | 2,647,689 | | | $ | 0 | | | $ | (665,773) | | | $ | (665,773) | | | $ | 1,981,916 | |
| | Series I Convertible Preferred Stock | | 0 | | | 0 | | | 6,615,833 | | | 0 | | | (1,661,587) | | | (1,661,587) | | | 4,954,246 | |
| | Series J Convertible Preferred Stock | | 0 | | | 0 | | | 896,209 | | | 0 | | | (198,082) | | | (198,082) | | | 698,127 | |
| Total Non- Controlled Affiliated Publicly Traded Securities | | | | $ | 0 | | | $ | 0 | | | $ | 17,420,737 | | | $ | 4,726,549 | | | $ | (4,402,208) | | | $ | (5,587,459) | | | $ | 17,745,078 | |
| Total Non- Controlled Affiliated Privately Held Companies and Publicly Traded Securities | | | | $ | 4,987 | | | $ | 0 | | | $ | 33,683,864 | | | $ | 5,813,320 | | | $ | (7,446,466) | | | $ | (7,346,256) | | | $ | 32,050,718 | |
(A)Common stock, warrants, membership units and, in some cases, preferred stock are generally non-income producing and restricted. The principal amount of debt and the number of shares of common and preferred stock and number of membership units are shown in the accompanying Consolidated Schedule of Investments as of June 30, 2020.
(B)Represents the total amount of interest or dividends credited/(debited) to income for the portion of the period an investment was a control or affiliate investment, as appropriate. Amounts credited to preferred or common stock represent accrued bridge note interest related to conversions that occurred during the period ended June 30, 2020.
(C)Gross additions include increases in investments resulting from new portfolio investments, paid-in-kind interest or dividends, the amortization of discounts and fees. Gross additions also include net increases in unrealized appreciation or decreases in unrealized depreciation.
(D)Gross reductions include decreases in investments resulting from principal collections related to investment repayments or sales, the amortization of premiums and acquisition costs. Gross reductions also include net increases in unrealized depreciation or decreases in unrealized appreciation.
(E)"Non-Controlled Affiliated" is defined as ownership of five percent or more, but less than 25 percent, of the voting shares of the portfolio company, or where we hold the right to appoint one or more members to the portfolio company’s board of directors, but less than 25 percent of the members of the board of directors.
(F)Debt security is on non-accrual status as of April 1, 2018 and, therefore, is considered non-income producing as of the period ended June 30, 2020.
(G)Debt security is on non-accrual status as of July 1, 2018.
| | | | | | | | | | | | | | | | | | | | | | | | | | | | | |
| Line for Schedule of Investments | Method / Level | | Primary Industry | | # of Shares Purchased/Principal | | Cost of TURN's Investment | | Valuation |
| NON-CONTROLLED AFFILIATED COMPANIES | | | | | | | | | |
| PRIVATELY HELD COMPANIES | | | | | | | | | |
| ABSMaterials, Inc. | | | Specialty Chemicals | | | | | | |
| Series A Convertible Preferred Stock (acquired 2/17/10-10/24/11) | (I) (L3) | | | | 390,000 | | | $ | 435,000 | | | $ | 23,064 | |
| Series B Convertible Preferred Stock (acquired 11/8/13-6/25/14) | (I) (L3) | | | | 1,037,751 | | | 1,217,644 | | | 319,984 | |
| Secured Convertible Bridge Note, 8% PIK, (acquired 1/20/16, maturing 12/31/20) | (M) (L3) | | | | $ | 100,000 | | | 135,595 | | | 135,595 | |
| Secured Convertible Bridge Note, 8% PIK, (acquired 3/28/17, maturing 12/31/20) | (M) (L3) | | | | $ | 25,000 | | | 31,526 | | | 31,526 | |
| | | | | | | $ | 1,819,765 | | | $ | 510,169 | |
| Accelerator IV-New York Corporation | | | Research & Consulting Services | | | | | | |
| Series A Common Stock (acquired 7/21/14-12/12/18) | (I) (L3) | | | | 833,333 | | | $ | 0 | | | $ | 679,446 | |
| Black Silicon Holdings, Inc. | | | Semiconductors | | | | | | |
| Series A Convertible Preferred Stock (acquired 8/4/15) | (M) (L3) | | | | 233,499 | | | $ | 750,000 | | | $ | 0 | |
| Series A-1 Convertible Preferred Stock (acquired 8/4/15) | (M) (L3) | | | | 2,966,667 | | | 890,000 | | | 0 | |
| Series A-2 Convertible Preferred Stock (acquired 8/4/15) | (M) (L3) | | | | 4,207,537 | | | 2,445,000 | | | 0 | |
| Series B-1 Convertible Preferred Stock (acquired 8/4/15) | (M) (L3) | | | | 1,892,836 | | | 1,169,561 | | | 0 | |
| Series C Convertible Preferred Stock (acquired 8/4/15) | (M) (L3) | | | | 1,674,030 | | | 1,171,316 | | | 0 | |
| Secured Convertible Bridge Note, 8% PIK, (acquired 8/25/16, maturing 8/4/21) | (M) (L3) | | | | $ | 1,278,453 | | | 1,444,368 | | | 263,994 | |
| | | | | | | | $ | 7,870,245 | | | $ | 263,994 | |
| EchoPixel, Inc. | | | Health Care Equipment | | | | | | |
| Series Seed Convertible Preferred Stock (acquired 6/21/13-6/30/14) | (I) (L3) | | | | 4,194,630 | | | $ | 1,250,000 | | | $ | 1,010,296 | |
| Series Seed-2 Convertible Preferred Stock (acquired 1/22/16) | (I) (L3) | | | | 1,476,668 | | | 500,000 | | | 360,137 | |
| Series A-2 Convertible Preferred Stock (acquired 3/23/17) | (I) (L3) | | | | 1,471,577 | | | 350,000 | | | 424,659 | |
| | | | | | | | $ | 2,100,000 | | | $ | 1,795,092 | |
| | | | | | | | | |
| | | | | | | | | | | | | | | | | | | | | | | | | | | | | |
| Line for Schedule of Investments | Method / Level | | Primary Industry | | # of Shares Purchased/Principal | | Cost of TURN's Investment | | Valuation |
| NON-CONTROLLED AFFILIATED COMPANIES | | | | | | | | | |
| PRIVATELY HELD COMPANIES | | | | | | | | | |
| Essential Health Solutions, Inc. | | | Health Care Technology | | | | | | |
| Common Stock (acquired 11/18/16) | (I) (L3) | | | | 200,000 | | | $ | 20 | | | $ | 132,476 | |
| Series A Convertible Preferred Stock (acquired 11/18/16) | (I) (L3) | | | | 2,750,000 | | | 2,750,000 | | | 2,677,951 | |
| Unsecured Convertible Bridge Note, 8%, (acquired 12/19/18, maturing 12/19/21) | (I) (L3) | | | | $ | 50,000 | | | 50,000 | | | 50,000 | |
| | | | | | | | $ | 2,800,020 | | | $ | 2,860,427 | |
| HALE.life Corporation | | | Health Care Technology | | | | | | |
| Common Stock (acquired 3/1/16) | (I) (L3) | | | | 1,000,000 | | | $ | 10 | | | $ | 68,198 | |
| Series Seed-1 Convertible Preferred Stock (acquired 3/28/17) | (I) (L3) | | | | 11,000,000 | | | 1,896,920 | | | 1,096,668 | |
| Series Seed-2 Convertible Preferred Stock (acquired 12/28/18) | (I) (L3) | | | | 12,083,132 | | | 2,500,000 | | | 1,287,815 | |
| | | | | | | | $ | 4,396,930 | | | $ | 2,452,681 | |
| ORIG3N, Inc. | | | Health Care Technology | | | | | | |
| Series 1 Convertible Preferred Stock (acquired 2/5/15-8/5/15) | (H) (L3) | | | | 1,195,315 | | | $ | 500,000 | | | $ | 1,140,952 | |
| Series A Convertible Preferred Stock (acquired 11/25/15-9/7/16) | (H) (L3) | | | | 1,364,666 | | | 1,500,000 | | | 1,357,551 | |
| Series A-2 Convertible Preferred Stock (acquired 5/11/17-2/8/18) | (H) (L3) | | | | 176,386 | | | 200,002 | | | 185,280 | |
| | | | | | | | $ | 2,200,002 | | | $ | 2,683,783 | |
| Produced Water Absorbents, Inc. | | | Oil & Gas Equipment & Services | | | | | | |
| Common Stock (acquired 4/30/16) | (M) (L3) | | | | 50,243,350 | | | $ | 7,670,281 | | | $ | 0 | |
| Warrants for Common Stock expiring upon liquidation event (acquired 4/30/16) | (M) (L3) | | | | 450,000 | | | 65,250 | | | 0 | |
| Senior Secured Debt, 15% commencing on 4/1/16, matured on 12/31/19 (acquired 4/1/16) | (M) (L3) | | | | $ | 2,533,766 | | | 2,533,766 | | | 0 | |
| | | | | | | | $ | 10,269,297 | | | $ | 0 | |
| TARA Biosystems, Inc. | | | Life Sciences Tools & Services | | | | | | |
| Common Stock (acquired 8/20/14) | (I) (L3) | | | | 2,000,000 | | | $ | 20 | | | $ | 543,932 | |
| Series A Convertible Preferred Stock (acquired 3/31/17) | (I) (L3) | | | | 6,878,572 | | | 2,545,493 | | | 2,438,255 | |
| Series A-2 Convertible Preferred Stock (acquired 4/18/19) | (I) (L3) | | | | 208,577 | | | 100,000 | | | 77,861 | |
| | | | | | | $ | 2,645,513 | | | $ | 3,060,048 | |
| Total Non-Controlled Affiliated Privately Held Companies (17.0%) | | | | | | | $ | 34,101,772 | | | $ | 14,305,640 | |
| | | | | | | | | |
| | | | | | | | | | | | | | | | | | | | | | | | | | | | | |
| Line for Schedule of Investments | Method / Level | | Primary Industry | | # of Shares Purchased/Principal | | Cost of TURN's Investment | | Valuation |
| NON-CONTROLLED AFFILIATED COMPANIES | | | | | | | | | |
| PUBLICLY TRADED SECURITIES | | | | | | | | | |
| Potbelly Corporation | | | Restaurants | | | | | | |
| Common Stock (acquired 6/24/19-6/1/20) | (M) (L1) | | | | 1,489,455 | | | $ | 6,195,900 | | | $ | 3,395,957 | |
| Sonim Technologies, Inc. | | | Technology Hardware, Storage & Peripherals | | | | | | |
| Common Stock (acquired 6/5/20-6/30/20) | (M) (L1) | | | | 5,901,547 | | | $ | 4,426,238 | | | $ | 4,726,549 | |
| Synacor, Inc. | | | Application Software | | | | | | |
| Common Stock (acquired 4/6/17-4/1/20) | (M) (L1) | | | | 1,720,888 | | | $ | 4,487,235 | | | $ | 1,944,603 | |
| Stock Options for Common Stock Expiring 2/28/29 (acquired 3/1/19) | (I) (L3) | | | | 50,000 | | | 0 | | | 24,607 | |
| Stock Options for Common Stock Expiring 5/16/29 (acquired 5/16/19) | (I) (L3) | | | | 15,000 | | | 0 | | | 7,692 | |
| Restricted Stock Units (acquired 2/27/20) | (M) (L2) | | | | 10,072 | | | 0 | | | 11,381 | |
| | | | | | | | $ | 4,487,235 | | | $ | 1,988,283 | |
| TheMaven, Inc. | | | Interactive Media & Services | | | | | | |
| Series H Convertible Preferred Stock (acquired 6/27/19) | (M) (L2) | | | | 1,320 | | | $ | 2,000,000 | | | $ | 1,981,916 | |
| Series I Convertible Preferred Stock (acquired 6/28/19) | (M) (L2) | | | | 5,000 | | | 5,000,000 | | | 4,954,246 | |
| Series J Convertible Preferred Stock (acquired 10/7/19) | (M) (L2) | | | | 1,000 | | | 1,000,000 | | | 698,127 | |
| | | | | | | | $ | 8,000,000 | | | $ | 7,634,289 | |
| Total Non-Controlled Affiliated Publicly Traded Securities (21.2%) | | | | | | | $ | 23,109,373 | | | $ | 17,745,078 | |
| Total Non-Controlled Affiliated Privately Held Companies and Publicly Traded Securities (38.2%) | | | | | | | $ | 57,211,145 | | | $ | 32,050,718 | |
| | | | | | | | | |
| | | | | | | | | |
Privacy Policy
We are committed to protecting your privacy. This privacy notice explains the privacy policies of 180 Degree Capital Corp. and its affiliates. This notice supersedes any other privacy notice you may have received from 180 Degree Capital Corp.
Generally, we do not receive any non-public personal information relating to our shareholders, although certain non-public personal information of our shareholders may become available to us. We maintain physical, electronic, and procedural safeguards, according to strict standards of security and confidentiality, all information we receive about you. The only information we collect from you is your name, address, and number of shares you hold. This information is used only so that we can send you annual reports and other information about us, and send you proxy statements or other information required by law. When the Company shares non-public shareholder personal information referred to above, the information is made available for limited business purposes and under controlled circumstances designed to protect our shareholders' privacy. We do not permit use of shareholder information for any non-business or marketing purpose, nor do we permit third parties to rent, sell, trade or otherwise release or disclose information to any other party.
We do not share this information with any non-affiliated third party except as described below.
•180 Degree Capital Corp. and affiliate employees. It is our policy that only our authorized employees who need to know your personal information will have access to it. Our personnel who violate our privacy policy are subject to disciplinary action.
•Service Providers. We may disclose your personal information to companies that provide services on our behalf, such as record keeping and mailing you information. These companies are required to protect your information and use it solely for the purpose for which they received it.
•Courts and Government Officials. If required by law, we may disclose your personal information in accordance with a court order or at the request of government regulators. Only that information required by law, subpoena, or court order will be disclosed.
Annual Meeting of Shareholders
The Company held its Annual Meeting of Shareholders on May 15, 2020. The following votes were cast for directors:
| | | | | | | | | | | | | | |
| For | % Voted For | Withheld | % Vote Withheld |
| Stacy R. Brandom | 26,199,403 | 96.5% | 964,162 | 3.5% |
| Kevin M. Rendino | 26,068,841 | 96.0% | 1,094,723 | 4.0% |
| Richard P. Shanley | 25,967,148 | 95.6% | 1,196,418 | 4.4% |
| Parker A. Weil | 25,967,667 | 95.6% | 1,195,898 | 4.4% |
| Daniel B. Wolfe | 26,155,618 | 96.3% | 1,007,946 | 3.7% |
The following votes were cast to approve an amendment to the Company's restated certificate of incorporation to effect a reverse stock split of the Company's common stock, by a ratio of not less than 1-for-2 and not more than 1-for-4, and a proportionate reduction in the number of authorized shares of common stock, such ratio and the implementation and the timing of such reverse stock split to be determined in the discretion of the Board of Directors of the Company:
| | | | | | | | |
| For | Against | Abstain |
| 24,834,171 | 1,989,844 | 339,551 |
| 91.4% | 7.3% | 1.3% |
The following votes were cast to ratify PricewaterhouseCoopers LLP as the Company's independent public accounting firm for the fiscal year ending December 31, 2020:
| | | | | | | | |
| For | Against | Abstain |
| 26,873,831 | 78,504 | 211,230 |
| 98.9% | 0.3% | 0.8% |
Proxy Voting
We vote proxies relating to our portfolio securities in the best interest of our shareholders. We review on a case-by-case basis each proposal submitted to a shareholder vote to determine its impact on the portfolio securities held by us. Although we generally vote against proposals that may have a negative impact on our portfolio securities, we may vote for such a proposal if there exists compelling long-term reasons to do so.
Our proxy voting decisions are made by our Portfolio Managers, who are responsible for monitoring each of our investments. To ensure that our vote is not the product of a conflict of interest, we require that: (i) anyone involved in the decision making process disclose to our Chief Compliance Officer any potential conflict that he or she is aware of and any contact that he or she has had with any interested party regarding a proxy vote; and (ii) employees involved in the decision making process or vote administration are prohibited from revealing how we intend to vote on a proposal in order to reduce any attempted influence from interested parties.
Information regarding how the Company voted proxies relating to portfolio securities during the most recent 12-month period ended June 30 is available, without charge, upon request, by calling the Company toll-free at 833-293-1769 and on the SEC's website at http://www.sec.gov.
Portfolio Holdings
The Company files its complete schedule of portfolio holdings with the SEC for the first and third quarters of each fiscal year on Form N-PORT. The Company's Forms N-PORT are available on the SEC's website at http://www.sec.gov and may be reviewed and copied at the SEC's Public Reference Room in Washington D.C. Information on the operation of the Public Reference Room may be obtained by calling 1-800-SEC-0330.
180 Degree Capital Corp.
Board of Directors
| | | | | | | | |
Stacy R. Brandom1,2,3,4 | Kevin M. Rendino6 | Richard P. Shanley1,2,3,4,5 |
Parker A. Weil1,2,3,4 | Daniel B. Wolfe | |
1. Member of Audit Committee 2. Member of Valuation Committee 3. Member of Compensation Committee
4. Member of Nominating Committee 5. Lead Independent Director 6. Chairman of the Board
Officers
| | | | | |
| Kevin M. Rendino | Chairman, Chief Executive Officer and Portfolio Manager |
| Daniel B. Wolfe | President, Chief Financial Officer, Chief Compliance Officer and Portfolio Manager |
| Alicia M. Gift | Senior Controller, Secretary and Treasurer |
| Robert E. Bigelow III | Vice President, Head of Fund Development |
7 N. Willow Street, Suite 4B
Montclair, New Jersey 07042
Phone: 973-746-4500 Fax: 973-746-4508
Website: www.180degreecapital.com Email: ir@180degreecapital.com
Counsel: Schulte Roth & Zabel LLP
Independent Registered Public Accounting Firm: PricewaterhouseCoopers LLP
Custodian of Securities: US Bank, N.A.
Transfer Agent & Registrar: American Stock Transfer & Trust Company, LLC
Stockholder Relations Department
6201 15th Avenue
Brooklyn, New York 11219
877-260-8188
Website: www.astfinancial.com Email: info@astfinancial.com
HOUSEHOLDING OPT-OUT NOTICE
To reduce expenses, we may only mail one copy of the 180 Degree Capital Corp.'s shareholder updates, such as prospectus, annual report, semi-annual report, to those addresses shared by two or more accounts. If you are not a direct shareholder (i.e., you hold your shares of us in a brokerage account), please contact your financial institution to opt out of householding. If you are a direct shareholder (i.e., you hold your shares of us at our transfer agent) and wish to receive individual copies of these documents, please call us toll-free at 833-293-1769. We will begin sending you individual copies thirty days after receiving your request.
Item 2. Code of Ethics.
Not applicable to this semi-annual report.
Item 3. Audit Committee Financial Expert.
Not applicable to this semi-annual report.
Item 4. Principal Accountant Fees and Services.
Not applicable to this semi-annual report.
Item 5. Audit Committee List of Registrants.
Not applicable to this semi-annual report.
Item 6. Investments.
(a) The schedule of investments in securities of unaffiliated issuers is included as part of the report to stockholders filed under Item 1 of this form.
(b) Not applicable.
Item 7. Disclosure of Proxy Voting Policies and Procedures for Closed-End Management Investment Companies.
Not applicable to this semi-annual report.
Item 8. Portfolio Managers of Closed-End Management Investment Companies.
Not applicable to this semi-annual report.
Item 9. Purchases of Equity Securities by Closed-End Management Investment Company and Affiliated Purchasers.
| | | | | | | | | | | | | | |
| Period 2020 | (a) Total Number of Shares Purchased | (b) Average Price Paid Per Share | (c) Total Number of Shares Purchased as Part of Publicly Announced Plans or Programs | (d) Approximate Dollar Value of Shares that May Yet Be Purchased Under the Plans or Programs |
| 01/01 - 01/31 | 0 | | 0 | | 0 | | $ | 2,500,000 | |
| 02/01 - 02/28 | 0 | | 0 | | 0 | | 2,500,000 | |
| 03/01 - 03/31 | 0 | | 0 | | 0 | | 2,500,000 | |
| 04/01 - 04/30 | 0 | | 0 | | 0 | | 2,500,000 | |
| 05/01 - 05/31 | 0 | | 0 | | 0 | | 2,500,000 | |
| 06/01 - 06/30 | 0 | | 0 | | 0 | | 2,500,000 | |
| | | | |
| Total for Period | 0 | | | 0 | | |
On February 20, 2020, our Board reauthorized the repurchase of up to $2.5 million of the Company's common stock within a six-month period from the date of notice to investors, which notice was mailed on or about February 26, 2020. As of June 30, 2020, no repurchases had occurred.
Item 10. Submission of Matters to a Vote of Shareholders.
There have been no material changes to the procedures by which shareholders may recommend nominees to the registrant's Board of Directors as set forth in the registrant's Proxy Statement, dated March 25, 2020.
Item 11. Controls and Procedures.
(a) Based on an evaluation of the Registrant's Disclosure Controls and Procedures (as defined in Rule 30a-3(c) under the Investment Company Act of 1940, the “Disclosure Controls”) as of a date within 90 days prior to the filing date (the “Filing Date”) of this Form N-CSR (the “Report”), the Chief Executive Officer (its principal executive officer) and Chief Financial Officer (its principal financial officer) have concluded that the Disclosure Controls are reasonably designed to ensure that information required to be disclosed by the Registrant in the Report is recorded, processed, summarized and reported by the Filing Date, including ensuring that information required to be disclosed in the Report is accumulated and communicated to the Registrant's management, including the Registrant's principal executive officer and principal financial officer, as appropriate to allow timely decisions regarding required disclosure.
(b) There were no changes in the Registrant’s internal control over financial reporting (as defined in Rule 30a-3(d) under the Investment Company Act of 1940) that occurred during the Registrant’s last fiscal quarter that have materially affected or are reasonably likely to materially affect the Registrant’s internal control over financial reporting.
Item 12. Disclosure of Securities Lending Activities for Closed-End Management Investment Companies.
(a) Not applicable.
(b) Not applicable.
Item 13. Exhibits.
(a)(1) The Code of Conduct is available on the Company's website at https://ir.180degreecapital.com/governance-docs.
(a)(3) Not applicable.
(a)(4) Not applicable.
SIGNATURES
Pursuant to the requirements of the Securities Exchange Act of 1934 and the Investment Company Act of 1940, the Registrant has duly caused this report to be signed on its behalf by the undersigned, thereunto duly authorized.
180 DEGREE CAPITAL CORP.
| | | | | |
| By: | /s/ Daniel B. Wolfe |
| | Name: Daniel B. Wolfe |
| | Title: President and Chief Financial Officer |
| | |
| | Date: August 10, 2020 |
Pursuant to the requirements of the Securities Exchange Act of 1934 and the Investment Company Act of 1940, this report has been signed below by the following persons on behalf of the Registrant and in the capacities and on the dates indicated.
| | | | | | | | | | | | | | |
| By: | /s/ Kevin M. Rendino | | By: | /s/ Daniel B. Wolfe |
| | Name: Kevin M. Rendino | | | Name: Daniel B. Wolfe |
| | Title: Chief Executive Officer | | | Title: President and Chief Financial Officer |
| | (Principal Executive Officer) | | | (Principal Financial Officer) |
| | | | | |
| | Date: August 10, 2020 | | | Date: August 10, 2020 |