UNITED STATES
SECURITIES AND EXCHANGE COMMISSION
Washington, D.C. 20549
FORM N-CSR
CERTIFIED SHAREHOLDER REPORT OF REGISTERED
MANAGEMENT INVESTMENT COMPANY
Investment Company Act file number 811-07074
| | |
| 180 DEGREE CAPITAL CORP. |
| (Exact Name of Registrant as Specified in Its Charter) |
| | | | | | | | |
| 7 N. Willow Street, Suite 4B, Montclair NJ | | 07042 |
| (Address of Principal Executive Offices) | | (Zip Code) |
| | |
Daniel B. Wolfe
President and Chief Financial Officer
180 Degree Capital Corp.
7 N. Willow Street, Suite 4B
Montclair, NJ 07042 |
| (Name and address of agent for service) |
|
Copy to:
John J. Mahon, Esq.
Schulte Roth & Zabel, LLP
1152 Fifteenth Street, NW
Suite 850
Washington, DC 20005
(202) 729-7477 |
Registrant's telephone number, including area code: (973) 746-4500
Date of fiscal year end: December 31
Date of reporting period: December 31, 2020
Beginning on January 1, 2021, and as permitted by a rule adopted by the Securities and Exchange Commission ("SEC"), paper copies of the shareholder reports of 180 Degree Capital Corp. (the "Company") like this one, will no longer be sent to you by mail unless you specifically request that your financial intermediary (i.e., the broker-dealer or bank through which you own your shares) or the Company, as applicable, send you paper copies. Instead, shareholder reports will be made available on a website, and you will be notified by mail each time a report is posted and you will be provided with a website link to access the report.
If you already have elected to receive shareholder reports electronically, you will not be affected by this change and need not take any action. You may elect to receive all future shareholder reports of the Company in paper free of charge. If you own shares through a financial intermediary, you may contact your financial intermediary to elect to continue to receive paper copies of your shareholder reports, or if your shares are not held by a financial intermediary, you may contact the Company's transfer agent, American Stock Transfer & Trust Company, LLC at 800-937-5449, or the Company at 833-293-1769.
Item 1. Report to Shareholders.
Fellow Shareholders,
What a year. If, in late March 2020, with the market being down over 30%, you would have told me we would have a vaccine ready for distribution by the end of 2020 and that our gross total return of cash and securities of publicly traded companies, including carried interest generated from our separately managed account, would be +17.8%1, and our net asset value per share (“NAV”) would have increased by +1.1%, I am not sure I would have believed it. I also would not have believed that in Q1 2021, we would be in discussion to invest in a newly-formed sponsor vehicle that plans to form a new special purpose acquisition company (“SPAC”) (more on that later); but we have, and we are focused on completing the investment. 2020 was like being at Coney Island; albeit without the fun. In Q2 2020, US GDP collapsed by 31% amidst a raging, deadly pandemic. Against the backdrop of over $3 trillion in COVID-relief financial aid, US GDP advanced by 33% in Q3 2020. It was a wild roller coaster of a year to say the least.
I have said as many times as anyone would listen that the 2008 subprime mortgage economic and stock market collapse was a once-in-a-generation economic Pearl Harbor. I don’t know what I think anymore. Was it really once in a generation, or did 2020 prove it was just a once-in-a-12-year event? In 2008, the S&P 500 declined by 57% from its peak to trough. US GDP declined by 2.1% in Q3 2008, 8.4% in Q4 2008, 4.4% in Q1 2009, and 0.6% in Q2 2009. Growth resumed from Q3 2009 onward. The S&P 500 did not recover to the October 2007 high until April 2013, 5.5 years later. The COVID-19 pandemic caused the S&P 500 to decline 31% in one month, only to retrace and find its all-time high just 6 months later. I don’t know which year left me with more scar tissue. The 2008 period had a far longer lasting and damaging impact on the stock market; most specifically because the financial sector, which plays a critical role in allocating credit throughout the economy, was the hardest hit. The 2020 stock market might have only sustained limited and short-lived destruction, but it came with a pandemic that has killed 440,000 of our fellow citizens and left many consumer, travel and leisure sectors in absolute tatters. I guess it is like wondering whether I would rather get hit in the head with a shovel or a bat. Navigating though both periods has had its challenges on one hand, but provided longer term opportunities on the other. That is, if one is willing to take on risk.
Risk. I apologize in advance, for I am about to take you down a diversion from the COVID-19 world we live in to talk about risk, analyzing the attribution of the benchmarks we follow, and conclude on what we think about benchmarking, indexing, etc... for TURN. During my days at BlackRock and Merrill Lynch, following the great financial crisis of 2008, and the subsequent damage done to so many client portfolios, risk departments, which quantify how much risk we have in client portfolios, took on a heightened importance in the investment process at large investment management companies. Strong risk compliance is designed to help fund managers manage the risk we take and ensure that we are operating our funds within the framework that our clients expect. Some simplistic risk analysis was designed to aid portfolio optimization. For instance, I had tools which helped show my investment portfolio’s risk relative to benchmarks of the stocks I owned (based on weightings) and the risk I was taking by not owning certain stocks that were in the index, but not in my portfolio. We also had very sophisticated interdependency studies which analyzed how sectors traded relative to each other and relative to differing economic backdrops. For example, one would think that being overweight financials in a declining interest rate environment would lead to a portfolio that outperforms the index given how well financials perform in those periods. However, at the same time, if I was underweight industrials and materials during that period, the gains I would expect from my overweighting in financials could be offset by losses in materials and industrials. Some of the risk tools were super simple. Others were incredibly cumbersome and complicated. To be clear, in total and if used properly, these tools were very valuable for aiding my ability to outperform for the funds I was managing. Risk management departments were not only essential for the institutional equity world, they were becoming prominent in the retail space as well.
I haven’t spent time talking about attribution versus the benchmark with you since I arrived at TURN, but in looking at 2020, I thought I would spend some time on it. For most of 2020, it was a have and have-not year for the market as a whole. For example, while the S&P 500 advanced 18.4% in 2020, the information technology sector was up 44%. Just alone, Apple and Alphabet represented 33% of the entire move in the S&P 500. Amazon contributed nearly 14% of the entire S&P 500 move in 2020. And yet, at the same time, energy, financials, consumer staples, healthcare, industrials, real estate and utilities were all sectors that underperformed in 2020.
_____________________
1 Past performance included throughout this letter is not an indication or guarantee of future performance. Gross unrealized and realized total returns of 180's cash and securities of publicly traded companies are compounded on a quarterly basis, and intra-quarter cash flows from investments in or proceeds received from privately held investments are treated as inflows or outflows of cash available to invest or withdrawn, respectively, for the purposes of this calculation. 180 is an internally managed registered closed end fund and does not have an external manager that is paid fees based on assets and/or returns. 180 also has a material portion of its investment portfolio in legacy privately held investments. Please see 180's filings with the SEC, including its 2020 Annual Report filed on Form N-CSR for information on its expenses and expense ratios. The carried interest from the separately managed account was accrued as of December 31, 2020, and received on February 19, 2021.
| | | | | | | | | | | |
| Vanguard S&P 500 ETF (VOO) Discretionary |
| Avg. Portfolio Weight | Sector | Contribution to Change | 2020
Total Return |
| 26.4% | Information Technology | 11.0 | 44.0% |
| 14.3% | Healthcare | 2.1 | 13.5% |
| 10.8% | Communication Services | 2.6 | 23.7% |
| 10.7% | Consumer Discretionary | 3.6 | 33.0% |
| 10.6% | Financials | (0.8) | (1.7)% |
| 8.3% | Industrials | 0.8 | 10.5% |
| 7.1% | Consumer Staples | 0.7 | 10.8% |
| 3.2% | Utilities | (0.1) | 0.5% |
| 2.8% | Energy | (1.7) | (33.6)% |
| 2.8% | Real Estate | (0.2) | (2.3)% |
| 2.6% | Materials | 0.6 | 21.0% |
Suppose you competed against this index, but you had an investment style slanted towards value and you didn’t own Apple, Amazon or Alphabet. Are you a terrible investor? Of course, you are not. But that is how you may be measured from the consulting world. In the institutional world, there is endless intense pressure to keep up with indices and buy stocks that are outperforming just because they are outperforming, not because you find them inherently undervalued. The opposite is true; institutional portfolio managers will often also avoid those parts of the market that are underperforming just because they are underperforming and they don’t want to fall behind. I will never forget the pressure I felt to keep pace in 2000 as a value manager during the dot-com bubble. I was told in 2000 by a senior member of the investment committee, that if I wanted to keep up, I needed to add Apple to my portfolio, or run the risk of underperforming and getting fired for bad performance. It was an insane conversation. Him: “You just have to buy it.” Me: “I am sorry I can’t make sense of its valuation.” Him: “Valuation has nothing to do with it. It’s a big part of the index. You are taking a big risk.” Me: “Thanks for the heads up, and the investing advice.” I might have said the last line, but that certainly wasn’t what I was thinking. The actual thoughts in my head were more or less in line with some of those choice comments Earl Weaver or Lou Pinella had for umpires they felt had made a terrible call! Fortunately, Apple didn’t find its way into my portfolio at its then price of $100. A year later, after the dot-com bubble crashed, Apple fell to $10. I actually bought it at $10, which was equal to the net cash it had on the balance sheet. The same person who thought I was crazy for not owning it at $100 literally said to me after hearing we bought it, “Wow, are you sure about that? That feels like a big risk.” I honestly couldn’t make the conversation up if I tried. Serenity now! His version of risk was only centered around risk to the benchmark. My version of risk starts with am I going to make money on this investment?
The sandbox we play in, as you know, is the Russell Microcap world and below is an attribution table for the index in 2020. The Russell Microcap Index was up 20.9% in 2020.
| | | | | | | | | | | |
| Russell Microcap Index (RMICRO) |
| Avg. Portfolio Weight | Sector | Contribution to Change | 2020
Total Return |
| 29.5% | Healthcare | 11.6 | 34.8% |
| 20.7% | Financials | (4.8) | (11.8)% |
| 11.5% | Information Technology | 5.4 | 49.4% |
| 11.3% | Industrials | 2.8 | 25.7% |
| 11.0% | Consumer Discretionary | 6.7 | 47.7% |
| 4.1% | Real Estate | (0.4) | 2.8% |
| 3.2% | Energy | (1.6) | (29.5)% |
| 3.1% | Communication Services | 0.6 | 23.8% |
| 2.6% | Materials | 0.4 | 12.9% |
| 2.0% | Consumer Staples | 0.5 | 27.8% |
| 1.2% | Utilities | (0.1) | 1.1% |
There are a couple things to point out. First, the healthcare sector represents 30% of the assets in the Russell Microcap Index, and the 35% return for the healthcare sector in 2020 contributed 55% of the total return for the index. Given our Graham and Dodd value investment focus, we do not have a significant portion of our assets invested in healthcare-related companies. In the chart below, I list the top-ten healthcare performers in the Russell Microcap Index and their corresponding valuation on an enterprise value to forward sales ratio. I am not denigrating these companies as investments or making bearish claims about them. What I am saying is that they are part of an index that we are simply not going to own from a valuation perspective. It’s not what we do.
| | | | | | | | | | | | | | | | | | | | |
| Company | Ticker | Total Return | Index Contr. To Return | Enterprise Value ($mm) | 2021 Est. Sales ($mm) | EV / Est. 2021 Sales |
| Inovio Pharmaceuticals Inc | INO | 168.2% | 0.9 | $1,199 | $16 | 74.9x |
| Novavax Inc | NVAX | 2,701.8% | 0.88 | $7,116 | $3,570 | 2.0x |
| Intellia Therapeutics Inc | NTLA | 270.8% | 0.64 | $3,090 | $45 | 68.7x |
| Owens & Minor Inc | OMI | 423.8% | 0.51 | $3,011 | $8,720 | 0.3x |
| Forty Seven Inc | FTSV | 142.6% | 0.43 | $4,244 | $2 | 2,122.0x |
| Kura Oncology Inc | KURA | 137.5% | 0.36 | $1,836 | $3 | 612.0x |
| Seres Therapeutics Inc | MCRB | 610.1% | 0.36 | $1,963 | $23 | 85.3x |
| ModivCare Inc | MODV | 134.3% | 0.35 | $1,783 | $2,048 | 0.9x |
| CryoPort Inc | CYRX | 166.6% | 0.35 | $1,649 | $199 | 8.3x |
| MacroGenics Inc | MGNX | 110.1% | 0.33 | $1,004 | $148 | 6.8x |
NOTE: FTSV EV and forward sales figures reflect acquisition by GILD completed on 04/08/2020. All other enterprise values as of December 31, 2020 with forward sales figures reflecting analyst consensus estimates as listed on Bloomberg. Actual results may be materially different.
The table below contains the sector attributions and contribution to total return for the Russell Microcap Value Index in 2020. For the year, the Russell Microcap Index was up 8.1%
| | | | | | | | | | | |
| Russell Microcap Value Index (RMICROV) |
| Avg. Portfolio Weight | Sector | Contribution to Change | Total Return |
| 34.0% | Financials | (7.5) | (13.9)% |
| 12.9% | Consumer Discretionary | 7.2 | 47.3% |
| 12.6% | Industrials | 1.4 | 3.5% |
| 12.1% | Health Care | 6.3 | 47.8% |
| 7.7% | Information Technology | 1.6 | 34.5% |
| 5.4% | Real Estate | (1.3) | (10.9)% |
| 5.2% | Energy | (2.4) | (31.3)% |
| 3.8% | Materials | 0.8 | 13.0% |
| 2.9% | Communication Services | 0.2 | 1.0% |
| 2.3% | Consumer Staples | 0.3 | 9.2% |
| 1.1% | Utilities | (0.1) | (4.4)% |
Unlike the Russell Microcap Index, where we were disadvantaged from a group of expensive stocks (as we define it) having massive share appreciation and being outsized contributors to the overall index, we had the advantage of not having a large weight in financial companies (34% of the Russell Microcap Value Index) when compared to the Russel Microcap Value Index. Subject to the safe harbor for such investments set forth in Rule 12d3-1, investment companies like TURN are limited in the amount of any company we can own that generates 15% or more of its revenues from securities-related activities, including as a broker, a dealer, an underwriter, or an investment adviser. So, were we smart not to own financials in 2020 when the group had a total return of -7.6% and represented 34% of the overall index? No. We have a structural impediment and the weighting in the index is irrelevant to how we think about investing. I do not consider us smart for having “predicted” how poorly financial companies would perform last year, thus enabling us to outperform the Russell Microcap Value Index by 1,000 basis points. Nor do I consider us “dumb” for having missed the boat on ten companies, with astronomical valuations, in the Russell Microcap Index causing us to underperform the index by 200 basis points. The relative benchmark game is riddled with these types of silly conundrums. We are not running TURN to beat an index. That’s the institutional and, becoming more and more, the retail mindset. We are focused on generating attractive absolute returns for shareholders. We look at each investment on its own merits; never once analyzing the size of the weight of that company in the index.
I started this discussion by lauding the role that good risk management tools, when used properly, can have in providing portfolio managers with capabilities designed to enhance performance of their portfolios. I also strongly believe there has been a tangible downside to the implementation of these tools, resulting in the unintended consequence of lowering returns of portfolios by forcing managers to obsess on the risks they are taking in their portfolios. To be clear, investors need to take on risk in their portfolios in order to outperform. Let me reiterate… risk is required for outperformance.
At the end of my days at BlackRock, I was becoming increasingly frustrated with the dumbing down of portfolio managers as they overanalyzed the risk they were taking in their portfolios relative to the benchmarks. The industry was rapidly moving to indexing, closet indexing of benchmarks, and overemphasizing portfolio managers during marketing efforts who had lower standards of deviation to their benchmarks. I was spending more and more time in risk meetings, more and more time explaining my risk, more and more time analyzing my risk, and less and less time analyzing the companies we were buying. Over time, and in disturbingly increasing fashion, I felt myself second guessing and questioning why I owned the stocks I owned, and questioning why I didn’t own the stocks I didn’t own. This paralysis by analysis resulted in shrinking alpha for my clients. The downside of underperforming had a greater consequence to my livelihood than did the upside of outperforming. If I outperformed, I kept my job, and if I underperformed, I lost my job. Most of us didn’t want to lose our jobs, so the industry became risk averse, especially against the backdrop of exchange traded funds (ETFs) and index funds that were outperforming active managers by significant amounts and getting all the inflows of money that was coming into the asset management business. The job I had running the Basic Value Fund, which was the only job I ever wanted, was becoming less and less interesting as the industry became more and more focused on limiting risk.
In April and May of 2012, when I was working at BlackRock, JP Morgan had an unexpected $2 billion trading loss in its London office caused by a series of bad derivative transactions in credit default swaps. JP Morgan was my biggest holding, and Jamie Dimon was my favorite CEO. I had a big bet on JP Morgan on both a relative and absolute basis. In a two-week period, the stock declined by 23%. This decline might not seem like a lot based on current volatility, but back then, in that company, it was an enormous collapse. What happens next in the investment process at a big firm was predictable (and necessary I might add). Our internal team had meetings to discuss the impact of JP Morgan on our portfolio, discuss specifically what happened, and determine what our weighting should be as a result of the new news. Do we want to own more? Do we want to own less? Is the long-term story impacted, or is it just a short-term blip? A very deliberate and thorough analysis followed.
We also needed to sit through risk meeting after risk meeting, being asked questions about the position and whether or not we understood the risk attached to the size of the position, etc. So, you know, and to be clear, these lines of questions are everything that a risk department is designed to do - ensuring portfolio managers understand the risk they are taking in individual names. On a name this widely owned, we were spending 24/7 analyzing the situation, both with our team, our clients, our internal colleagues and our risk managers. Everyone had an opinion. Differing ones for sure. After endless meetings of defending, one’s positions, you end up questioning your thesis and whether or not you are taking the appropriate risk. Even though Jamie Dimon said the losses were limited to London, maybe they weren’t. Maybe instead of $2 billion of losses, there are really $4 billion. Maybe the losses were more widespread on the trading desk for other JP Morgan departments. Here is the pushback we would get from folks that thought we should reduce our risk, “Maybe you want to reduce your risk given the news and the uncertainty. Perhaps you are taking on too much risk. Why not wait for the story to clear up and buy more then?” It is so easy to second guess yourself during stressful periods like that. It isn’t so easy to trust your gut when everyone around you is telling you, “It isn’t worth it. Go buy another bank that doesn’t have these kinds of losses.”
What was the end result? I saw many portfolio managers reduce their positions and some by a significant amount. I saw some portfolio managers maintain their holdings. I didn’t see a lot of portfolio managers increasing their positions; and that included us. What did we do? We hung on. That’s all. My gut said let’s ignore the next quarter, think about the long term, and increase our weighting. But I didn’t act on my gut. I let the weight of all the inbound pounding on our team convince me we should not take the “added risk” of buying more. I also came to the realization I didn’t want to manage money in this environment any more. I realized during that period that I could no longer invest the way I wanted to. Every day, we would talk benchmarks, standard deviation, beta, r-square, Sharpe ratio, value at risk, Sortino ratio and other risk measures. It was just too much for me. It wasn’t making me a better portfolio manager; it was making me take less risk and be a worse portfolio manager. I was second guessing every decision I made because I didn’t want to stand out like a sore thumb by talking outsized risk. The light bulb came on in my mind and I quietly told my CIO my intention to retire. I wanted to invest in a completely different manner, one in which I would define success, not for how we were positioned versus a benchmark, but how well we did providing above average returns for shareholders over a cycle. By the way, JP Morgan never saw its May 2012 low again and the stock is 4x the price it was at the bottom. This has nothing to do with BlackRock. I love the place and loved my time there. I respect my colleagues in the risk departments and the tools they provided me, and I know a proper risk management process is necessary given the complexities and the size of some of these big firms. For me, all I wanted to do was make money for our clients, and I promised myself the rest of my investment career would not be overwhelmed by benchmarks and relative analysis.
That is a lot of words, and I have already put myself to sleep, but the point for TURN is that just because 35% of the Russell Microcap Index is in healthcare names, we aren’t going to own them just because it’s in the index; especially if we consider them to be expensive with valuation levels that aren't consistent with our investment process. Similarly, but for very different reasons, just because 33% of the Russell Microcap Value Index is in financials, a structural issue for TURN means having a similar weight is not probable. Our strategy is to take significant positions in a small number of companies. We run a concentrated portfolio in an activist manner with a value discipline. We seek to ensure a healthy amount of margin for safety by being disciplined about out entry and sale prices. TURN is here for one reason. We are here to make our shareholders a competitive absolute return in our mostly long-only strategy. TURN does not seek to game the benchmark or start looking like the benchmark. I ran away from that world and I am never looking back. Judging from our performance over the past four years, I think our shareholders will continue to benefit from TURN investing in a microcap world where asymmetrical risk reward exists and where correlation to other asset classes is low.
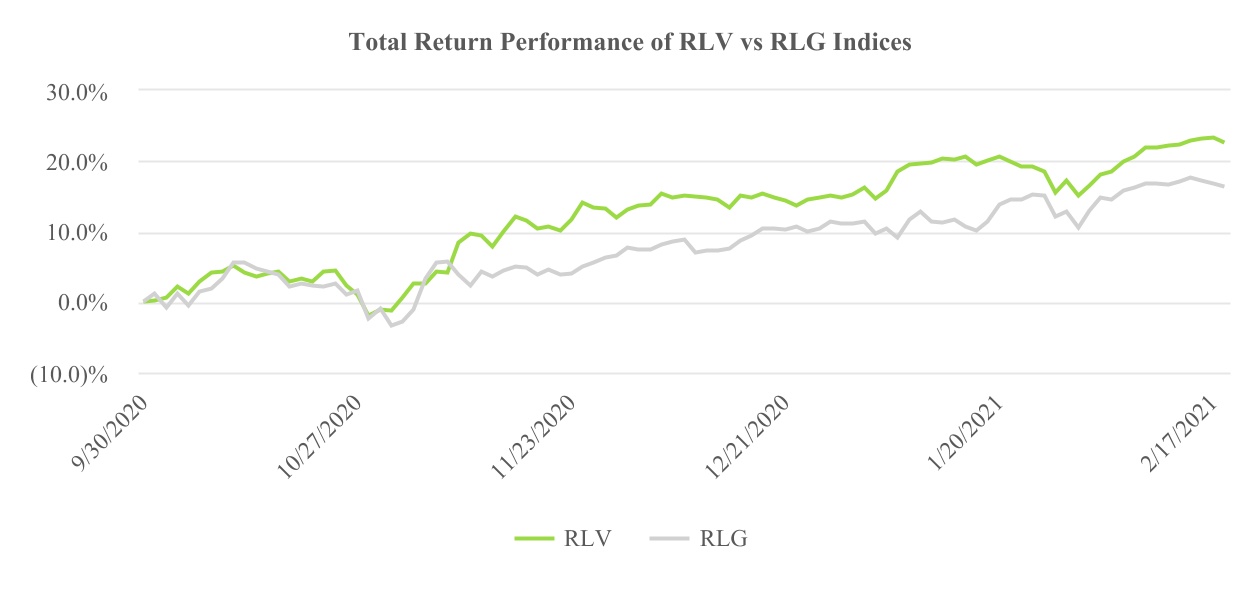
This has been a trying year. Attempting to navigate through the carnage of a global pandemic amidst a high-octane, overly emotional election cycle has been difficult enough. Doing it in the face of the biggest headwind for value fund managers I have experienced in my 32-year career has added a more complex set of obstacles. In past shareholder letters, I have written about how the pandemic and ensuing global economic meltdown exacerbated an already bifurcated stock market between the winners and the losers. Do I understand it given the pandemic? Yes. We have been clear as to what we thought would be the catalyst for the market shift from only a few stocks outperforming to a wider range of stocks participating to the upside. On November 9, 2020, Pfizer announced its coronavirus vaccine trials and suggested the vaccine was highly effective in preventing COVID-19. Moderna soon followed with its successful vaccine and the FDA moved swiftly to authorize the use of both for prevention of infection by COVID-19. As I have said for the last 6 months, this pandemic has an expiration date, and that date is when a vaccine is developed and widely available. Vaccines are here now, and I believe we are near the end of this tragic event in our world’s history. We have said that when the economic recovery takes hold, the market will expand its appetite for more than just a handful of names. That trend has already started. As you can see from the chart below, it is not just a few select growth names fueling the market. We have much better breadth of performance as investors seek to play the recovery in the economy. Since the Pfizer announcement through February 19, 2021, the SPX 500 is up 4.2%, the Russell 1000 Value Index is up 6.1%, the Russell 1000 Growth Index is up 3.8%, the Russell Microcap Index is up 27.1%, the Russell Microcap Value Index is up 21.9%, and the Russell Microcap Growth Index is up 31.9%. The market is now focusing on the recovery of the economy when the pandemic reaches its conclusion.
As I sit here on a cold, snowy winter day in February (by the way, I hate winter and it won't stop snowing!), year-to-date through February 19, 2021, our NAV has advanced more than 10% to over $10.00 as a result of net increases in the value of our public portfolio, assuming no change in our private legacy portfolio investments from the end of 2020 and normal quarterly expenses of approximately $0.07-0.08 per share per quarter.2 I continue to believe that TURN is undervalued by the public markets. Our story is set up well for value investors… including, dare I say, the WallStreetBets site and/or DeepF-Value (yes, that is the actual name of one of the Reddit authors) on the Reddit community. If I was speaking to them or any investor, I would say something like:
My name is Kevin Rendino, and I am the CEO of 180 Degree Capital Corp. (NASDAQ:TURN). I know some of you are very busy with stocks like GameStop, AMC, and Koss Industries, but I would like to suggest you spend a few minutes on TURN. We are a publicly traded closed-end fund focused primarily on investing in small micro-capitalization companies with a constructive, collegial, and collaborative approach to activism. Our business, as it is currently constructed, didn’t even exist four years ago. Prior to becoming TURN, our predecessor strategy was focused on venture capital investments primarily in very early-stage, private companies. Unfortunately, that focus did not lead to returns on investment that offset the operating expenses. After years of declining stock price and NAV, in the beginning of 2017 our Board supported making a “180 Degree” turn in strategy towards investing in the public markets, and I agreed to become the CEO of TURN.
In the five years prior to the creation of TURN, our NAV under our predecessor strategy declined by 50%. In the four years since we became TURN, we increased our NAV 32.2%, despite being hamstrung by limited resources and a private legacy portfolio that has declined in value over that same period. Leading up to the start of TURN in the first quarter of 2017, our share price under our predecessor strategy declined by 60% over the prior five years. Over the last four years since we became TURN, our share price has risen 60% from $4.14 to $6.66 as of December 31, 2020, and 71.3% to $7.09 as of February 19, 2021. We restarted our company as TURN with cash and securities of publicly traded companies of approximately $20 million. As of the end of 2020, that amount was approximately $60 million2 and as of February 19, 2021, it was approximately $73 million. Cash and securities of publicly traded companies were approximately 27% of the portfolio as of the end of 2016. As of the end of 2020, that percentage was approximately 61% and as of February 19, 2020, it is 65%. In our new strategy since the beginning of 2017, we have generated a gross total return of +17.8%, +137.6% and +265.9% from our public market investment strategy (including fees charged to managed funds and special purpose vehicles) as of December 31, 2020, over the last one year, three years, and since inception (four years), respectively.
Before our Board made the decision to forge ahead with our new strategy, I would argue that the future of our predecessor company was bleak at best. Four years later, I believe we have carved out a great niche for ourselves in the world of small-cap activism, we continue to build the scale of the business, and we have developed a strong reputation in the microcap investing universe.
__________________
2 Cash net of unsettled trades and includes carried interest receivable from separately managed account that was accrued as of December 31, 2020, and received on February 19, 2021. NAV at the end of Q1 2021 may be materially different.
If what we have done is of no use to you, would it help if TURN announced that we were setting up a cryptocurrency, automated vehicle, cannabis, lithium battery, fuel cell, renewable energy business? It will be an all-in-one business. One stop shopping!
I mention the last line of thought purely in jest as an example of the current market environment. We are Graham and Dodd value investors and will continue to be laser focused on that investment approach. That said, there is one buzzword that we can talk about and is applicable to TURN…that is, SPAC, or special purpose acquisition company. As I mentioned earlier in this letter, we have recently reached agreement to invest $2.3 million in a newly-formed sponsor vehicle that plans to form a new SPAC.3 We have worked with the founding management team in a prior investment and will be excited to share the details as events unfold over the next couple months. While this is our first investment in a SPAC sponsor vehicle, it is not likely to be our last. It is truly gratifying to see our business evolve from one that had no future to where it is today, where we have significantly grown our NAV, our stock price, and are able to take advantage of exciting investment opportunities. We have come a long way.
NET ASSET VALUE PER SHARE
Our net asset value per share (“NAV”) increased this quarter from $8.70 to $9.28. Our Fund has three principal components to the variance in our NAV: our public portfolio, our private portfolio, and our expenses. For the quarter, our public portfolio companies increased our NAV by $0.51, while our private portfolio companies increased our NAV by $0.25. Operating expenses decreased NAV by $0.18.
| | | | | | | | | | | | | | | |
| Quarter | | 1 Year | 3 Year | Inception to Date |
| Q4 2020 | | Q4 2019-Q4 2020 | Q4 2017-Q4 2020 | Q4 2016-Q4 2020 |
| | | | | |
| | | | | |
| | | | | |
| Change in NAV | 6.7% | | 1.1% | 19.0% | 32.2% |
| | | | | |
| Russell Microcap Index | 31.4% | | 20.9% | 28.8% | 45.7% |
| Russell Microcap Value Index | 33.6% | | 8.1% | 15.0% | 28.8% |
| Russell 2000 | 31.4% | | 19.9% | 33.9% | 53.5% |
Public Portfolio
In the chart below, you see our quarter to date, one-year, three-year, and inception to date performance numbers. We have often talked about our intentional concentrated structure and the fact that our performance could be episodic. We have seen that in full force in the last two quarters. For Q3 2020, we showed a gross total return for our public portfolio of +25.4%, and growth of our NAV of +7.4% versus a gross total return for the Russell Microcap Index of +3.7% and a gross total return for the Russell Microcap Value Index of +3.0%. In Q4 2020, our public portfolio gross total return was +5.3% excluding the carried interest generated from our SMA and +9.6% including the carried interest. For Q4 2020, the Russell Microcap Index advanced +31.4% and the Russell Microcap Index advanced +33.6%. For the year our +17.8% gross total return for our public portfolio including carried interest slightly underperformed the +20.9% return for the Russell Microcap Index and outperformed the +8.1% for the Russell Microcap Value Index.
__________________
3 This investment, if completed, could become worthless if no business combination occurs.
| | | | | | | | | | | | | | | |
| Quarter | | 1 Year | 3 Year | Inception to Date |
| Q4 2020 | | Q4 2019-Q4 2020 | Q4 2017-Q4 2020 | Q4 2016-Q4 2020 |
TURN Public Portfolio
Gross Total Return (Excluding SMA Carried Interest) | 5.3% | | 13.2% | 128.3% | 251.6% |
TURN Public Portfolio
Gross Total Return (Including SMA Carried Interest) | 9.6% | | 17.8% | 137.6% | 265.9% |
| | | | | |
| | | | | |
| | | | | |
| Russell Microcap Index | 31.4% | | 20.9% | 28.8% | 45.7% |
| Russell Microcap Value Index | 33.6% | | 8.1% | 15.0% | 28.8% |
| Russell 2000 | 31.4% | | 19.9% | 33.9% | 53.5% |
Let’s dig into the significant sources of the changes in value in our public portfolio in Q4 2020.
Sources of material increases in value:
•Quantum Corporation (NASDAQ:QMCO) – QMCO’s primary hyperscaler customer has returned to purchasing following a pause that began at the end of 2019, and there is increased visibility to additional hyperscaler wins. QMCO continued to execute on its product development strategy designed to help the company transition from primarily hardware revenues to software and software as a service (SaaS) revenues. For the quarter, QMCO’s stock increased by 33.0% and increased our NAV by $0.22 per share.
•Alta Equipment Group, Inc. (NASDAQ:ALTG) – We saw a continued recovery in ALTG’s business following the early spring shutdown due to the Pandemic. ALTG announced acquisitions of Howell Tractor & Equipment and the construction dealership assets from Vantage Equipment. ALTG also raised $30 million in a preferred stock offering which helped fund its acquisition of Vantage. For the quarter, ALTG’s stock increased 26.2% and increased our NAV by $0.13 per share.
•Potbelly Corporation (NASDAQ:PBPB) - In June 2020, we filed an amended Form 13D noting the poor performance of the company under its then CEO, while commending PBPB’s Board for hiring a new CFO with restaurant experience. Subsequently, PBPB’s board hired Robert Wright, the former COO of Wendy’s as its new CEO. Q3 2020 results showed improvement in store traffic and the beginning signs of a recovery were evident. Mr. Wright has continued to revamp the management team by bringing in executives with deep restaurant experience. It will take time for the business to fully recover as the pandemic is still with us, but we believe PBPB’s shares have the potential to rise materially from its current levels as the recovery unfolds and COVID-19 becomes a thing of the past. For the quarter, PBPB’s stock was up 16.1% and increased our NAV by $0.07 per share.
Sources of material decreases in value:
•TheMaven, Inc. (OTC:MVEN) - MVEN is a media coalition of professional content destinations, operating exclusively on a shared digital publishing, advertising, and distribution platform. MVEN provides a major media scale alternative to news and information on social platforms. The high-scale, unified platform offers operating leverage to all participants in MVEN’s ecosystem by eliminating all non-content operating expenses. MVEN’s distributed operating leverage enables its entire suite of services to be provided on a revenue share basis, which creates lower, non-fixed operating costs than if a media company was forced to run its own platform and digital ad sales team. MVEN provides distribution across 100+ million monthly users in a single platform, allowing advertisers to be more successful with return on investments in marketing. Among its many properties, MVEN operates a 100-year license agreement to run Sports Illustrated and owns TheStreet.com, after acquiring that asset in 2019. This past year we worked with MVEN’s board, in our capacity as observers to the board, to affect a change in the CEO of the company. MVEN subsequently announced Ross Levinsohn would be the new CEO. Business continued to improve but the company needed to raise capital to offset continued cash burn. The long awaited, and very late, financial filings with the SEC started in 2021 with the filing of MVEN’s 2018 financial statements. We currently expect that MVEN will be current with its filings with the SEC in Q1 2021 and subsequently seek an uplist to a national exchange. During the
quarter, TURN formed a group with B. Riley Financial, Inc., to work toward replacing MVEN’s current board with industry experts. For the quarter, MVEN’s stock declined by 22.2 % (based on a 1% VWAP of outstanding shares less a discount for lack of marketability) and decreased our NAV by $0.24 per share.
In other public portfolio notes, we bought and sold Kirkland's, Inc. (NASDAQ:KIRK) intra-quarter for a gain of approximately $500,000. We also sold Perion Network, Ltd. (NASDAQ:PERI) for a total gain of approximately $890,000. We also initiated starter positions in four new holdings that we look forward to sharing with shareholders in future periods.
Private Portfolio
For the quarter, our private portfolio increased in value by $2.6 million, or $0.25 per share. The largest increases were in ORIG3N, Inc. (+$0.13/share), HALE.life Corporation (+$0.11/share) and Black Silicon Holdings, Inc. (+$0.06/share). We had slight decreases in value in AgBiome, LLC (‑$0.02/share) and EchoPixel (-$0.02/share).
In almost every shareholder letter, we state that while we desire to shepherd our existing private portfolio to exits or explore opportunities to sell our positions in those companies, “we have the luxury of being able to sell our private holdings when we believe it makes sense for shareholders rather than being forced to do so to survive.” Because you haven’t seen a monetization in any given quarter, doesn’t mean we have not been active in attempting to monetize certain holdings. The remaking of our business and the significant cash and securities of public portfolio companies that we have built means we don’t have to sell anything unless we feel that it is the right thing to do for shareholders. I can tell you that we have rejected numerous bids for the private portfolio from “sharks” thinking they can come in and steal the portfolio from us. That will never happen under our watch. I can’t emphasize enough the difference between having to sell and wanting to sell. We do not have to sell anything, given our success in remaking our balance sheet over the last four years. And we won’t unless the price makes sense. Since the start of TURN, our private portfolio has reduced NAV by $0.58/share while our public investing strategy has increased NAV by $4.42/share. It is important to note that future results may be materially different than prior results.
EXPENSES
As we have noted in previous letters, we have dramatically reduced our cost structure under our new strategy. In 2016, before our Fund’s change in investment focus and management team, our operating expenses, excluding stock-based compensation and interest on outstanding debt, averaged approximately $1.3 million per quarter. For Q4 2020, our operating expenses equaled approximately $645,000, which included an approximately $400,000 reduction in our medical retirement benefit accrual. Given our persistent performance, the Compensation Committee approved approximately $638,000 of prior deferred bonuses awarded in 2019 and is accrued and included in NAV. The Compensation Committee also set aggregate 2020 bonuses at $849,000, $720,000 of which is included in NAV as of December 31, 2020. The remainder will be paid over the next two years if performance in 2020 is persistent at the discretion of the Compensation Committee.
TURN/NAV: SUM OF THE PARTS
As of the end of Q4 2020, TURN traded at 72% of NAV. Our securities of publicly traded companies, cash, and other assets net of liabilities were $5.55 per share. Our stock price was $6.66. If we received 100% credit for the value of these assets net of liabilities, the market is ascribing a value of approximately $1.11 per share, or $11.5 million, to our private portfolio. Given our private assets are valued at approximately $38.7 million, the market is discounting the value of our private portfolio assets by 70% as of the end of Q4 2020.
As we grow our cash and securities of publicly traded companies, the discount our stock trades to NAV should narrow. At the beginning of our strategy in 2017, we had 27% of our cash and total investments in cash and public securities, and we were trading at a 41% discount to NAV. At the end of Q4 2020 we had 61% of our assets and cash and securities of public companies and our stock traded at a 30% discount to NAV. I have mentioned in previous letters, the value of AgBiome alone is fair valued at a greater value than the market is pricing the entire portfolio. I will remind you that Petra Pharma Corporation was acquired in Q2 2020, and between our direct ownership in Petra and our indirect ownership through Accelerator IV-New York Corporation, we received approximately $4.7 million in cash. We have the ability to receive an additional $350,000 held in escrow in May 2021, we retain ownership in a spinout company that will seek to monetize additional assets of the company, and we could receive future milestone payments of up to approximately $86.9 million. While the timing and likelihood of achieving these milestones is uncertain, and we could ultimately receive none of these milestone payments, the Petra acquisition was a material and positive event for 180 and its shareholders. We believe that our other private holdings not only have real value today, but also have the potential to monetize into cash in the future.
CONCLUSION
I am glad 2020 is over. It was yet another year in which the decision we made to focus on the public markets, and not the private markets has proven to be a sound decision by our Board. For the year, our nearly +18% gross total return in our public portfolio, including carried interest generated from our SMA, netted out to increasing our NAV by $0.88 per share. During the same period, we had declines of nearly $0.40 per share in our private portfolio. Our strategy of combining our value approach with constructive activism has accrued to the benefit of our shareholders. Our three-year gross total return, including carried interest from our SMA, of +137.6% compares favorably to a +28.8% gross total return for the Russell Microcap Index and a +15.0% return for the Russell Microcap Value Index. We have often said it is our job to seek to create value for our shareholders in all market environments, and we are pleased to have survived this year by growing our NAV.
We have completely remade our business. When I first joined the Board of Directors in mid-2016, we had just approximately $17 million in cash and securities of public companies net of outstanding debt. As of February 19, 2021, we have nearly $73 million on our balance sheet and grew the assets for our SMA client from $25 million to $38 million. For our performance in growing the value of the SMA in 2020, we were able to generate approximately $2.4 million in carried interest which represents approximately 77% of our normal operating expenses not including bonuses. In 2021, we will continue to build our asset base for those that want to invest in our strategy. Much of our investing results are episodic. There may be quarters where we don’t participate on the upside or perhaps underperform on the downside. We take significant positions in microcap names and use activism as a mechanism to create value. Sometimes we get paid quickly (HEAR, PRCP) and other times it takes longer (TST), but from start to finish our numbers are what our numbers are and, since we started, that equates to a +265.9% gross total return, including carried interest from our SMA, versus a +45.7% gross total return for the Russell Microcap Index and a +28.8% gross total return for the Russell Microcap Value Index. We did that by not trying to game an index or look like an index; but by instilling a rigorous bottom-up research process and identifying those companies' stocks we believe can offer at least 100% upside over a three-year cycle with a margin of safety on the downside should our investment thesis not play out.
So, let’s dream for a minute…We are building scale, and we aren’t stopping here. We started with $20 million in cash and securities of publicly traded companies and have grown that to nearly $73 million as of February 19, 2021. I think we all can agree that it is harder to turn $20 million into $73 million than it is to turn $73 million to $150 million. Just $150 million alone would give us a $14.46 stock price before giving us any credit for our private portfolio. I am allowed to dream. Suppose we grow the $73 million to $300 million. That would give us a $28.91 share price. Here is the thing, while there is no guarantee that future results will mirror past results, we do not believe that achieving that growth isn’t some imaginary pipe dream. If we can replicate our performance for shareholders over the next 5 years, we can get there. And, if we find additional interesting SPAC opportunities like the one we think we have uncovered in early 2021, we believe future is bright.
Thank you for your continued support.
Kevin Rendino
Chairman and Chief Executive Officer
| | |
180 DEGREE CAPITAL CORP.
CONSOLIDATED STATEMENT OF ASSETS AND LIABILITIES |
| | | | | |
| | December 31, 2020 |
| ASSETS | |
| Investments in portfolio securities, at value: | |
| Unaffiliated privately held companies (cost: $14,161,430) | $ | 20,161,923 | |
| Unaffiliated publicly traded securities (cost: $11,666,164) | 14,784,543 | |
| Non-controlled affiliated privately held companies (cost: $21,637,513) | 10,679,301 | |
| Non-controlled affiliated publicly traded securities (cost: $26,304,854) | 30,431,503 | |
| Unaffiliated rights to payments (adjusted cost basis: $6,408,684) | 7,720,674 | |
| Cash | 11,497,446 | |
| Restricted cash | 11,639 | |
| Funds held in escrow from sales of investment, at value | 161,779 | |
| Receivable from managed funds | 2,638,380 | |
| Receivable from portfolio companies | 794,993 | |
| Prepaid expenses | 325,945 | |
| Interest receivable | 8,154 | |
| Other receivables | 9,219 | |
| Other assets | 27,843 | |
| Total assets | $ | 99,253,342 | |
| LIABILITIES & NET ASSETS | |
| |
| Bonus payable (Note 7) | $ | 1,357,922 | |
| Post-retirement plan liabilities | 842,366 | |
| Accounts payable and accrued liabilities | 516,115 | |
| Payable for securities purchased | 219,145 | |
| Total liabilities | $ | 2,935,548 | |
| Commitments and contingencies (Note 10) | |
| Net assets | $ | 96,317,794 | |
| Net assets are comprised of: | |
| Preferred stock, $0.10 par value, 2,000,000 shares authorized; none issued | $ | 0 | |
| Common stock, $0.03 par value, 15,000,000 shares authorized; 11,541,079 issued* | 334,594 | |
| Additional paid in capital | 122,250,693 | |
| Total accumulated distributable loss | (21,661,968) | |
| Treasury stock, at cost 1,167,259 shares* | (4,605,525) | |
| Net assets | $ | 96,317,794 | |
| Shares outstanding* | 10,373,820 | |
| Net asset value per outstanding share | $ | 9.28 | |
*Reflects a 1-for-3 reverse stock split that became effective on January 4, 2021. Refer to Note 1. The Company, for further information.
The accompanying notes are an integral part of these consolidated financial statements.
12
| | |
180 DEGREE CAPITAL CORP.
CONSOLIDATED STATEMENT OF OPERATIONS |
| | | | | |
| Year Ended
December 31, 2020 |
| Income: | |
| Interest from: | |
| Unaffiliated companies-PIK | $ | 43,024 | |
| Non-controlled affiliated companies-cash | 4,011 | |
| Non-controlled affiliated companies-PIK | 10,027 | |
| Carried interest | 2,371,223 | |
| Other income (Note 2) | 688,401 | |
| Dividend income | 266,089 | |
| Fee income for providing managerial assistance to portfolio companies-non-cash | 59,170 | |
| Management fee income | 24,736 | |
| Total income | 3,466,681 | |
| Operating fees and expenses: | |
| Salaries, bonus and benefits | 2,230,613 | |
| Professional | 818,876 | |
| Administration and operations | 297,087 | |
| Directors | 266,587 | |
| Insurance | 243,238 | |
| Rent | 89,448 | |
| Custody | 24,750 | |
| Other | 5,393 | |
| Total operating expenses | 3,975,992 | |
| Net investment loss before income tax expense | (509,311) | |
| Income tax expense | 913 | |
| Net investment loss | (510,224) | |
| Net realized gain (loss) from investments: | |
| Unaffiliated privately held companies | 3,539,069 | |
| Unaffiliated publicly traded securities | 4,285,387 | |
| Non-controlled affiliated privately held companies | (10,181,797) | |
| Non-controlled affiliated publicly traded securities | 1,532,677 | |
| Unaffiliated rights to payments | 23,976 | |
| Call options | (271,304) | |
| Net realized loss from investments | (1,071,992) | |
| Change in unrealized (depreciation) appreciation on investments: | |
| Unaffiliated privately held companies | (4,576,677) | |
| Unaffiliated publicly traded securities | 4,592,278 | |
| Non-controlled affiliated privately held companies | 6,971,084 | |
| Non-controlled affiliated publicly traded securities | (4,364,303) | |
| Unaffiliated rights to payments | 86,890 | |
| Net change in unrealized appreciation on investments | 2,709,272 | |
| Net realized loss from investments and change in unrealized appreciation on investments | 1,637,280 | |
| Share of loss on equity method investment | (22,901) | |
| Net increase in net assets resulting from operations | $ | 1,104,155 | |
The accompanying notes are an integral part of these consolidated financial statements.
13
| | |
180 DEGREE CAPITAL CORP.
CONSOLIDATED STATEMENT OF CASH FLOWS |
| | | | | |
| Year Ended
December 31, 2020 |
| Cash flows provided by operating activities: | |
| Net increase in net assets resulting from operations | $ | 1,104,155 | |
| Adjustments to reconcile net increase in net assets resulting from operations to net cash provided by operating activities: |
| Net realized loss from investments | 1,071,992 | |
| Net change in unrealized appreciation on investments | (2,709,272) | |
| Share of loss on equity method investee | 22,901 | |
| Depreciation of fixed assets | 5,511 | |
| Accretion of bridge note PIK interest income | (53,051) | |
| Fee income for providing managerial assistance to portfolio companies-non-cash | (59,170) | |
| Call options purchased | (523,562) | |
| Call options written | 252,258 | |
| Purchase of unaffiliated publicly traded securities | (21,077,598) | |
| Purchase of non-controlled affiliated publicly traded securities | (6,304,562) | |
| Distributions from sale of unaffiliated privately held companies | 4,605,796 | |
| Proceeds from sale of unaffiliated publicly traded securities | 24,638,373 | |
| Proceeds from unaffiliated rights to payments | 45,194 | |
| Proceeds from sale of non-controlled affiliated publicly traded securities | 3,306,001 | |
| Proceeds from sale of non-controlled affiliated privately held companies | 87,500 | |
| Changes in assets and liabilities: | |
| Increase in receivable from managed funds | (2,500,251) | |
| Increase in receivable from portfolio companies | (688,323) | |
| Increase in prepaid expenses | (57,992) | |
| Increase in interest receivable | (4,012) | |
| Decrease in other receivables | 57,621 | |
| Increase in other assets | (114) | |
| Decrease in receivable from sales of securities | 559,233 | |
| Decrease in bonus payable | (1,223,363) | |
| Decrease in post-retirement plan liabilities | (414,838) | |
| Increase in accounts payable and accrued liabilities | 137,459 | |
| Decrease in payable for securities purchased | (137,468) | |
| Net cash provided by operating activities | 140,418 | |
| Cash flows from investing activities: | |
| Purchase of fixed assets | (5,974) | |
| Net cash used in investing activities | (5,974) | |
| Net increase in cash and restricted cash | 134,444 | |
| Cash and restricted cash at beginning of the year | 11,374,641 | |
| Cash and restricted cash at end of the year | $ | 11,509,085 | |
| Supplemental disclosures of cash flow information: | |
| Income taxes paid | $ | 913 | |
| |
| Cash | $ | 11,497,446 | |
| Restricted cash | 11,639 | |
| Total cash and restricted cash shown in the consolidated statement of cash flows | $ | 11,509,085 | |
| |
The accompanying notes are an integral part of these consolidated financial statements.
14
| | |
180 DEGREE CAPITAL CORP.
CONSOLIDATED STATEMENTS OF CHANGES IN NET ASSETS |
| | | | | | | | | | | |
| Year Ended
December 31, 2020 | | Year Ended December 31, 2019 |
| | | |
| Changes in net assets from operations: | | | |
| Net investment loss | $ | (510,224) | | | $ | (4,831,721) | |
| Net realized (loss) gain on investments | (1,071,992) | | | 9,642,262 | |
| Net change in unrealized appreciation on investments | 2,709,272 | | | 8,410,882 | |
| Share of loss on equity method investment | (22,901) | | | (42,552) | |
| Net increase in net assets resulting from operations | 1,104,155 | | | 13,178,871 | |
| Net increase in net assets | 1,104,155 | | | 13,178,871 | |
| Net Assets: | | | |
| Beginning of the year | 95,213,639 | | | 82,034,768 | |
| End of the year | $ | 96,317,794 | | | $ | 95,213,639 | |
| | | |
The accompanying notes are an integral part of these consolidated financial statements.
15
| | |
180 DEGREE CAPITAL CORP.
CONSOLIDATED FINANCIAL HIGHLIGHTS |
| | | | | | | | | | | | | | | | | | | | | | | | | | | | | | | | |
| Year Ended
Dec. 31 2020 | | Year Ended
Dec. 31, 2019 | | Year Ended
Dec. 31, 2018 | | Year Ended
Dec. 31, 2017 | | Year Ended
Dec. 31, 2016 | |
| | | | | | | | | | |
| Per Share Operating Performance#: | | | | | | | | | | |
| Net asset value per share, beginning of the year | $ | 9.18 | | | $ | 7.92 | | | $ | 7.80 | | | $ | 7.02 | | | $ | 8.64 | | |
Net investment loss* | (0.05) | | | (0.48) | | | (0.21) | | | (0.36) | | | (0.45) | | |
Net realized (loss) gain from investments* | (0.11) | | | 0.93 | | | (0.75) | | | (1.14) | | | (0.78) | | |
Net change in unrealized appreciation (depreciation) on investments and options*1 | 0.26 | | | 0.81 | | | 1.08 | | | 2.40 | | | (0.36) | | |
Share of loss on equity method investment*2 | 0.00 | | | 0.00 | | | 0.00 | | | 0.00 | | | 0.00 | | |
| Total* | 0.10 | | | 1.26 | | | 0.12 | | | 0.90 | | | (1.59) | | |
Net (decrease) increase as a result of stock-based compensation expense*2 | 0.00 | | | 0.00 | | | 0.00 | | | (0.03) | | | 0.03 | | |
Net increase as a result of purchase of treasury stock | 0.00 | | | 0.00 | | | 0.00 | | | 0.00 | | | 0.00 | | |
Net decrease as a result of acquisition of vested restricted stock awards related to employee withholding2 | 0.00 | | | 0.00 | | | 0.00 | | | (0.06) | | | (0.03) | | |
| Total (decrease) increase from capital stock transactions | 0.00 | | | 0.00 | | | 0.00 | | | (0.09) | | | 0.00 | | |
Net (decrease) increase as a result of other comprehensive (loss) income*2 | 0.00 | | | 0.00 | | | 0.00 | | | (0.03) | | | (0.03) | | |
| Net increase (decrease) in net asset value | 0.10 | | | 1.26 | | | 0.12 | | | 0.78 | | | (1.62) | | |
| Net asset value per share, end of the year | $ | 9.28 | | | $ | 9.18 | | | $ | 7.92 | | | $ | 7.80 | | | $ | 7.02 | | |
| | | | | | | | | | |
| Stock price per share, end of the year | $ | 6.66 | | | $ | 6.45 | | | $ | 5.25 | | | $ | 5.91 | | | $ | 4.14 | | |
| Total return based on stock price | 3.26 | % | | 22.86 | % | | (11.17) | % | | 42.75 | % | | (37.27) | % | |
| Supplemental Data: | | | | | | | | | | |
| Net assets, end of the year | $ | 96,317,794 | | | $ | 95,213,639 | | | $ | 82,034,768 | | | $ | 81,042,989 | | | $ | 72,255,610 | | |
| Ratio of expenses, excluding taxes, to average net assets | 4.61 | % | ^ | 6.42 | % | ^ | 3.62 | % | ^ | 6.26 | % | ^ | 7.88 | % | |
| Ratio of expenses, including taxes, to average net assets | 4.61 | % | ^ | 6.42 | % | ^ | 3.63 | % | ^ | 6.28 | % | 3^ | 7.89 | % | |
| Ratio of net investment loss to average net assets | (0.59) | % | | (5.42) | % | | (2.82) | % | | (4.68) | % | | (5.64) | % | |
| Average debt outstanding | $ | 0 | | | $ | 0 | | | $ | 0 | | | $ | 0 | | | $ | 4,590,164 | | |
| Average debt per share | $ | 0.00 | | | $ | 0.00 | | | $ | 0.00 | | | $ | 0.00 | | | $ | 0.45 | | |
| Portfolio turnover | 35.16 | % | | 30.17 | % | | 20.43 | % | | 8.83 | % | | ** | |
| Number of shares outstanding, end of the year | 10,373,820 | | | 10,373,820 | | | 10,373,820 | | | 10,373,820 | | | 10,301,363 | | |
#Reflects a 1-for-3 reverse stock split that became effective on January 4, 2021. Refer to Note 1. The Company, for further information.
*Based on average shares outstanding.
^ The Company has entered into an expense offsetting arrangement with one of its unaffiliated brokers relating to broker fees paid. The total broker fee charged to the Company was applied as a credit to fees charged by an affiliate of the unaffiliated broker who the Company subscribes to for data services billed during the year. The Company received an offset to expense totaling approximately $15,700, $17,500 and $5,700 with that broker for the years ended December 31, 2019, December 31, 2018 and December 31, 2017, respectively. The Company received an offset to expense totaling approximately $31,900 with that broker for the year ended December 31, 2020.
**Prior to March 2017, the Company was a business development company investing primarily in privately held securities. Portfolio turnover was not a relevant indicator for such investments given that the Company did not generally pay brokerage fees on such investments.
1 Net unrealized losses include rounding adjustments to reconcile change in net asset value per share.
2 Amounts listed as zero are amounts calculated as less than $0.005.
3 Ratio of expenses, including taxes and excluding expenses related to restructuring, to quarterly average net assets for the year ended December 31, 2017 was 5.19%.
The accompanying notes are an integral part of these consolidated financial statements.
16
| | | | | | | | | | | | | | | | | | | | | | | | | | | | | |
| 180 DEGREE CAPITAL CORP. CONSOLIDATED SCHEDULE OF INVESTMENTS AS OF DECEMBER 31, 2020 |
| | | | | | | | | |
| Method of
Valuation (1) | | Industry | | Shares/Principal | | Cost | | Value |
| | | | | | | | | | | | | | | | | | | | | | | | | | | | | |
| Investments in Unaffiliated Companies (2) - | | | | | | | | | |
| 36.3% of net assets at value | | | | | | | | | |
| | | | | | | | | |
| Privately Held Companies (Illiquid) - | | | | | | | | | |
| 20.9% of net assets at value | | | | | | | | | |
| | | | | | | | | |
| AgBiome, LLC (3)(4) | | | Fertilizers & Agricultural Chemicals | | | | | | |
| Develops agricultural products that reduce risk and improve yield | | | | | | | | | |
| Series A-1 Convertible Preferred Units (acquired 1/30/13) | (I) (L3) | | | | 2,000,000 | | | $ | 2,000,000 | | | $ | 10,101,888 | |
| Series A-2 Convertible Preferred Units (acquired 4/9/13-10/15/13) | (I) (L3) | | | | 417,392 | | | 521,740 | | | 2,146,445 | |
| Series B Convertible Preferred Units (acquired 8/7/15) | (I) (L3) | | | | 160,526 | | | 500,006 | | | 935,155 | |
| | | | | | | 3,021,746 | | | 13,183,488 | |
| | | | | | | | | |
| AutoTech Ventures Management I, LLC (3)(4)(5) | | | Asset Management & Custody Banks | | | | | | |
| Venture capital investing in automotive-related companies | | | | | | | | | |
| LLC Interests (acquired 12/1/17) | (M) (L3) | | | | 0 | | | 0 | | | 137,500 | |
| | | | | | | | | |
| DWSI Holdings, Inc. (3)(4)(6)(7) | | | Technology Hardware, Storage & Peripherals | | | | | | |
| Develops high-performance quantum computing systems | | | | | | | | | |
| Class A Convertible Preferred Stock (acquired 4/14/20) | (I) (L3) | | | | 1,025,045.6 | | | 1,238,050 | | | 1,246,161 | |
| | | | | | | | | |
| Fleet Health Alliance, LLC (3)(4)(7) | | | Health Care Technology | | | | | | |
| Develops software for information transfer amongst healthcare providers and consumers | | | | | | | | | |
| Unsecured Convertible Bridge Note, 0%, (acquired 4/22/16, no maturity date) | (I) (L3) | | | | $ | 225,000 | | | 225,000 | | | 0 | |
| | | | | | | | | |
| Lodo Therapeutics Corporation (3)(7) | | | Pharmaceuticals | | | | | | |
| Develops novel therapeutics derived from a metagenome-based Natural Product Discovery Platform | | | | | | | | | |
| Series A Convertible Preferred Stock (acquired 12/21/15-4/22/16) | (I) (L3) | | | | 658,190 | | | 658,190 | | | 84,806 | |
| Secured Convertible Bridge Note, 6% PIK, (acquired 6/27/19, maturing 5/7/21) | (I) (L3) | | | | $ | 474,019 | | | 517,187 | | | 87,743 | |
| | | | | | | 1,175,377 | | | 172,549 | |
| | | | | | | | | |
The accompanying notes are an integral part of these consolidated financial statements.
17
| | | | | | | | | | | | | | | | | | | | | | | | | | | | | |
| 180 DEGREE CAPITAL CORP. CONSOLIDATED SCHEDULE OF INVESTMENTS AS OF DECEMBER 31, 2020 |
| | | | | | | | | |
| Method of
Valuation (1) | | Industry | | Shares/Principal | | Cost | | Value |
| | | | | | | | | | | | | | | | | | | | | | | | | | | | | |
| Investments in Unaffiliated Companies (2) - | | | | | | | | | |
| 36.3% of net assets at value (cont.) | | | | | | | | | |
| | | | | | | | | |
| Privately Held Companies (Illiquid) - | | | | | | | | | |
| 20.9% of net assets at value (cont.) | | | | | | | | | |
| | | | | | | | | |
| Magnolia Neurosciences Corporation (3)(4)(7) | | | Pharmaceuticals | | | | | | |
| Develops novel therapeutics for treatment of neurodegeneration | | | | | | | | | |
| Series A Convertible Preferred Stock (acquired 8/3/18) | (I) (L3) | | | | 862,872 | | | $ | 862,872 | | | $ | 864,590 | |
| | | | | | | | | |
| Nanosys, Inc. (3)(4)(7) | | | Specialty Chemicals | | | | | | |
| Develops inorganic nanowires and quantum dots for use in LED-backlit devices | | | | | | | | | |
| Series C Convertible Preferred Stock (acquired 4/10/03) | (I) (L3) | | | | 803,428 | | | 1,500,000 | | | 436,896 | |
| Series D Convertible Preferred Stock (acquired 11/7/05) | (I) (L3) | | | | 1,016,950 | | | 3,000,003 | | | 888,762 | |
| Series E Convertible Preferred Stock (acquired 8/13/10) | (I) (L3) | | | | 433,688 | | | 496,573 | | | 467,404 | |
| | | | | | | 4,996,576 | | | 1,793,062 | |
| | | | | | | | | |
| NanoTerra, Inc. (3)(4) | | | Research & Consulting Services | | | | | | |
| Develops surface chemistry and nano-manufacturing solutions | | | | | | | | | |
| Warrants for Common Stock expiring on 2/22/21 (acquired 2/22/11) | (I) (L3) | | | | 4,462 | | | 69,168 | | | 0 | |
| Warrants for Series A-3 Preferred Stock expiring on 11/15/22 (acquired 11/15/12) | (I) (L3) | | | | 47,508 | | | 35,403 | | | 0 | |
| | | | | | | 104,571 | | | 0 | |
| | | | | | | | | |
| ORIG3N, Inc. (3)(4)(7) | | | Health Care Technology | | | | | | |
| Develops consumer focused genetic tests | | | | | | | | | |
| Series 1 Convertible Preferred Stock (acquired 2/5/15-8/5/15) | (H) (L3) | | | | 1,195,315 | | 500,000 | | 955,024 |
| Series A Convertible Preferred Stock (acquired 11/25/15-9/7/16) | (H) (L3) | | | | 1,364,666 | | 1,500,000 | | 1,167,677 |
| Series A-2 Convertible Preferred Stock (acquired 5/11/17-2/8/18) | (H) (L3) | | | | 176,386 | | 200,002 | | 163,792 |
| | | | | | | 2,200,002 | | 2,286,493 |
| | | | | | | | | |
| Phylagen, Inc. (3)(4)(7) | | | Research & Consulting Services | | | | | | |
| Develops technology to improve human health and business productivity | | | | | | | | | |
| Series A Convertible Preferred Stock (acquired 11/14/18) | (M) (L3) | | | | 548,031 | | | 233,845 | | | 374,689 | |
| | | | | | | | | |
The accompanying notes are an integral part of these consolidated financial statements.
18
| | | | | | | | | | | | | | | | | | | | | | | | | | | | | |
| 180 DEGREE CAPITAL CORP. CONSOLIDATED SCHEDULE OF INVESTMENTS AS OF DECEMBER 31, 2020 |
| | | | | | | | | |
| Method of
Valuation (1) | | Industry | | Shares/Principal | | Cost | | Value |
| | | | | | | | | | | | | | | | | | | | | | | | | | | | | |
| Investments in Unaffiliated Companies (2) - | | | | | | | | | |
| 36.3% of net assets at value (cont.) | | | | | | | | | |
| | | | | | | | | |
| Privately Held Companies (Illiquid) - | | | | | | | | | |
| 20.9% of net assets at value (cont.) | | | | | | | | | |
| | | | | | | | | |
| Ravenna Pharmaceuticals, Inc. (3)(4)(7)(8)(9) | | | Pharmaceuticals | | | | | | |
| Holding company for intellectual property in oncology therapeutics | | | | | | | | | |
| Common Stock (acquired 5/14/20) | (M) (L3) | | | | 2,584,763 | | $ | 103,391 | | | $ | 103,391 | |
| | | | | | | | | |
| Total Unaffiliated Privately Held Companies (cost: $14,161,430) | | | | | | | | | $ | 20,161,923 | |
| | | | | | | | | |
| Unaffiliated Publicly Traded Securities - | | | | | | | | | |
| 15.4% of net assets at value | | | | | | | | | |
| | | | | | | | | |
| Alta Equipment Group, Inc. (4) | | | Trading Companies & Distributors | | | | | | |
| Operates as an industrial and construction equipment company | | | | | | | | | |
| Common Stock (Unrestricted) (acquired 2/14/20-11/12/20) | (M) (L1) | | | | 693,231 | | | $ | 5,444,737 | | | $ | 6,849,122 | |
| Warrants for the Purchase of Common Stock expiring 4/8/24 (acquired 2/14/20) | (M) (L1) | | | | 150,000 | | | 237,853 | | | 299,250 | |
| | | | | | | 5,682,590 | | | 7,148,372 | |
| | | | | | | | | |
| Lantronix, Inc. (4) | | | Communications Equipment | | | | | | |
| Provides secure data access and management solutions | | | | | | | | | |
| Common Stock (acquired 9/18/18-12/1/20) | (M) (L1) | | | | 745,754 | | | 2,440,229 | | | 3,311,148 | |
| | | | | | | | | |
| Manitex International, Inc. (4) | | | Construction Machinery & Heavy Trucks | | | | | | |
| Provides specialized and custom configured heavy equipment | | | | | | | | | |
| Common Stock (acquired 12/15/20-12/17/20) | (M) (L1) | | | | 67,858 | | | 290,349 | | | 350,147 | |
| | | | | | | | | |
| OpGen, Inc. (4) | | | Biotechnology | | | | | | |
| Developing tools for genomic sequence assembly and analysis | | | | | | | | | |
| Warrants for the Purchase of Common Stock expiring 2/17/25 (acquired 5/5/15) | (I) (L3) | | | | 62 | | | 785 | | | 3 | |
| | | | | | | | | |
| Miscellaneous Common Stocks (10) | (M) (L1) | | | | | | 3,252,211 | | | 3,974,873 | |
| | | | | | | | | |
| Total Unaffiliated Publicly Traded Securities (cost: $11,666,164) | | | | | | | | | $ | 14,784,543 | |
| | | | | | | | | |
| Total Investments in Unaffiliated Companies (cost: $25,827,594) | | | | | | | | | $ | 34,946,466 | |
| | | | | | | | | |
The accompanying notes are an integral part of these consolidated financial statements.
19
| | | | | | | | | | | | | | | | | | | | | | | | | | | | | |
| 180 DEGREE CAPITAL CORP. CONSOLIDATED SCHEDULE OF INVESTMENTS AS OF DECEMBER 31, 2020 |
| | | | | | | | | |
| Method of
Valuation (1) | | Industry | | Shares/Principal | | Cost | | Value |
| | | | | | | | | | | | | | | | | | | | | | | | | | | | | |
| Investments in Non-Controlled Affiliated Companies (2) - | | | | | | | | | |
| 42.7% of net assets at value | | | | | | | | | |
| | | | | | | | | |
| Privately Held Companies (Illiquid) - | | | | | | | | | |
| 11.1% of net assets at value | | | | | | | | | |
| | | | | | | | | |
| ABSMaterials, Inc. (3)(7) | | | Specialty Chemicals | | | | | | |
| Develops nano-structured absorbent materials for water remediation and consumer applications | | | | | | | | | |
| Series A Convertible Preferred Stock (acquired 2/17/10-10/24/11) | (I) (L3) | | | | 390,000 | | | $ | 435,000 | | | $ | 28,691 | |
| Series B Convertible Preferred Stock (acquired 11/8/13-6/25/14) | (I) (L3) | | | | 1,037,751 | | | 1,217,644 | | | 343,821 | |
| Secured Convertible Bridge Note, 8% PIK, (acquired 1/20/16, maturing 12/31/21) | (M) (L3) | | | | $ | 100,000 | | | 139,627 | | | 139,627 | |
| Secured Convertible Bridge Note, 8% PIK, (acquired 3/28/17, maturing 12/31/21) | (M) (L3) | | | | $ | 25,000 | | | 32,534 | | | 32,534 | |
| | | | | | | 1,824,805 | | | 544,673 | |
| | | | | | | | | |
| Accelerator IV-New York Corporation (3)(7)(11) | | | Research & Consulting Services | | | | | | |
| Identifies and managing emerging biotechnology companies | | | | | | | | | |
| Series A Common Stock (acquired 7/21/14-12/12/18) | (I) (L3) | | | | 833,333 | | 0 | | 669,010 | |
| | | | | | | | | |
| Black Silicon Holdings, Inc. (3)(4)(7)(9)(12) | | | Semiconductors | | | | | | |
| Holding company for interest in a company that develops silicon-based optoelectronic products | | | | | | | | | |
| Series A Convertible Preferred Stock (acquired 8/4/15) | (M) (L3) | | | | 233,499 | | | 750,000 | | | 0 | |
| Series A-1 Convertible Preferred Stock (acquired 8/4/15) | (M) (L3) | | | | 2,966,667 | | | 890,000 | | | 0 | |
| Series A-2 Convertible Preferred Stock (acquired 8/4/15) | (M) (L3) | | | | 4,207,537 | | | 2,445,000 | | | 0 | |
| Series B-1 Convertible Preferred Stock (acquired 8/4/15) | (M) (L3) | | | | 1,892,836 | | | 1,169,561 | | | 0 | |
| Series C Convertible Preferred Stock (acquired 8/4/15) | (M) (L3) | | | | 1,674,030 | | | 1,171,316 | | | 0 | |
| Secured Convertible Bridge Note, 8% PIK, (acquired 8/25/16, maturing 8/4/21) | (M) (L3) | | | | $ | 1,278,453 | | | 1,444,368 | | | 836,798 | |
| | | | | | | 7,870,245 | | | 836,798 | |
| | | | | | | | | |
The accompanying notes are an integral part of these consolidated financial statements.
20
| | | | | | | | | | | | | | | | | | | | | | | | | | | | | |
| 180 DEGREE CAPITAL CORP. CONSOLIDATED SCHEDULE OF INVESTMENTS AS OF DECEMBER 31, 2020 |
| | | | | | | | | |
| Method of
Valuation (1) | | Industry | | Shares/Principal | | Cost | | Value |
| | | | | | | | | | | | | | | | | | | | | | | | | | | | | |
| Investments in Non-Controlled Affiliated Companies (2) - | | | | | | | | | |
| 42.7% of net assets at value (cont.) | | | | | | | | | |
| | | | | | | | | |
| Privately Held Companies (Illiquid) - | | | | | | | | | |
| 11.1% of net assets at value (cont.) | | | | | | | | | |
| | | | | | | | | |
| EchoPixel, Inc. (3)(4)(7) | | | Health Care Equipment | | | | | | |
| Develops virtual reality 3-D visualization software for life sciences and health care applications | | | | | | | | | |
| Series Seed Convertible Preferred Stock (acquired 6/21/13-6/30/14) | (I) (L3) | | | | 4,194,630 | | | $ | 1,250,000 | | | $ | 885,465 | |
| Series Seed-2 Convertible Preferred Stock (acquired 1/22/16) | (I) (L3) | | | | 1,476,668 | | | 500,000 | | | 315,884 | |
| Series A-2 Convertible Preferred Stock (acquired 3/23/17) | (I) (L3) | | | | 1,471,577 | | | 350,000 | | | 376,990 | |
| | | | | | | 2,100,000 | | | 1,578,339 | |
| | | | | | | | | |
| Essential Health Solutions, Inc. (3)(7) | | | Health Care Technology | | | | | | |
| Develops software for information transfer amongst healthcare providers and consumers | | | | | | | | | |
| Common Stock (acquired 11/18/16) | (I) (L3) | | | | 200,000 | | | 20 | | | 0 | |
| Series A Convertible Preferred Stock (acquired 11/18/16) | (I) (L3) | | | | 2,750,000 | | | 2,750,000 | | | 327,907 | |
| Unsecured Convertible Bridge Note, 8%, (acquired 12/19/18, maturing 12/19/21) | (I) (L3) | | | | $ | 50,000 | | | 50,000 | | | 11,196 | |
| | | | | | | 2,800,020 | | | 339,103 | |
| | | | | | | | | |
| HALE.life Corporation (3)(4)(7) | | | Health Care Technology | | | | | | |
| Develops a platform to facilitate precision health and medicine | | | | | | | | | |
| Common Stock (acquired 3/1/16) | (I) (L3) | | | | 1,000,000 | | | 10 | | | 111,747 | |
| Series Seed-1 Convertible Preferred Stock (acquired 3/28/17) | (I) (L3) | | | | 11,000,000 | | | 1,896,920 | | | 1,632,048 | |
| Series Seed-2 Convertible Preferred Stock (acquired 12/28/18) | (I) (L3) | | | | 12,083,132 | | | 2,500,000 | | | 1,892,116 | |
| | | | | | | 4,396,930 | | | 3,635,911 | |
| | | | | | | | | |
| | | | | | | | | |
The accompanying notes are an integral part of these consolidated financial statements.
21
| | | | | | | | | | | | | | | | | | | | | | | | | | | | | |
| 180 DEGREE CAPITAL CORP. CONSOLIDATED SCHEDULE OF INVESTMENTS AS OF DECEMBER 31, 2020 |
| | | | | | | | | |
| Method of
Valuation (1) | | Industry | | Shares/Principal | | Cost | | Value |
| | | | | | | | | | | | | | | | | | | | | | | | | | | | | |
| Investments in Non-Controlled Affiliated Companies (2) - | | | | | | | | | |
| 42.7% of net assets at value (cont.) | | | | | | | | | |
| | | | | | | | | |
| Privately Held Companies (Illiquid) - | | | | | | | | | |
| 11.1% of net assets at value (cont.) | | | | | | | | | |
| | | | | | | | | |
| TARA Biosystems, Inc. (3)(4)(7) | | | Life Sciences Tools & Services | | | | | | |
| Develops human tissue models for toxicology and drug discovery applications | | | | | | | | | |
| Common Stock (acquired 8/20/14) | (I) (L3) | | | | 2,000,000 | | | $ | 20 | | | $ | 552,902 | |
| Series A Convertible Preferred Stock (acquired 3/31/17) | (I) (L3) | | | | 6,878,572 | | | 2,545,493 | | | 2,444,684 | |
| Series A-2 Convertible Preferred Stock (acquired 4/18/19) | (I) (L3) | | | | 208,577 | | | 100,000 | | | 77,881 | |
| | | | | | | 2,645,513 | | | 3,075,467 | |
| | | | | | | | | |
| Total Non-Controlled Affiliated Privately Held Companies (cost: $21,637,513) | | | | | | | | | $ | 10,679,301 | |
| | | | | | | | | |
| Non-Controlled Affiliated Publicly Traded Securities - | | | | | | | | | |
| 31.6% of net assets at value | | | | | | | | | |
| | | | | | | | | |
| Potbelly Corporation (4) | | | Restaurants | | | | | | |
| Operates a chain of sandwich shops | | | | | | | | | |
| Common Stock (acquired 6/24/19-6/1/20) | (M) (L1) | | | | 1,268,099 | | | $ | 5,275,094 | | | $ | 5,579,636 | |
| | | | | | | | | |
| Quantum Corporation (4)(13) | | | Technology Hardware, Storage & Peripherals | | | | | | |
| Provides high-density data storage and high-speed data processing solutions | | | | | | | | | |
| Common Stock (acquired 2/4/19-12/9/20) | (M) (L1) | | | | 1,484,955 | | | 3,969,084 | | | 9,087,925 | |
| | | | | | | | | |
| Sonim Technologies, Inc. (4) | | | Technology Hardware, Storage & Peripherals | | | | | | |
| Provides rugged communications products | | | | | | | | | |
| Common Stock (acquired 6/5/20-7/14/20) | (M) (L1) | | | | 6,045,229 | | | 4,541,166 | | | 4,376,746 | |
| | | | | | | | | |
The accompanying notes are an integral part of these consolidated financial statements.
22
| | | | | | | | | | | | | | | | | | | | | | | | | | | | | |
| 180 DEGREE CAPITAL CORP. CONSOLIDATED SCHEDULE OF INVESTMENTS AS OF DECEMBER 31, 2020 |
| | | | | | | | | |
| Method of
Valuation (1) | | Industry | | Shares/Principal | | Cost | | Value |
| | | | | | | | | | | | | | | | | | | | | | | | | | | | | |
| Investments in Non-Controlled Affiliated Companies (2) - | | | | | | | | | |
| 42.7% of net assets at value (cont.) | | | | | | | | | |
| | | | | | | | | |
| Non-Controlled Affiliated Publicly Traded Securities - | | | | | | | | | |
| 31.6% of net assets at value (cont.) | | | | | | | | | |
| | | | | | | | | |
| Synacor, Inc. (4)(14) | | | Application Software | | | | | | |
| Provides technology development, multiplatform services and revenue partner for video, internet and communications providers, device manufacturers, and enterprises | | | | | | | | | |
| Common Stock (acquired 4/6/17-10/1/20) | (M) (L1) | | | | 1,744,640 | | | $ | 4,519,510 | | | $ | 2,372,710 | |
| Stock Options for Common Stock Expiring 2/28/29 (acquired 3/1/19) (3)(15) | (I) (L3) | | | | 50,000 | | | 0 | | | 33,743 | |
| Stock Options for Common Stock Expiring 5/16/29 (acquired 5/16/19) (3)(15) | (I) (L3) | | | | 15,000 | | | 0 | | | 10,384 | |
| Restricted Stock Units (acquired 9/8/20-10/27/20) (3)(15) | (M) (L2) | | | | 57,756 | | | 0 | | | 69,683 | |
| | | | | | | 4,519,510 | | | 2,486,520 | |
| | | | | | | | | |
| TheMaven, Inc. (3)(4)(16) | | | Interactive Media & Services | | | | | | |
| Provides a shared digital publishing, advertising and distribution platform | | | | | | | | | |
| Series H Convertible Preferred Stock (acquired 6/27/19) | (M) (L3) | | | | 1,320 | | | 2,000,000 | | | 2,307,912 | |
| Common Stock (acquired 12/18/20) | (M) (L3) | | | | 11,429,000 | | | 6,000,000 | | | 6,592,764 | |
| | | | | | | 8,000,000 | | | 8,900,676 | |
| | | | | | | | | |
| Total Non-Controlled Affiliated Publicly Traded Securities (cost: $26,304,854) | | | | | | | | | $ | 30,431,503 | |
| | | | | | | | | |
| Total Investments in Non-Controlled Affiliated Companies (cost: $47,942,367) | | | | | | | | | $ | 41,110,804 | |
| | | | | | | | | |
| Total Investments (cost: $73,769,961) | | | | | | | | | $ | 76,057,270 | |
| | | | | | | | | |
| | | | | | | | | |
The accompanying notes are an integral part of these consolidated financial statements.
23
| | | | | | | | | | | | | | | | | | | | | | | | | | | | | |
| 180 DEGREE CAPITAL CORP. CONSOLIDATED SCHEDULE OF INVESTMENTS AS OF DECEMBER 31, 2020 |
| | | | | | | | | |
| Method of
Valuation (1) | | Industry | | Shares/Principal | | Cost | | Value |
| | | | | | | | | | | | | | | | | | | | | | | | | | | | | |
| Other Financial Instruments (17) | | | | | | | | | |
| | | | | | | | | |
| Unaffiliated Rights to Payments (Illiquid) - | | | | | | | | | |
| 8.0% of net assets at value | | | | | | | | | |
| | | | | | | | | |
| Rights to Milestone Payments from Acquisition of BioVex Group, Inc. (acquired 3/4/11) (3)(4)(7)(18) | (I) (L3) | | Biotechnology | | $ | 548,998 | | | $ | 548,998 | | | $ | 1,773,349 | |
| | | | | | | | | |
| Rights to Milestone Payments from Acquisition of Petra Pharma Corporation (acquired 5/14/20) (3)(4)(7)(19) | (I) (L3) | | Pharmaceuticals | | $ | 5,859,686 | | | 5,859,686 | | | 5,947,325 | |
| | | | | | | | | |
| Rights to Payments from the Merger with Xenio Systems, Inc. (acquired 10/20/17) (3)(4)(7)(20) | (I) (L3) | | Technology Hardware, Storage & Peripherals | | $ | 0 | | | 0 | | 0 | |
| | | | | | | | | |
| Total Unaffiliated Rights to Payments (adjusted cost: $6,408,684) | | | | | | | | | $ | 7,720,674 | |
| | | | | | | | | |
| Total Investments in Privately Held Companies and Publicly Traded Securities and Other Financial Instruments (cost: $80,178,645) | | | | | | | | | $ | 83,777,944 | |
The accompanying notes are an integral part of these consolidated financial statements.
24
180 DEGREE CAPITAL CORP.
NOTES TO CONSOLIDATED SCHEDULE OF INVESTMENTS AS OF DECEMBER 31, 2020
Notes to Consolidated Schedule of Investments
(1)See Note 2. Summary of Significant Accounting Policies: Portfolio Investment Valuations.
(2)Investments in unaffiliated companies consist of investments in which we own less than five percent of the voting shares of the portfolio company. Investments in non-controlled affiliated companies consist of investments in which we own five percent or more, but less than 25 percent, of the voting shares of the portfolio company, or where we control one or more seats on the portfolio company’s board of directors but do not control the company. Investments in controlled affiliated companies consist of investments in which we own 25 percent or more of the outstanding voting rights of the portfolio company or otherwise control the company, including control of a majority of the seats on the board of directors, or more than 25 percent of the seats on the board of directors, with no other entity or person in control of more director seats than us.
(3)We are subject to legal restrictions on the sale of all or a portion of our investment(s) in this company. The total amount of restricted securities held is $47,576,384, or 49.4 percent of net assets.
(4)Represents a non-income producing investment. Investments that have not paid dividends or interest within the last 12 months or are on non-accrual status for at least 12 consecutive months are considered to be non-income producing.
(5)We received LLC Interests of 1.25 percent in AutoTech Ventures Management I, LLC ("AutoTech") pursuant to an Administrative Services Agreement between us and AutoTech and due to us following the termination of a former employee of the Company. These LLC Interests were separate from the compensation received for providing the administrative services under the agreement that were paid in cash. The LLC interests have a capital percentage of 0 percent.
(6)The Company initially invested in D-Wave Systems, Inc. starting in 2008 and through 2014, acquiring various classes of preferred stock. On April 14, 2020, D-Wave Systems, Inc. reorganized as a subsidiary of a new company, DWSI Holdings, Inc. ("DWSI"). As part of the reorganization, all of the outstanding stock of D-Wave Systems, Inc., was consolidated into a single class of preferred stock of DWSI on a one-for-one basis. DWSI then completed a 1-for-5 reverse stock split. DWSI continues to do business as D-Wave Systems, Inc. and is located and doing business primarily in Canada.
(7)These securities are held by the Company's wholly owned subsidiary, 180 Degree Private Holdings, LLC ("180PH"), which were transferred from the Company to 180PH in the fourth quarter of 2020. The acquisition dates of the securities reflect the dates such securities were obtained by the Company rather than the transfer date.
(8)The Company received shares of Ravenna Pharmaceuticals, Inc., as part of the consideration of the acquisition of Petra Pharma Corporation.
(9)Represents a non-operating entity that exists to collect future payments from licenses or other engagements, monetize assets for future distributions to investors and debt holders, or is in the process of shutting down and distributing remaining assets according to a liquidation waterfall.
(10)The identities of these securities have been concealed to protect the Company while it completes a purchase or selling program for these securities.
(11)Historically, Accelerator IV-New York Corporation ("Accelerator") was valued under the equity method of accounting. In May 2020, the Company received distributions of its pro rata share of the distribution Accelerator received from the acquisition of Petra Pharma Corporation. The Company could receive further distributions of $6,252,754 in potential future milestone payments from the acquisition through its ownership in Accelerator, as well as $25,109 in proceeds held in escrow from the acquisition. There can be no assurance as to how much of these amounts we will ultimately realize or when they will be realized, if at all. As a result of this transaction, Accelerator is fair valued by the Company's Board of Directors, under the income approach.
The accompanying notes are an integral part of these consolidated financial statements.
25
180 DEGREE CAPITAL CORP.
NOTES TO CONSOLIDATED SCHEDULE OF INVESTMENTS AS OF DECEMBER 31, 2020
(12)On August 4, 2015, SiOnyx, Inc., reorganized its corporate structure to become a subsidiary of a new company, Black Silicon Holdings, Inc. Our security holdings of SiOnyx, Inc. were converted into securities of Black Silicon Holdings, Inc. SiOnyx, Inc. was then acquired by an undisclosed buyer. Black Silicon Holdings, Inc. owns a profit interest in the undisclosed buyer.
(13)The Company is the Investment Manager of a separately managed account that owns 760,999 shares, or 1.8 percent of the voting securities of Quantum Corporation ("QMCO"). When combined with the Company's ownership of 3.6 percent of the voting securities of QMCO, the Company controls 5.4 percent of the voting securities of QMCO based on 41,553,718 shares reported outstanding as of January 25, 2021, in QMCO's most recent Securities and Exchange Commission ("SEC") filing on Form 10-Q, December 31, 2020.
(14)The Company is the Investment Manager and Managing Member of 180.2 SPV Series - a Series of 180 Degree Capital Management, LLC that owns 1,241,400 shares, or 3.1 percent of the voting securities, of Synacor, Inc. ("SYNC"). When combined with the Company's ownership of 4.4 percent of the voting securities of SYNC, the Company controls 7.5 percent of the voting securities of SYNC, based on 39,644,363 shares reported outstanding as of November 9, 2020, in SYNC's most recent SEC filing on Form 10-Q, September 30, 2020.
(15)The stock options and restricted stock units were issued to Kevin Rendino for service on the Board of Directors of SYNC. Mr. Rendino entered into an assignment and assumption agreement with the Company that transfers all beneficial and voting interest to the Company.
(16)The Company's shares of Series H Preferred Stock of TheMaven, Inc. ("MVEN") are convertible into 4,000,920 shares of Common Stock at the discretion of the Company, subject to its as-converted ownership not exceeding 9.99 percent of the outstanding voting securities of MVEN. The shares of Common Stock of MVEN was received upon the automatic conversion of Series I Preferred Stock and Series J Preferred Stock on December 18, 2020, following MVEN amending its articles of incorporation to increase its authorized number of shares of Common Stock available for issuance.
(17)Other financial instruments are holdings of the Company that do not meet the definition of a security or a derivative.
(18)If all the remaining milestones are met, we would receive $5,384,482. There can be no assurance as to how much of these amounts we will ultimately realize or when they will be realized, if at all.
(19)If all the remaining milestones are met, we would receive $80,603,393. There can be no assurance as to how much of these amounts we will ultimately realize or when they will be realized, if at all.
(20)In October 2017, Xenio Systems, Inc., merged with Xenio Holdings, Inc. In conjunction with this merger, all common stock of Xenio Systems, Inc., was canceled and shareholders were granted a right to a future payment in the event of a sale of Xenio Holdings, Inc. The maximum amount we could receive from such payments is approximately $11,100. There can be no assurance as to how much of these amounts we will ultimately realize or when they will be realized, if at all.
The accompanying notes are an integral part of these consolidated financial statements.
26
180 DEGREE CAPITAL CORP.
NOTES TO CONSOLIDATED FINANCIAL STATEMENTS
NOTE 1. THE COMPANY
180 Degree Capital Corp. (f/k/a Harris & Harris Group, Inc.) (the "Company," "us," "our" and "we"), withdrew its election to be treated as a business development company on March 30, 2017, and subsequently returned to its prior status as a registered non-diversified closed-end management investment company ("Closed-End Fund" or "CEF") under the Investment Company Act of 1940 (the "1940 Act"). We operate as an internally managed investment company whereby our officers and employees, under the general supervision of our Board of Directors, conduct our operations. As of May 22, 2020, we are also registered with the Securities and Exchange Commission as a Registered Investment Adviser under the Investment Advisers Act of 1940 (the "Advisers Act").
H&H Ventures Management, Inc.SM ("Ventures") is a 100 percent owned subsidiary of the Company. Ventures is taxed under Subchapter C (a "C Corporation") of the Internal Revenue Code of 1986 (the "Code"). Harris Partners I, L.P, is a limited partnership and, from time to time, may be used to hold certain interests in our portfolio companies. The partners of Harris Partners I, L.P., are Ventures (sole general partner) and the Company (sole limited partner). Ventures pays taxes on income generated by its operations as well as on any non-passive investment income generated by Harris Partners I, L.P. For the year ended December 31, 2020, there was no non-passive investment income generated by Harris Partners I, L.P. Ventures, as the sole general partner, consolidates Harris Partners I, L.P. The Company consolidates Ventures for financial reporting purposes.
180 Degree Private Holdings, LLC ("180PH"), is a wholly owned limited liability corporation that was created in October 2020 to hold certain of the Company's securities of privately held companies. 180PH is consolidated for financial reporting purposes and is a disregarded entity for tax purposes under the Code.
The Company is the Managing Member of 180 Degree Capital Management, LLC ("180CM"), a limited liability company formed to facilitate the opportunity for interested investors to co-invest alongside the Company in individual publicly traded portfolio companies. As of December 31, 2020, the Company has approximately $1.6 million in capital under management in 180.2 SPV Series ("180.2 SPV"), a series of 180CM.
The Company is the General Partner of 180 Phoenix Fund, L.P. ("180 Phoenix"), a limited partnership formed to facilitate management of a fund that was formed to co-invest alongside the Company in its publicly traded companies on an on-going basis. As of December 31, 2020, 180 Phoenix did not have any capital under management.
The Company is also the Managing Member of H&H Co-Investment Partners, LLC, a limited liability company formed to facilitate the opportunity for interested investors to co-invest alongside the Company in its private portfolio companies. As of December 31, 2020, H&H Co-Investment Partners did not have any capital under management.
As of December 31, 2020, the Company has approximately $33 million in a separately managed account ("SMA").
The Company may, in certain cases, receive management fees and carried interest on profits generated on invested capital from any capital under management if and when capital is raised and if and when profits are realized, respectively. The Company does not consolidate the operations of any capital managed in separate series of 180CM, or in the separately managed account and it does not expect to consolidate the operations of any capital managed in separate series of H&H Co-Investment Partners or 180 Phoenix if and when either entity has capital under management.
180 Degree Capital BD, LLC ("180BD") is a 100 percent owned subsidiary of the Company. 180BD was formed to provide services to the Company related to fundraising for co-investment funds and not for investment returns. 180BD is a registered broker-dealer with the Financial Industry Regulatory Authority ("FINRA"). The Company consolidates 180BD for financial reporting purposes. 180BD is currently a disregarded entity for tax purposes under the Code.
Following receipt of approval from shareholders at an annual meeting of shareholders held on May 14, 2020, the Company filed an amendment to its Amended and Restated Certificate of Incorporation on December 31, 2020, to affect a reverse stock split of its issued and outstanding shares of common stock, at a ratio of one share for three shares. All share amounts, per share data and operating performance have been adjusted to reflect the reverse stock split.
NOTE 2. SUMMARY OF SIGNIFICANT ACCOUNTING POLICIES
The following is a summary of significant accounting policies followed in the preparation of the consolidated financial statements:
Principles of Consolidation. The consolidated financial statements have been prepared in accordance with accounting principles generally accepted in the US ("GAAP") and Articles 6 and 12 of Regulation S-X of the SEC and include the accounts of the Company and its wholly owned subsidiaries. The Company is an investment company following accounting and reporting guidance in Accounting Standards Codification 946. In accordance with GAAP and Regulation S-X under 17 C.F.R. Part 210, the Company may only consolidate its interests in investment company subsidiaries and controlled operating companies whose business consists of providing services to the Company. Our wholly owned subsidiaries, Ventures and 180BD, are controlled operating companies that provide services to us and are, therefore, consolidated. All significant intercompany accounts and transactions have been eliminated in the consolidation.
Use of Estimates. The preparation of the consolidated financial statements in conformity with GAAP requires management to make estimates and assumptions that affect the reported amounts of assets and liabilities and contingent assets and liabilities and the reported amounts of revenues and expenses. Actual results could differ from these estimates, and the differences could be material. The most significant estimates relate to the fair valuations of our investments.
Portfolio Investment Valuations. Investments are stated at "value" as defined in the 1940 Act and in the applicable regulations of the SEC and in accordance with GAAP. Value, as defined in Section 2(a)(41) of the 1940 Act, is (i) the market price for those securities for which a market quotation is readily available and (ii) the fair value as determined in good faith by, or under the direction of, the Board of Directors for all other assets. The Valuation Committee, comprised of all of the independent Board members, is responsible for determining the valuation of the Company’s assets within the guidelines established by the Board of Directors. The Valuation Committee receives information and recommendations from management. An independent valuation firm also reviews select portfolio company valuations. The independent valuation firm does not provide independent valuations. The fair values assigned to these investments are based on available information and do not necessarily represent amounts that might ultimately be realized when that investment is sold, as such amounts depend on future circumstances and cannot reasonably be determined until the individual investments are actually liquidated or become readily marketable. The Valuation Committee values the Company's investment assets as of the end of each calendar quarter and as of any other time requested by the Board of Directors.
Accounting Standards Codification Topic 820, "Fair Value Measurements," ("ASC 820") defines fair value as the price that would be received to sell an asset or paid to transfer a liability in an orderly transaction between market participants at the measurement date (exit price). It applies fair value terminology to all valuations whereas the 1940 Act applies market value terminology to readily marketable assets and fair value terminology to other assets.
The main approaches to measuring fair value utilized are the market approach, the income approach and the hybrid approach.
•Market Approach (M): The market approach focuses on inputs and not techniques. The market approach may use quantitative inputs such as prices and other relevant information generated by market transactions involving identical or comparable assets or liabilities and the values of market multiples derived from a set of comparable companies. The market approach may also use qualitative inputs such as progress toward milestones, the long-term potential of the business, current and future financing requirements and the rights and preferences of certain securities versus those of other securities. The selection of the relevant inputs used to derive value under the market approach requires judgment considering factors specific to the significance and relevance of each input to deriving value.
•Income Approach (I): The income approach focuses on techniques and not inputs. The income approach uses valuation techniques to convert future amounts (for example, revenue, cash flows or earnings) to a single present value amount (discounted). The measurement is based on the value indicated by current market expectations about those future amounts. Those valuation techniques include present value techniques; option-pricing models, such as the Black-Scholes-Merton formula (a closed-form model) and a binomial model (a lattice model), which incorporate present value techniques; and the multi-period excess earnings method, which is used to measure the fair value of certain assets.
•Hybrid Approach (H): The hybrid approach uses elements of both the market approach and the income approach. The hybrid approach calculates values using the market and income approach, individually. The resulting values are then distributed among the share classes based on probability of exit outcomes.
ASC Topic 820 classifies the inputs used to measure fair value by these approaches into the following hierarchy:
•Level 1 (L1): Unadjusted quoted prices in active markets for identical assets or liabilities;
•Level 2 (L2): Inputs other than quoted prices included within Level 1 that are observable for the asset or liability, either directly or indirectly. These include quoted prices in active markets for similar assets or liabilities, or quoted prices for identical or similar assets or liabilities in markets that are not active, or inputs other than quoted prices that are observable for the asset or liability, either directly or indirectly, for substantially the full term of the financial instrument. Level 2 inputs are in those markets for which there are few transactions, the prices are not current, little public information exists or instances where prices vary substantially over time or among brokered market makers; and
•Level 3 (L3): Inputs to the valuation methodology are unobservable and significant to the fair value measurement. Unobservable inputs are those inputs that reflect our own assumptions that market participants would use to price the asset or liability based upon the best available information.
Financial assets and liabilities are classified in their entirety based on the lowest level of input that is significant to the fair value measurement and are not necessarily an indication of risks associated with the investment.
As of December 31, 2020, our financial statements include investments fair valued by the Board of Directors of $47,738,166. The fair values were determined in good faith by, or under the direction of, the Board of Directors. The fair value amount includes the values of our investments in privately held companies and rights to future milestone payments, funds held in escrow from sales of investments, as well as our preferred stock and common stock of TheMaven, Inc., stock options and restricted stock units of Synacor, Inc., and our warrants of OpGen, Inc., which are securities of publicly traded companies.
Historically, our investment in Accelerator IV-New York Corporation ("Accelerator") was accounted for under the equity method of accounting. Under the equity method of accounting, investments are carried at cost, plus or minus the Company’s equity in the increases and decreases in the investee’s net assets after the date of acquisition and certain other adjustments. The Company’s share of the net income or loss of the investee for the period January 1, 2020 through March 31, 2020 is included in "Share of loss on equity method investment" on the Company’s Consolidated Statement of Operations. In May 2020, the Company received distributions of $305,169 from Accelerator for its pro rata share of the distribution Accelerator received from the acquisition of Petra Pharma Corporation by an undisclosed acquirer. Under the equity method of accounting, distributions reduce the cost of the investment. The distribution amount was greater than the carrying cost of the investment, which was $180,776 at the time of distribution. The cost was reduced to $0 and dividend was recorded for the excess over the carrying cost. In addition to the distribution, the Company has the potential to receive an additional $6,252,754 in potential future milestone payments from the acquisition through its ownership in Accelerator, as well as $25,109 in proceeds held in escrow from the acquisition. There can be no assurance as to how much of these amounts we will ultimately realize or when they will be realized, if at all. As a result of this transaction, the investment is fair valued by the Company's Board of Directors, under the income approach. There are no investments currently being valued under the equity method of accounting.
Cash. Cash includes demand deposits. Cash is carried at cost, which approximates fair value.
Restricted Cash. At December 31, 2020, we held $11,639 in "Restricted cash", as security deposits for a sub-lease. The sub-lease agreement expired at December 31, 2019. These funds are not considered part of operating cash of the Company and are payable to the sub-lease tenant. The Restricted cash, net of any future costs related to the expired sublease, is expected to be remitted to the sub-lease tenant once such potential future costs are finalized.
Unaffiliated Rights to Payments. At December 31, 2020, the outstanding potential milestone payments from Amgen, Inc.’s acquisition of BioVex Group, Inc., were valued at $1,773,349. At December 31, 2020, the outstanding potential milestone payments from the acquisition of Petra Pharma Corporation by an undisclosed acquirer unrelated to the Company were valued at $5,947,325. At December 31, 2020, the outstanding potential rights to payments from Xenio Holdings, Inc.'s merger with Xenio Systems, Inc. were valued at $0. The milestone payments are valued using the probability-adjusted, present value of proceeds from future payments that would be due upon successful completion of certain regulatory and sales milestones. There can be no assurance as to how much of these amounts we will ultimately realize or when they will be realized, if at all.
Funds Held in Escrow from Sale of Investments. At December 31, 2020, there were funds held in escrow valued at $161,779, relating to the acquisition of Petra Pharma Corporation by an undisclosed acquirer unrelated to the Company.
Prepaid Expenses. We include prepaid insurance premiums and deferred financing charges in "Prepaid expenses." Prepaid insurance premiums are recognized over the term of the insurance contract and are included in "Insurance" in the Company's Consolidated Statement of Operations.
Property and Equipment. Property and equipment are included in "Other assets" and are carried at $17,734 at December 31, 2020, representing cost of $211,477, less accumulated depreciation of $193,743. Depreciation is provided using the straight-line method over the estimated useful lives of the property and equipment. We estimate the useful lives to be five to ten years for furniture and fixtures, and three years for computer equipment.
Post-Retirement Plan Liabilities. Until it was terminated on April 27, 2017, the Company provided a Retiree Medical Benefit Plan for employees who met certain eligibility requirements. Until it was terminated on May 5, 2011, the Company also provided an Executive Mandatory Retirement Benefit Plan for certain individuals employed by us in a bona fide executive or high policy-making position. The net periodic post-retirement benefit cost includes service cost and interest on the accumulated post-retirement benefit obligation. Unrecognized actuarial gains and losses are recognized as net periodic benefit cost, pursuant to the Company's historical accounting policy in "Salaries, bonus and benefits" in the Company's Consolidated Statement of Operations. The impact of plan amendments was amortized over the employee's average service period as a reduction of net periodic benefit cost. Unamortized prior service cost was fully amortized during 2017 as a result of the termination of the Retiree Medical Benefit Plan.
Interest Income Recognition. Interest income, including amortization of premium and accretion of discount, is recorded on an accrual basis. When accrued interest is determined not to be recoverable, the Company ceases accruing interest and writes off any previously accrued interest. Write-offs are netted in interest income. During the year ended December 31, 2020, the Company had interest income of $4,011 in cash interest on secured and unsecured convertible bridge notes. During the year ended December 31, 2020, the Company recorded, $53,051 of bridge note payment-in-kind ("PIK") interest. Securities are deemed to be non-income producing if investments have not paid dividends or interest within the last 12 months or are on non-accrual status for at least 12 consecutive months.
When the fair value of a security that includes PIK interest is less than the accrued interest, the Company may place the security on non-accrued status. Starting April 1, 2018 and through December 31, 2020, Black Silicon Holdings, Inc. is on non-accrued status. Had interest been accrued an additional $103,981 in income would have been included in "Non-controlled affiliated companies-PIK" in the Company's Consolidated Statement of Operations for the year ended December 31, 2020.
Dividend Income. Dividend income is recorded on the ex-dividend date. During the year ended December 31, 2020, the Company had dividend income $266,089.
Fee Income for Providing Managerial Assistance to Portfolio Companies. During the year ended December 31, 2020, the Company earned $59,170 in non-cash income, owing to certain of its employees serving as members of the board of directors of Synacor, Inc. The Company recognizes revenues from fee income for providing managerial assistance as those services are provided.
Management Fee Income and Carried Interest from Managed Funds. The Company receives management fee income for its services as investment manager and calculated based on the investment management agreement between the Company and 180.2 SPV. As of December 31, 2020, the Company has approximately $1.6 million in capital under management in 180.2 SPV. Management fee income is earned and accrued from the date of inception of 180.2 SPV through the date of liquidation of 180.2 SPV. The management fee income will be paid to the Company upon liquidation of 180.2 SPV regardless of the performance.
The inception to date accrued but not collected management fee income from 180.2 SPV for the year ended December 31, 2020, were $71,229 and is recorded in "Receivable from managed funds" in the Company's Consolidated Statement of Assets and Liabilities. Management fee income for the year ended December 31, 2020, for 180.2 SPV is $24,736. Management fee income from 180.2 SPV for the year ended December 31, 2020, is recorded in "Management fee income" in the Company's Consolidated Statement of Operations.
The Company does not include accruals for carried interest in the Consolidated Financial Statements until such carried interest is received and/or the Company concludes that it is probable that a reversal of any accrual will not occur. As Managing Member of 180.2 SPV, the Company is entitled to receive carried interest on realized profits generated on the managed capital and calculated based on the investment management agreement between the Company and 180.2 SPV. There is no carried interest accrued from 180.2 SPV during the year ended December 31, 2020.
The Company received and recognized $4,640 in carried interest from TheStreet SPV Series, a series of 180CM, which liquidated in March 2020, as a result of a realized gain from distributions from TheStreet, Inc., which is recorded in "Carried interest" in the Company's Consolidated Statement of Operations.
The Company is entitled to receive carried interest on realized profits generated on the managed capital and calculated based on the investment management agreement between the Company and SMA. The Company accrued $2,366,583 in carried interest from SMA during the year ended December 31, 2020 and is recorded in "Receivables from managed funds" in the Company's Consolidated Statement of Assets and Liabilities. There is no management fee charged to the SMA by the Company.
Other Income. The Company may purchase restricted securities issued by publicly traded companies that include provisions that provide for payment of partial liquidated damages in the event the issuer does not meet obligations specified in the purchase agreement or other ancillary documents associated with the transaction. These obligations most commonly are associated with the filing of registration statements and/or being up to date with the filing of the issuer's financial statements with the SEC. As of December 31, 2020, the Company is due $794,993 in partial liquidated damages from TheMaven, Inc., one of its publicly traded portfolio companies, as a result of the delay in filing of registration statements related to the Company's securities of TheMaven, Inc., and from the delay in it filing of up-to-date financial information with the SEC. The amount for partial liquidated damages accrued in 2020 is recorded in "Other income" in the Company's Consolidated Statement of Operations and is included in "Receivable from portfolio companies" in the Company's Consolidated Statement of Assets and Liabilities.
Put and Call Options. The Company may purchase options on publicly traded securities as an investment and/or with the intention of limiting its downside risk. When the Company purchases an option, an amount equal to the premium paid is recorded in the Consolidated Statements of Assets and Liabilities as an investment. The Company may also purchase an option at one price and write/sell an option at another price in a simultaneous transaction referred to as a spread. The amount of these assets is subsequently marked-to-market to reflect the current value of the options. In the event that the options are exercised, the Company would be required to deliver those shares to the counterparty. When the options expire unexercised, the Company realizes a loss on the premium paid, or the difference between the premium paid and the premium received, as applicable. Net realized loss from investments in purchased options and written options was $271,304.
Rent Expense. Our lease at 1450 Broadway, New York, New York, commenced on January 21, 2010. The lease expired on December 31, 2019. Under the terms of the lease, the Company provided a security deposit of $62,100 to the landlord that was to be returned to the Company, less any unpaid expenses, upon the expiration of the lease. During 2020, the Company attempted to collect the security deposit from the prior landlord without success as of December 31, 2020. Although the Company will continue to attempt to collect this security deposit, it determined that as of December 31, 2020 that the amount is uncollectible and the Company wrote off this security deposit as additional rent expense.
The Company currently leases and runs daily operations in approximately 1,250 square feet of office space in Montclair, New Jersey, on a month-to-month basis. The base rent is approximately $26 per square foot. Either the Company or the landlord may terminate the lease at any time with two months' written notice to either party.
Realized Gain or Loss and Unrealized Appreciation or Depreciation of Portfolio Investments. Realized gain or loss is recognized when an investment is disposed of and is computed as the difference between the Company's cost basis in the investment at the disposition date and the net proceeds received from such disposition. Realized gain or loss on investment transactions are determined by specific identification. Unrealized appreciation or depreciation is computed as the difference between the fair value of the investment and the cost basis of such investment.
Income Taxes. As discussed in Note 9. Income Taxes, the Company did not qualify as a Regulated Investment Company ("RIC") under Subchapter M of the Code in 2020 and therefore will be taxed as a C Corporation. The Company did not accrue for any income taxes as of December 31, 2020 as it did not generate ordinary income. While the Company did not qualify as a RIC in 2020, it currently intend to qualify as a RIC in future years. The Company has capital loss carryforwards that can be used to offset net realized capital gains. The Company also has operating loss carryforwards that can be used to offset operating income and net realized capital gains in years when it fail to qualify as a RIC. The Company recognizes interest and penalties in income tax expense. The Company pays federal, state and local income taxes on behalf of our wholly owned subsidiary, Ventures, which is a C Corporation. See Note 9. Income Taxes for further discussion.
Foreign Currency Translation. The accounting records of the Company are maintained in U.S. dollars. All assets and liabilities denominated in foreign currencies are translated into U.S. dollars based on the rate of exchange of such currencies against U.S. dollars on the date of valuation. If Company has assets denominated in foreign currencies, it does not isolate the portion of the results of operations that arises from changes in foreign currency rates on investments held on its Consolidated Statement of Operations.
Securities Transactions. Securities transactions are accounted for on the date the transaction for the purchase or sale of the securities is entered into by the Company (i.e., trade date). Securities transactions outside conventional channels, such as private transactions, are recorded as of the date the Company obtains the right to demand the securities purchased or to collect the proceeds from a sale and incurs the obligation to pay for the securities purchased or to deliver the securities sold.
Concentration of Credit Risk. The Company places its cash with financial institutions and, at times, cash held in depository accounts may exceed the Federal Deposit Insurance Corporation's insured limit and is subject to the credit risk of such institutions to the extent it exceeds such limit.
Recent Accounting Pronouncements and Adoptions. On January 16, 2020, the FASB issued ASU 2020-01, "Investments - Equity Securities (Topic 321), Investments - Equity Method and Joint Ventures (Topic 323), and Derivatives and Hedging (Topic 815)." This ASU among other things clarifies that an entity should consider observable transactions that require the entity to either apply or discontinue the equity method of accounting, for the purposes of applying the measurement alternative in accordance with Topic 321 immediately before applying or upon discontinuing the equity method. The guidance is effective for fiscal years, and interim periods within those fiscal years, beginning after December 15, 2020, with early adoption permitted. Our investment in Accelerator IV-New York Corporation which was historically accounted for under the equity method of accounting is now fair valued by the Board of Directors. The Company my invest in exchange traded and other warrants and options which are considered derivatives. This ASU is determined not to have a significant impact on the Company's Consolidated Financial Statements, as there are no investments being accounted for using the equity method of accounting and the derivatives when held by the Company are deemed immaterial and not held for hedging.
NOTE 3. BUSINESS RISKS AND UNCERTAINTIES
Our business activities contain elements of risk. We consider the principal types of market risk to be valuation risk, diversification risk, interest rate risk and foreign currency risk. Although we are risk-seeking rather than risk-averse in our investments, we consider the management of risk to be essential to our business.
Valuation Risk
Value, as defined in Section 2(a)(41) of the 1940 Act, is (i) the market price for those securities for which market quotations are readily available and (ii) fair value as determined in good faith by, or under the direction of, the Board of Directors for all other assets. See Note 2. Summary of Significant Accounting Policies for further discussion.
We have historically invested primarily in privately held companies, the securities of which are inherently illiquid. We are currently focused on investing in what we believe are deeply undervalued microcapitalization publicly traded companies. Our publicly traded securities account for approximately 53.9 percent of the value of our portfolio of investments. Although these companies are publicly traded, their stock may not trade at high volumes and/or we may own a significant portion of a company's outstanding stock, which may restrict our ability to sell our positions in an orderly fashion and prices at which sales can be made may be volatile and materially different than the closing prices of such positions at each financial statement date. We may also be subject to restrictions on transfer and/or other lock-up provisions after these companies complete public offerings and/or if we invest in unregistered securities of public companies. Many of our privately held and publicly traded companies tend to not have attained profitability, and many of these companies also lack management depth and have limited or no history of operations. Because of the speculative nature of our investments and the lack of a liquid market for and
restrictions on transfers of privately held investments, there is greater risk of loss relative to traditional marketable investment securities.
Approximately 56.9 percent of our portfolio was fair valued and comprised of securities of privately held companies and rights to potential future milestone payments, funds held in escrow from sales of investments, as well as our preferred stock and common stock of TheMaven, Inc. (a Level 3 investment), stock options and restricted stock of Synacor Inc. (a Level 3 investment and a Level 2 investment, respectively), and our warrants of OpGen, Inc. (a Level 3 investment), which are publicly traded companies, and funds held in escrow from sales of investments. Because there is typically no public or readily ascertainable market for our interests in the small privately held companies in which we invest, the valuation of the securities in that portion of our portfolio is determined in good faith by our Valuation Committee, which is comprised of all of the independent members of our Board of Directors. The values are determined in accordance with our Valuation Procedures and are subject to significant estimates and judgments. The fair value of the securities in our portfolio may differ significantly from the values that would be placed on these securities if a ready market for the securities existed. Additionally, inputs may become available after a financial statement date that could result in a material change in value at a future financial statement date from the value reported in the current financial statements. Any changes in valuation are recorded in the Company's Consolidated Statement of Operations as "Change in unrealized appreciation (depreciation) on investments." Changes in valuation of any of our investments in privately held companies from one period to another may be significant.
Diversification Risk
While we are subject to certain diversification requirements regarding the concentration of investments in any one industry or group of industries, we do not choose investments based on a strategy of diversification. We also do not rebalance the portfolio should one of our portfolio companies increase in value substantially relative to the rest of the portfolio. Therefore, the value of our portfolio may be more vulnerable to microeconomic events affecting a single sector, industry or portfolio company and to general macroeconomic events that may be unrelated to our portfolio companies. These factors may subject the value of our portfolio to greater volatility than a company that follows a diversification strategy. As of December 31, 2020 our largest 10 investments by value accounted for approximately 72 percent of the value of our investment portfolio. Our largest three investments, by value, AgBiome, LLC, Quantum Corporation, and TheMaven, Inc., accounted for approximately 16 percent, 11 percent and 11 percent, respectively, of our investment portfolio at December 31, 2020. AgBiome, LLC, is a privately held portfolio company and Quantum Corporation and TheMaven, Inc. are publicly traded companies.
Interest Rate Risk
Interest rate sensitivity refers to the change in earnings that may result from changes in the level of interest rates. We may invest in both short- and long-term U.S. government and agency securities. To the extent that we invest in short- and long-term U.S. government and agency securities, changes in interest rates result in changes in the value of these obligations that result in an increase or decrease of our net asset value. The level of interest rate risk exposure at any given point in time depends on the market environment, the expectations of future price and market movements, and the quantity and duration of long-term U.S. government and agency securities held by the Company, and it will vary from period to period.
In addition, market interest rates for high-yield corporate debt may be an input in determining value of our investments in debt securities of privately held and publicly traded companies. Significant changes in these market rates could affect the value of our debt securities as of the valuation date of measurement of value. While we do not currently have any investments in debt securities with floating interest rates, investment income in such securities should we acquire them in the future could be adversely affected by changes in interest rates.
Foreign Currency Risk
Our investments are not subject to foreign currency risk as they are all denominated in U.S. dollars. We have one investment in a company based in Canada, DWSI Holdings, Inc., however the price per share and terms of those shares are denominated in U.S. dollars.
Coronavirus (COVID-19) Pandemic
In March 2020, the World Health Organization declared COVID-19 (a novel coronavirus) to be a pandemic. The situation is dynamic. Global financial markets have experienced and may continue to experience significant volatility resulting from the spread of COVID-19. The outbreak of COVID-19 has resulted in travel and border restrictions, quarantines, supply chain disruptions, lower consumer demand and general market uncertainty. The global economy, the economies of certain nations and individual issuers have been and may continue to be adversely affected by COVID-19, particularly in light of the interconnectivity between economies and financial markets, all of which may negatively impact the Company's performance. In addition, COVID-19 and governmental responses to COVID-19 may negatively impact the capabilities of the Company's service providers and disrupt the Company's operations. Management of the Company will continue to monitor the impact of COVID-19.
NOTE 4. FAIR VALUE OF INVESTMENTS
At December 31, 2020, our financial assets valued at fair value were categorized as follows in the fair value hierarchy:
| | | | | | | | | | | | | | | | | | | | | | | | | | |
| | | Fair Value Measurement at Reporting Date Using: |
Description | | Unadjusted Quoted Prices in Active Markets for Identical Assets (Level 1) | |
Significant Other Observable Inputs (Level 2) | |
Significant Unobservable Inputs (Level 3) | | December 31, 2020 |
| Privately Held Portfolio Companies: | | | | | | | | |
| Preferred Stock | | $ | 0 | | | $ | 0 | | | $ | 28,158,776 | | | $ | 28,158,776 | |
| Bridge Notes | | 0 | | | 0 | | | 1,107,898 | | | 1,107,898 | |
| Common Stock | | 0 | | | 0 | | | 1,437,050 | | | 1,437,050 | |
| Warrants | | 0 | | | 0 | | | 0 | | | 0 | |
| LLC Interests | | 0 | | | 0 | | | 137,500 | | | 137,500 | |
| | | | | | | | |
| Publicly Traded Portfolio Companies: | | | | | | | | |
| Preferred Stock | | $ | 0 | | | $ | 0 | | | $ | 2,307,912 | | | $ | 2,307,912 | |
| Common Stock | | 35,902,307 | | | 0 | | | 6,592,764 | | | 42,495,071 | |
| Warrants | | 299,250 | | | 0 | | | 3 | | | 299,253 | |
| Stock Options | | 0 | | | 0 | | | 44,127 | | | 44,127 | |
| Restricted Stock Units | | 0 | | | 69,683 | | | 0 | | | 69,683 | |
| Total Investments: | | $ | 36,201,557 | | | $ | 69,683 | | | $ | 39,786,030 | | | $ | 76,057,270 | |
| | | | | | | | |
| Other Financial Instruments: | | | | | | | | |
| Rights to Payments | | $ | 0 | | | $ | 0 | | | $ | 7,720,674 | | | $ | 7,720,674 | |
| Funds Held in Escrow from Sales of Investments | | 0 | | | 0 | | | 161,779 | | | 161,779 | |
| Total Financial Assets: | | $ | 36,201,557 | | | $ | 69,683 | | | $ | 47,668,483 | | | $ | 83,939,723 | |
Significant Unobservable Inputs
The table below presents the valuation technique and quantitative information about the significant unobservable inputs utilized by the Company in the fair value measurements of Level 3 assets. Unobservable inputs are those inputs for which little or no market data exists and, therefore, require an entity to develop its own assumptions.
| | | | | | | | | | | | | | | | | | | | | | | |
| Value as of December 31, 2020 | | Valuation Approach(es) | | Unobservable Input(s) | | Range(s) (Weighted Average(a)) |
| | | | | | | |
| | | | | | | |
| | | | | Price Per Share | | $1.30 ($1.30) |
| | | | | Volatility | | 82.9% (82.9%) |
| Preferred Stock | $ | 2,286,493 | | | Hybrid Approach | | Time to Exit / Cash Flows (Years) | | 2.4 (2.4) |
| | | | | Probability of Achieving Independent Milestones | | 0.0% - 75.0% (75.0%) |
| | | | | Price Per Share | | $0.21 - $6.33 ($3.59) |
| | | | | Public Comparable Adjustment (Including Non-Performance Risk) | | -82.9% - 0.0% (-25.3%) |
| | | | | Volatility | | 50.6% - 113.1% (78.0%) |
| Preferred Stock | 25,497,594 | | | Income Approach | | Time to Exit / Cash Flows (Years) | | 5.0 - 5.8 (5.0) |
| | | | | | | |
| | | | | Revenue Multiples | | 3.6 (3.6) |
| | | | | Time to Exit/Lapse of Restrictions (Years) | | 0.3 - 1.0 (0.3) |
| | | | | Discount for Lack of Marketability | | 4.9% - 24.2% (4.9%) |
| Preferred Stock | 2,682,601 | | | Market Approach | | Price Per Share | | $0.68 ($0.68) |
| Bridge Notes | 98,939 | | | Income Approach | | Estimated Value to Cost Ratio at Payout | | 0.00 - 0.22 (0.03) |
| | | | | Revenue Multiples | | 3.6 (3.6) |
| | | | | Time to Exit/Lapse of Restrictions (Years) | | 0.3 - 1.0 (0.3) |
| | | | | Discount for Lack of Marketability | | 4.9% - 24.2% (4.9%) |
| Bridge Notes | 1,008,959 | | | Market Approach | | Estimated Value to Cost Ratio at Conversion | | 1.00 (1.00) |
| | | | | Probability of Achieving Independent Milestones | | 3.4%-75.0% (46.7%) |
| | | | | Probability of Achieving Dependent Milestones | | 0.0%-14.1% (1.6%) |
| | | | | Public Comparable Adjustment (Including Non-Performance Risk) | | -25.0% - 0.0% (0.0%) |
| | | | | Volatility | | 77.8% - 113.1% (97.3%) |
| | | | | Time to Exit (Years) | | 5.0 - 13.6 (9.3) |
| Common Stock | 1,333,659 | | | Income Approach | | Price Per Share | | $0.21 - $0.88 ($0.66) |
| | | | | Time to Exit/Lapse of Restrictions (Years) | | 0.3 (0.3) |
| | | | | Discount for Lack of Marketability | | 4.9% (4.9%) |
| Common Stock | 6,696,155 | | | Market Approach | | Price Per Share | | $0.04 ($0.04) |
| | | | | Price Per Share | | $0.00 - $2.04 ($2.04) |
| | | | | Volatility | | 121.5% (121.5%) |
| Warrants | 3 | | | Income Approach | | Time to Exit (Years) | | 4.1 (4.1) |
| LLC Interests | 137,500 | | | Market Approach | | Bid/Ask | | $125,000-$150,000 ($137,500) |
| | | | | Discount for Lack of Marketability | | 10.1% (10.1%) |
| | | | | Volatility | | 57.0% (57.0%) |
| Stock Options | 44,127 | | | Income Approach | | Time to Exit (Years) | | 8.2 - 8.4 (8.2) |
| | | | | Probability of Achieving Independent Milestones | | 0.0% - 75.0% (53.2%) |
| | | | | Probability of Achieving Dependent Milestones | | 0.0% - 56.3% (11.3%) |
| Rights to Payments | 7,720,674 | | | Income Approach | | Time to Cash Flows (Years) | | 0.0 - 22.0 (12.7) |
| | | | | | | |
| | | | | | | | | | | | | | | | | | | | | | | |
| Value as of December 31, 2020 | | Valuation Approach(es) | | Unobservable Input(s) | | Range(s) (Weighted Average(a)) |
| | | | | Probability of Receiving Full Payout Upon Expiration of Escrow Period | | 50.0% (50.0%) |
| Funds Held in Escrow from Sales of Investments | $ | 161,779 | | | Income Approach | | Time to Cash Flows (Years) | | 0.37 (0.37) |
| Total | $ | 47,668,483 | | | | | | | |
(a) Weighted average based on fair value at December 31, 2020.
Valuation Methodologies and Inputs for Level 3 Assets
The following sections describe the valuation techniques and significant unobservable inputs used to measure Level 3 assets.
Preferred Stock, Preferred Units, LLC Interests, Bridge Notes and Common Stock
Preferred stock, preferred units, LLC interests, bridge notes and common stock are valued by either a market, income or hybrid approach using internal models with inputs, most of which are not market observable. Common inputs for valuing Level 3 investments include prices from recently executed private transactions in a company’s securities or unconditional firm offers, revenue multiples of comparable publicly traded companies, merger and acquisition ("M&A") transactions consummated by comparable companies, discounts for lack of marketability, rights and preferences of the class of securities we own as compared with other classes of securities the portfolio company has issued, particularly related to potential liquidity scenarios of an initial public offering ("IPO") or an acquisition transaction, estimated time to exit, volatilities of comparable publicly traded companies and management’s best estimate of risk attributable to non-performance risk. Certain securities are valued using the present value of future cash flows.
We may also consider changes in market values for sets of comparable companies when recent private transaction information is not available and/or in consideration of non-performance risk. We define non-performance risk as the risk that the price per share (or implied valuation of a portfolio company) or the effective yield of a debt security of a portfolio company, as applicable, does not appropriately represent the risk that a portfolio company with negative cash flow will be: (a) unable to raise capital, will need to be shut down and will not return our invested capital; or (b) able to raise capital, but at a valuation significantly lower than the implied post-money valuation of the last round of financing. We assess non-performance risk for each private portfolio company quarterly. Our assessment of non-performance risk typically includes an evaluation of the financial condition and operating results of the company, the company's progress towards milestones, and the long-term potential of the business and technology of the company and how this potential may or may not affect the value of the shares owned by us. An increase to the non-performance risk or a decrease in the private offering price of a future round of financing from that of the most recent round would result in a lower fair value measurement and/or a change in the distribution of value among the classes of securities we own.
Option pricing models place a high weighting on liquidation preferences, which means that small differences in how the preferences are structured can have a material effect on the fair value of our securities at the time of valuation and also on future valuations should additional rounds of financing occur with senior preferences. As such, valuations calculated by option pricing models may not increase if 1) rounds of financing occur at higher prices per share, 2) liquidation preferences include multiples on investment, 3) the amount of invested capital is small and/or 4) liquidation preferences are senior to prior rounds of financing. Additionally, an increase in the volatility assumption generally increases the enterprise value calculated in an option pricing model. An increase in the time to exit assumption also generally increases the enterprise value calculated in an option pricing model. Variations in the expected time to exit or expected volatility assumptions have a significant impact on fair value.
Bridge notes commonly contain terms that provide for the conversion of the full amount of principal, and sometimes interest, into shares of preferred stock at a defined price per share and/or the price per share of the next round of financing. The use of a discount for non-performance risk in the valuation of bridge notes would indicate the potential for conversion of only a portion of the principal, plus interest when applicable, into shares of preferred stock or the potential that a conversion event will not occur and that the likely outcome of a liquidation of assets would result in payment of less than the remaining principal outstanding of the note. An increase in non-performance risk would result in a lower fair value measurement.
Warrants and Stock Options
We use the Black-Scholes-Merton option-pricing model to determine the fair value of warrants and stock options held in our portfolio unless there is a publicly traded active market for such warrants and options or another indication of value such as a sale of the portfolio company. Option pricing models, including the Black-Scholes-Merton model, require the use of subjective input assumptions, including expected volatility, expected life, expected dividend rate, and expected risk-free rate of return. In the Black-Scholes-Merton model, variations in the expected volatility or expected term assumptions have a significant impact on fair value. Because certain securities underlying the warrants in our portfolio are not publicly traded, many of the required input assumptions are more difficult to estimate than they would be if a public market for the underlying securities existed.
An input to the Black-Scholes-Merton option-pricing model is the value per share of the type of stock for which the warrant is exercisable as of the date of valuation. This input is derived according to the methodologies discussed in "Preferred Stock, Preferred Units, LLC Interests, Bridge Notes and Common Stock."
Rights to Payments and Escrows
Rights to payments and escrows were historically valued using a probability-weighted discounted cash flow model. As part of Amgen Inc.’s acquisition of our former portfolio company, BioVex Group, Inc., we are entitled to potential future milestone payments based upon the achievement of certain regulatory and sales milestones. We are also entitled to future payments from Xenio Holdings, Inc., which merged with one of our former portfolio companies, Xenio Systems, Inc., in the event of a sale of Xenio Holdings, Inc. We are also entitled to future payments from the acquisition of Petra Pharma Corporation by an undisclosed acquirer unrelated to the Company. We assign probabilities to the achievements of the various milestones. Milestones identified as independent milestones can be achieved irrespective of the achievement of other contractual milestones. Dependent milestones are those that can only be achieved after another, or series of other, milestones are achieved. The interest rates used in these models are observable inputs from sources such as the published interest rates for corporate bonds of the acquiring or comparable companies.
Changes in Valuation Approaches
During the year ended December 31, 2020, the following changes in valuation methodology occurred since December 31, 2019:
•We changed the valuation methodology of our securities of Nanosys, Inc. from the market approach to the income approach to reflect a change in the financing status of the business.
•We changed the valuation methodology of our securities of D-Wave Systems, Inc. (now DWSI Holdings, Inc.) from the market approach to the income approach owing to consummation of new financing.
•We changed the valuation methodology of our securities of Accelerator IV-New York Corporation from the equity method of accounting to the market approach.
•We changed the valuation methodology of our secured convertible bridge note of Lodo Therapeutics Corporation from the market approach to the income approach owing to financing-related inputs.
The following chart shows the components of change in the financial assets categorized as Level 3 for the year ended December 31, 2020.
| | | | | | | | | | | | | | | | | | | | | | | | | | | | | | | | | | | | | | | | | | | | | | | |
| | Beginning
Balance
1/1/2020 | | Total
Realized
Gains (Loss)
Included in
Changes in
Net Assets | | Transfers | | Total
Unrealized
(Depreciation) Appreciation
Included in
Changes in
Net Assets | | Investments in
Portfolio
Companies,
Interest on
Bridge Notes,
and
Amortization
of Loan
Fees, Net | | Disposals
and
Settlements | | Ending
Balance
12/31/2020 | | Amount of Total
(Depreciation) Appreciation for the
year Included in
Changes in Net
Assets Attributable
to the Change in
Unrealized Gains or
Losses Relating to
Assets Still Held at
the Reporting Date |
| | | | | | | | | | | | | | | |
| Preferred Stock | $ | 42,949,793 | | | $ | 3,539,069 | | 1 | $ | 2,647,689 | | 3 | $ | (8,811,092) | | | 0 | | | $ | (9,858,771) | | | $ | 30,466,688 | | | $ | (9,587,091) | |
| | | | | | | | | | | | | | | |
| Bridge Notes | 1,455,248 | | | 0 | | | 0 | | | 289,565 | | | 53,051 | | | (689,966) | | | 1,107,898 | | | (48,166) | |
| | | | | | | | | | | | | | | |
| Common Stock | 1,018,118 | | | (7,604,926) | | 2 | 7,715,719 | | 4 | 7,066,544 | | | 103,391 | | 5 | (269,032) | | | 8,029,814 | | | (603,737) | |
| | | | | | | | | | | | | | | |
| Warrants | 3 | | | (64,694) | | 2 | 0 | | | 65,250 | | | 0 | | | (556) | | | 3 | | | 0 | |
| | | | | | | | | | | | | | | |
| Senior Secured Debt | 0 | | | (2,512,177) | | 2 | 0 | | | 2,533,766 | | | 0 | | | (21,589) | | | 0 | | | 0 | |
| | | | | | | | | | | | | | | |
| LLC Interests | 147,330 | | | 0 | | | 0 | | | (9,830) | | | 0 | | | 0 | | | 137,500 | | | (9,830) | |
| | | | | | | | | | | | | | | |
| Stock Options | 61,514 | | | 0 | | | 0 | | | (17,387) | | | 0 | | | 0 | | | 44,127 | | | (17,387) | |
| | | | | | | | | | | | | | | |
| Rights to Payments | 1,795,316 | | | 23,976 | | 2 | 0 | | | 86,890 | | | 5,859,686 | | 5 | (45,194) | | | 7,720,674 | | | 86,890 | |
| | | | | | | | | | | | | | | |
| Funds Held in Escrow from Sales of Investments | 0 | | | 0 | | | 0 | | | 1,139 | | | 160,640 | | 5 | 0 | | | 161,779 | | | 1,139 | |
| | | | | | | | | | | | | | | |
| Total | $ | 47,427,322 | | | $ | (6,618,752) | | | $ | 10,363,408 | | | $ | 1,204,845 | | | $ | 6,176,768 | | | $ | (10,885,108) | | | $ | 47,668,483 | | | $ | (10,178,182) | |
1 Represents gross realized gains of $7,963,973, net of gross realized losses of $4,424,904.
2 Represents gross realized gains or gross realized losses.
3 The transfer in "Preferred Stock" was owing to TheMaven, Inc. amending and restating its certificate of incorporation and the Company's shares of Series H Preferred Stock are now being fair valued by the Company's Board of Directors.
4 Historically, Accelerator IV-New York Corporation ("Accelerator") was valued under the equity method of accounting. The Company received distributions for its pro rata share of the distribution received by Accelerator from the acquisition of Petra Pharma Corporation. As a result of this transaction, Accelerator is now fair valued by the Company's Board of Directors. Also included in this amount was a transfer owing to TheMaven, Inc. amending and restating its certificate of incorporation and shares of the Company's shares of Series I and Series J Preferred Stock converting to Common Stock and the shares of Common Stock are now being fair valued by the Company's Board of Directors.
5 The Company received distributions of shares of Common Stock of Ravenna Pharmaceuticals, Inc., Rights to Milestone Payments and Funds Held in Escrow from Sales of Investments for its pro rata share of the proceeds from the acquisition of Petra Pharma Corporation.
We elected to use beginning of the year values to recognize transfers in and out of Level 3 investments, when transfers occur.
The accompanying notes are an integral part of these consolidated financial statements.
38
NOTE 5. INDUSTRY DIVERSIFICATION
The following table shows the percentage of our net assets invested by industry as of December 31, 2020.
| | | | | | | | | | | | | | | | | | | | | | | |
| Industry | Value as of December 31, 2020 | | % of Net Assets | | Value as of December 31, 2020 | | % of Net Assets |
| Application Software | | | | | $ | 2,486,520 | | | 2.6% |
| Unaffiliated Portfolio Companies | $ | 0 | | | 0.0% | | | | |
| Non-Controlled Affiliated Portfolio Companies | 2,486,520 | | | 2.6% | | | | |
| Controlled Affiliated Portfolio Companies | 0 | | | 0.0% | | | | |
| Asset Management & Custody Banks | | | | | 137,500 | | | 0.1% |
| Unaffiliated Portfolio Companies | 137,500 | | | 0.1% | | | | |
| Non-Controlled Affiliated Portfolio Companies | 0 | | | 0.0% | | | | |
| Controlled Affiliated Portfolio Companies | 0 | | | 0.0% | | | | |
| Biotechnology | | | | | 1,773,352 | | | 1.8% |
| Unaffiliated Portfolio Companies | 1,773,352 | | | 1.8% | | | | |
| Non-Controlled Affiliated Portfolio Companies | 0 | | | 0.0% | | | | |
| Controlled Affiliated Portfolio Companies | 0 | | | 0.0% | | | | |
| Construction Machinery & Heavy Trucks | | | | | 350,147 | | | 0.4% |
| Unaffiliated Portfolio Companies | 350,147 | | | 0.4% | | | | |
| Non-Controlled Affiliated Portfolio Companies | 0 | | | 0.0% | | | | |
| Controlled Affiliated Portfolio Companies | 0 | | | 0.0% | | | | |
| Communications Equipment | | | | | 3,311,148 | | | 3.4% |
| Unaffiliated Portfolio Companies | 3,311,148 | | | 3.4% | | | | |
| Non-Controlled Affiliated Portfolio Companies | 0 | | 0.0% | | | | |
| Controlled Affiliated Portfolio Companies | 0 | | 0.0% | | | | |
| Fertilizers & Agricultural Chemicals | | | | | 13,183,488 | | | 13.7% |
| Unaffiliated Portfolio Companies | 13,183,488 | | | 13.7% | | | | |
| Non-Controlled Affiliated Portfolio Companies | 0 | | | 0.0% | | | | |
| Controlled Affiliated Portfolio Companies | 0 | | | 0.0% | | | | |
| Health Care Equipment | | | | | 1,578,339 | | | 1.6% |
| Unaffiliated Portfolio Companies | 0 | | | 0.0% | | | | |
| Non-Controlled Affiliated Portfolio Companies | 1,578,339 | | | 1.6% | | | | |
| Controlled Affiliated Portfolio Companies | 0 | | | 0.0% | | | | |
| Health Care Technology | | | | | 6,261,507 | | | 6.5% |
| Unaffiliated Portfolio Companies | 2,286,493 | | | 2.4% | | | | |
| Non-Controlled Affiliated Portfolio Companies | 3,975,014 | | | 4.1% | | | | |
| Controlled Affiliated Portfolio Companies | 0 | | | 0.0% | | | | |
| Interactive Media & Services | | | | | 8,900,676 | | | 9.2% |
| Unaffiliated Portfolio Companies | 0 | | | 0.0% | | | | |
| Non-Controlled Affiliated Portfolio Companies | 8,900,676 | | | 9.2% | | | | |
| Controlled Affiliated Portfolio Companies | 0 | | | 0.0% | | | | |
| Life Sciences Tools & Services | | | | | 3,075,467 | | | 3.2% |
| Unaffiliated Portfolio Companies | 0 | | | 0.0% | | | | |
| Non-Controlled Affiliated Portfolio Companies | 3,075,467 | | | 3.2% | | | | |
| Controlled Affiliated Portfolio Companies | 0 | | | 0.0% | | | | |
| Pharmaceuticals | | | | | 7,087,855 | | | 7.4% |
| Unaffiliated Portfolio Companies | 7,087,855 | | | 7.4% | | | | |
| Non-Controlled Affiliated Portfolio Companies | 0 | | | 0.0% | | | | |
| Controlled Affiliated Portfolio Companies | 0 | | | 0.0% | | | | |
| | | | | | | | | | | | | | | | | | | | | | | |
| Industry | Value as of December 31, 2020 | | % of Net Assets | | Value as of December 31, 2020 | | % of Net Assets |
| Research & Consulting Services | | | | | $ | 1,043,699 | | | 1.1% |
| Unaffiliated Portfolio Companies | $ | 374,689 | | | 0.4% | | | | |
| Non-Controlled Affiliated Portfolio Companies | 669,010 | | | 0.7% | | | | |
| Controlled Affiliated Portfolio Companies | 0 | | | 0.0% | | | | |
| Restaurants | | | | | 5,579,636 | | | 5.8% |
| Unaffiliated Portfolio Companies | 0 | | | 0.0% | | | | |
| Non-Controlled Affiliated Portfolio Companies | 5,579,636 | | | 5.8% | | | | |
| Controlled Affiliated Portfolio Companies | 0 | | | 0.0% | | | | |
| Semiconductors | | | | | 836,798 | | | 0.9% |
| Unaffiliated Portfolio Companies | 0 | | | 0.0% | | | | |
| Non-Controlled Affiliated Portfolio Companies | 836,798 | | | 0.9% | | | | |
| Controlled Affiliated Portfolio Companies | 0 | | | 0.0% | | | | |
| Specialty Chemicals | | | | | 2,337,735 | | | 2.5% |
| Unaffiliated Portfolio Companies | 1,793,062 | | | 1.9% | | | | |
| Non-Controlled Affiliated Portfolio Companies | 544,673 | | | 0.6% | | | | |
| Controlled Affiliated Portfolio Companies | 0 | | | 0.0% | | | | |
| Technology Hardware, Storage & Peripherals | | | | | 14,710,832 | | | 15.3% |
| Unaffiliated Portfolio Companies | 1,246,161 | | | 1.3% | | | | |
| Non-Controlled Affiliated Portfolio Companies | 13,464,671 | | | 14.0% | | | | |
| Controlled Affiliated Portfolio Companies | 0 | | | 0.0% | | | | |
| Trading Companies & Distributors | | | | | 7,148,372 | | | 7.4% |
| Unaffiliated Portfolio Companies | 7,148,372 | | | 7.4% | | | | |
| Non-Controlled Affiliated Portfolio Companies | 0 | | | 0.0% | | | | |
| Controlled Affiliated Portfolio Companies | 0 | | | 0.0% | | | | |
| Miscellaneous Common Stocks Industries | | | | | 3,974,873 | | | 4.1% |
| Unaffiliated Portfolio Companies | 3,974,873 | | | 4.1% | | | | |
| Non-Controlled Affiliated Portfolio Companies | 0 | | | 0.0% | | | | |
| Controlled Affiliated Portfolio Companies | 0 | | | 0.0% | | | | |
| Total | $ | 83,777,944 | | | | | $ | 83,777,944 | | | |
NOTE 6. DERIVATIVES
The Company purchased and sold call options during the year ended December 31, 2020. A call option gives its holder the right to buy a specific security at a specific price (known as the exercise strike price) by a certain date.
Transactions in call options during the year ended December 31, 2020, were as follows:
| | | | | | | | | | | | | | |
| | Number of Contracts | | Premium |
| | | | |
| Call options outstanding as of December 31, 2019 | | 0 | | | $ | 0 | |
| Call options purchased | | (65,000) | | | (523,562) | |
| Call options written | | 65,000 | | | 252,258 | |
| Purchased call options expired | | 65,000 | | | 0 | |
| Written call options expired | | (65,000) | | | 0 | |
| Call options outstanding as of December 31, 2020 | | 0 | | | $ | (271,304) | |
The following table presents the effect of derivatives held during the year ended December 31, 2020, along with the respective location in the consolidated financial statements.
CONSOLIDATED STATEMENT OF OPERATIONS:
| | | | | | | | | | | | | | | | | | | | | | | |
| Derivatives | | Location | | Net Realized Gain (Loss) | | Net Change in Unrealized (Depreciation) Appreciation | |
| Call Options | | Net realized loss from investments | | $ | (271,304) | | | -- | |
| | | | | | | |
NOTE 7. OFFICERS' AND BOARD OF DIRECTORS' COMPENSATION
The aggregate compensation (salaries, bonus, 401(k) employer match, medical and dental benefits) paid by the Company during the year ended December 31, 2020, to its officers amounted to $1,982,786, including $628,560 in bonuses paid in 2020. In addition, and similar to prior years, the Compensation Committee awarded a deferred bonus as of December 31, 2020, to certain of the Company's officers of $220,440 payable only upon achievement of certain metrics defined by the Compensation Committee over the next two years. As of December 31, 2020, the portion of the deferred bonus in the amount of $91,483 was included in accounts payable, which represented the time-elapsed portion of the deferred bonus accrued on a straight-line basis through December 31, 2020 based on each metric measurement date.
The Compensation Committee also has determined that the metrics for payment of $381,963 of the deferred compensation from 2019 were met as of December 31, 2020 and is payable to certain of the Company's officers. The 2020 expense of $255,916 represents the additional time-elapsed portion of the 2019 deferred bonus accrued on a straight-line basis during the year ended December 31, 2020, based on the metric measurement date.
The aggregate compensation paid by the Company to the independent members of its Board of Directors during the year ended December 31, 2020 was $266,587.
Certain officers and directors currently and may in the future serve as members of the board of directors of our portfolio companies, including our controlled portfolio companies. These officers and directors do not receive any compensation for serving in such roles directly from the portfolio companies. Any such cash compensation paid by portfolio companies to members of their respective boards of directors is paid directly to the Company. In the case of securities-based compensation (restricted stock or stock options), the officer or director due such compensation assigns all beneficial interest, including but not limited to economic benefit and voting control, to such securities over to the Company.
NOTE 8. EMPLOYEE BENEFITS
401(k) Plan
We adopted a 401(k) Plan covering substantially all of our employees. Matching contributions to the plan are at the discretion of the Compensation Committee. For the year ended December 31, 2020, the Compensation Committee approved a 100 percent match, which amounted to $110,500.
Medical Benefit Retirement Plan
We historically administered a plan to provide medical and dental insurance for retirees and their spouses who, at the time of their retirement, attained certain years of service with us and a certain age (the "Medical Benefit Retirement Plan"). On April 27, 2017, the Board of Directors terminated the plan. The termination does not affect benefits accrued by former employees who are grandfathered under the former terms of the plan, and the termination of the plan does not affect benefits accrued by certain former employees who were grandfathered under the amended terms of the plan. The Medical Benefit Retirement Plan was terminated for all other employees.
The plan is unfunded and has no assets. The following disclosures about changes in the benefit obligation under the plan to provide medical and dental insurance for retirees are as of the measurement date of December 31, 2020:
| | | | | |
| 2020 |
| |
| Accumulated post-retirement benefit obligation - December 31, 2019 | $ | 1,076,554 | |
| Interest cost | 30,575 | |
| Actuarial gain | (405,110) | |
| Benefits paid | (42,922) | |
| Accumulated post-retirement benefit obligation - December 31, 2020 | $ | 659,097 | |
In accounting for the plan, the assumption made for the discount rate was 2 percent for the year ended December 31, 2020. The discount rate was calculated using the December 31, 2020 FTSE Pension Liability Index. The assumed health care cost trend rates is assumed to be 6.25 percent in 2021 grading down to 5.75 percent uniformly over 2 years and then following the Getzen model thereafter for medical and 5 percent per year for dental.
The following is the net periodic post-retirement benefit cost for the year ended December 31, 2020:
| | | | | |
| 2020 |
| Interest cost on accumulated post-retirement benefit obligation | $ | 30,575 | |
| Amortization of net losses | 10,945 | |
| Net periodic post-retirement benefit cost | $ | 41,520 | |
| |
The Company estimates the following benefits to be paid in each of the following years:
| | | | | |
| 2021 | $ | 36,608 | |
| 2022 | 58,834 | |
| 2023 | 60,465 | |
| 2024 | 61,565 | |
| 2025 | 54,413 | |
| 2026 through 2030 | 173,516 | |
| |
For the year ended December 31, 2020, net unrecognized actuarial gain of $416,055 resulted primarily from the decrease in the discount rate and decrease in premium cost for certain participants in the plan, which represents $405,110 of actuarial gain arising during the year, and by a reclassification adjustment of $10,945 that decreased the net periodic benefit cost for the year.
Executive Mandatory Retirement Benefit Plan
On May 5, 2011, the Board of Directors terminated the Amended and Restated Executive Mandatory Retirement Benefit Plan. Our former President accrued benefits under this plan prior to his retirement, and the termination of this plan has no impact on his accrued benefits. At December 31, 2020, we had $183,267 accrued for benefits for this former employee under the plan, which is included in "Post-retirement plan liabilities" on the Company's Consolidated Statement of Assets and Liabilities.
NOTE 9. INCOME TAXES
The Company filed for the 1999 tax year to elect treatment as a RIC under Subchapter M of the Code and qualified for the same treatment for the years 2000 through 2015, as well as 2017 and 2019. The Company did not qualify as a RIC under Subchapter M of the Code in 2016, 2018 and this year, 2020. The Company did not have net taxable income in 2016, 2018 and 2020, so the failure to qualify as a RIC did not result in a tax liability for the Company. As a C Corporation, the Company is permitted to use historical operating loss carryforwards to offset income and gains for tax purposes. As of December 31, 2020, the Company had approximately $76.1 million in operating loss carryforwards that begin to expire in 2026.
Under certain circumstances, even if we qualified for Subchapter M treatment for a given year, we might act in a subsequent year to ensure that we would be taxed in that subsequent year as a C Corporation, rather than as a RIC. We will fail to qualify for RIC tax treatment for a taxable year if we do not satisfy the 90 percent Income Test or Annual Distribution Requirement for such year. In the event we do not satisfy the 90 percent Income Test, the Diversification Tests or the Annual Distribution Requirement for any taxable year, we will be subject to federal tax with respect to all our taxable income, whether or not distributed. In addition to the corporate tax that would be paid by the Company, all our distributions to shareholders in that situation generally will be taxable as ordinary dividends and generally subject to up to a 30 percent withholding tax if received by a non-U.S. shareholder, although such dividends may qualify for long-term capital gain treatment as "qualified dividends" for U.S. shareholders meeting certain holding period requirements. If the aggregate values of our non-qualifying assets remain below 50 percent of total assets and no non-qualifying asset represents more than 25 percent of the total assets, we will continue to pass the Diversification Tests. Rather than selling portfolio companies that are performing well in order to pass our RIC diversification tests, we may opt instead not to qualify as a RIC. We will choose to take such action only if we believe that the result of the action will benefit the Company and our shareholders.
Historically, we invested in D-Wave Systems, and now DWSI, through Parallel Universes, Inc., a Delaware company ("Parallel Universes"), which held shares of D-Wave Systems, Inc. through a Canadian limited company, 4169841 Canada Ltd. ("CanCo"). This structure could have resulted in taxation at the Paralell Universes and/or CanCo levels on realized gains on the shares of D-Wave Systems that would not be offset by any current or carryforward losses of the Company. In October 2020, CanCo distributed our shares of DWSI to Parallel Universes in a return of capital. Parallel Universes then distributed the shares to 180PH in exchange for 180PH's ownership of Parallel Universes. As of that date, 180PH directly owns shares of DWSI and no longer has direct or indirect ownership of Parallel Universes or CanCo. As such, future realized gains, if any, on the Company's shares of D-Wave Systems may be able to be offset by current or carryforward losses of the Company should such losses exist at the time of realization.
The Company's status as a RIC is irrevocable, but qualification is measured annually. Given the Company's status as a RIC and that the ability or inability to use such operating loss carryforwards depends on qualification metrics measured in each taxable year separate from prior years, the Company does not include a deferred tax asset and valuation allowance on its Consolidated Statement of Assets and Liabilities.
For federal tax purposes, the Company’s 2017 through 2019 tax years remain open for examination by the tax authorities under the normal three-year statute of limitations. Generally, for New Jersey state tax purposes, the Company’s 2016 through 2019 tax years remain open for examination by the tax authorities under a four-year statute of limitations. The Company filed its 2019 federal and state taxes in 2020.
For the year ended December 31, 2020, the Company recorded a consolidated expense of $913 in federal, state and local income taxes.
We pay federal, state and local taxes on behalf of Ventures, which is taxed as a C Corporation.
The Company updated certain components of capital accounts on a tax-basis in 2020, to reflect a return of capital statement of position ("ROCSOP") adjustment. This ROCSOP adjustment includes the reclassification of $505,451 of accumulated net operating loss and $28,923 of accumulated net realized loss into additional paid in capital. This reclassification results primarily from certain non-deductible expenses and net operating loss. There is no impact to net asset value per share as a result of this ROCSOP adjustment. This adjustment may change in future years if the Company does not qualify as a RIC in a given tax year.
For the year ended December 31, 2020, the Company recorded aggregate unrealized appreciation of $22,390,901, aggregate unrealized depreciation of $18,791,602 and net unrealized appreciation is $3,599,299. The aggregate book cost of investments is $80,178,645. For the year ended December 31, 2020, the Company recorded aggregate tax unrealized appreciation of $22,276,859, aggregate tax unrealized depreciation of $18,361,807 and net tax unrealized appreciation is $3,915,052. The aggregate tax cost of investments is $79,862,892.
As of December 31, 2020, we had post-enactment loss carryforwards under the provisions of the Regulated Investment Company Modernization Act of 2010 (the "Act") of $20,326,815 long term. Capital losses in the current year of $1,071,994 may be carried back 3 years or carried forward 5 years. As of December 31, 2020, we had cumulative capital losses, which were derived during years when the Company failed as a RIC, totaling $16,928,250, which may be carried back 3 years or carried forward 5 years. As of December 31, 2020, we had cumulative capital losses, which were derived during years when the Company qualified as a RIC, totaling $3,398,565. Post-enactment losses have no expiration date in years where we qualify as a RIC.
On December 22, 2017, the Tax Cuts and Jobs Act of 2017 (the "2017 Act") was enacted, which among other changes, lowered the tax rates for corporations and how future loss carryforwards can be used against future gains. The change of the federal corporate tax rate from 35 percent to 21 percent in the 2017 Act may impact future decisions regarding the issuance of deemed dividends should the Company failed to qualify as a RIC under Subchapter M of the Code and be in a net taxable gain position on investments.
NOTE 10. COMMITMENTS AND CONTINGENCIES
As of December 31, 2020, the Company has no commitment or contingencies to invest additional capital in any of its privately held portfolio companies. Portfolio companies may seek additional capital in the future and any decision by the Company to not participate in the round of financing could result in outcomes that negatively impact the value of the Company's securities of those portfolio companies.
On March 23, 2017, we signed a month-to-month lease for approximately 1,250 square feet of office space located at 7 N. Willow Street, Suite 4B, Montclair, New Jersey. Upon an event of default, the lease provides that the landlord may terminate the lease and require us to pay all rent that would have been payable during the remainder of the lease or until the date the landlord re-enters the premises.
NOTE 11. PORTFOLIO PURCHASES AND SALES
During the year ended December 31, 2020:
| | | | | | | | | | | |
| Company | Purchases/Cost | | Sales Proceeds/Distributions |
| Adesto Technologies Corporation | $ | 0 | | | $ | 2,451,554 | |
| Alta Equipment Group, Inc. | 6,005,756 | | | 360,272 | |
| Barnes & Noble Education, Inc. | 612,472 | | | 361,273 | |
| Delta Apparel, Inc. | 350,142 | | | 466,274 | |
| Emcore Corp. | 55,158 | | | 1,938,922 | |
| Franchise Group, Inc. | 4,500,003 | | | 6,743,460 | |
| Intest Corporation | 110,253 | | | 118,261 | |
| Iteris, Inc. | 0 | | | 1,680,253 | |
| Kirkland's, Inc. | 477,091 | | | 1,033,105 | |
| Lantronix, Inc. | 865,283 | | | 2,686,854 | |
| Manitex International, Inc. | 290,349 | | | 0 | |
| Mersana Therapeutics, Inc. | 0 | | | 734,820 | |
| OpGen Inc. | 0 | | | 8,671 | |
| Perceptron, Inc. | 857,873 | | | 1,365,744 | |
| Perion Network Ltd. | 2,692,217 | | | 3,582,543 | |
| Potbelly Corporation | 1,360,800 | | | 938,366 | |
| Quantum Corporation | 304,728 | | | 2,367,635 | |
| Sonim Technologies, Inc. | 4,541,166 | | | 0 | |
| Synacor Inc. (1) | 157,038 | | | 0 | |
| TheStreet, Inc. | 0 | | | 45,194 | |
| Miscellaneous Common Stocks (2) | 4,261,001 | | | 1,106,367 | |
| Total Public Portfolio Purchases/Sales Proceeds | $ | 27,441,330 | | | $ | 27,989,568 | |
| | | |
| Accelerator IV-New York Corporation (3) | $ | 0 | | | $ | 305,169 | |
| Petra Pharma Corporation (4) | 0 | | | 10,548,737 | |
| Produced Water Absorbents, Inc. | 0 | | | 87,500 | |
| Ravenna Pharmaceuticals, Inc. (5) | 103,391 | | | 0 | |
| Total Private Portfolio Cost and Distributions | $ | 103,391 | | | $ | 10,941,406 | |
| Total Portfolio Purchases/Cost and Sales Proceeds/Distributions | $ | 27,544,721 | | | $ | 38,930,974 | |
Note: The table above does not include transactions in short-term call options whose maturities at the time of acquisition were one year or less during the year ended December 31, 2020.
(1) During the year ended December 31, 2020, the Company received restricted stock units from Synacor, Inc. ("SYNC") which were issued to the Company for Kevin Rendino's service on the Board of Directors of SYNC. These restricted stock units had a cost basis of $59,170 on the date the restricted stock units vested. Amounts related to restricted stock units are also presented as "Fee income for providing managerial assistance to portfolio companies-non-cash" on the Company's Consolidated Statement of Cash Flows.
(2) Miscellaneous Common Stocks are unrestricted common stocks of publicly traded companies that the Company has not disclosed publicly.
(3) During the year ended December 31, 2020, the Company received distributions of $305,169 from Accelerator IV-New York Corporation ("Accelerator") which reduced carrying cost of Accelerator of $180,776 to $0. The excess amount over carrying cost was recorded as dividend.
(4) During the year ended December 31, 2020, the Company received distributions of financial instruments, valued at $6,123,717 on the date issued, for the acquisition of Petra Pharma Corporation by an undisclosed acquirer unrelated to the Company.
(5) During the year ended December 31, 2020, the Company received shares of common stock from Ravenna Pharmaceuticals, Inc. as part of the consideration for the acquisition of Petra Pharma Corporation by an undisclosed acquirer unrelated to the Company. These shares of common stock had a cost basis of $103,391 on the date issued.
NOTE 12. SHARE REPURCHASE PROGRAM
On August 10, 2020, our Board reauthorized the repurchase of up to $2.5 million of the Company's common stock within a six-month period from the date of notice to investors, which notice was mailed on or about August 17, 2020. As of December 31, 2020, no repurchases had occurred.
On February 19, 2021, our Board reauthorized the repurchase of up to $2.5 million of the Company's common stock within a six-month period from the date of notice to investors, which notice was mailed on or about February 26, 2021.
NOTE 13. RELATED PARTY TRANSACTIONS
We have historically provided managerial assistance to some of our portfolio companies, including serving as members of the board of directors. In certain cases, we receive fees for providing such assistance. During the year ended December 31, 2020, we received fees totaling $59,170 in non-cash, included in the Company's Consolidated Statement of Operations in "Fee income for providing managerial assistance to portfolio companies."
NOTE 14. SUBSEQUENT EVENTS
The Company has evaluated subsequent events as of December 31, 2020, through the date these financial statements were issued, and include the following.
On February 10, 2021, SYNC, entered into an Agreement and Plan of Merger (the “Merger Agreement”), by and among Synacor, Inc. ("SYNC"), CLP SY Holding, LLC, (“CLP Parent”), and SY Merger Sub Corporation, an indirect wholly-owned subsidiary of CLP Parent (“Merger Sub”), pursuant to which Merger Sub will commence a tender offer (the “Offer”) to purchase any and all of the issued and outstanding shares of the SYNC’s common stock, par value $0.01 per share (the “SYNC Shares”), at a price per SYNC Share of $2.20, in cash, without interest and subject to any withholding taxes required by applicable law (such amount or any higher amount per SYNC Share that may be paid pursuant to the Offer, the “Offer Price”). Pursuant to the Merger Agreement, Merger Sub has agreed to commence the Offer as promptly as reasonably practicable (but in no event later than 15 business days) after the date of the Merger Agreement.
NOTE 15. INVESTMENTS AND ADVANCES TO AFFILIATES - SCHEDULE 12-14
| | | | | | | | | | | | | | | | | | | | | | | | | | | | | | | | | | | | | | | | | | | | | | | | | | |
| Name of Issuer | | Title of Issue or Nature of Indebtedness (A) | | Amount of Dividends or Interest Credited to Income (B) | | Net Realized Gain (Loss) | | Value as of December 31, 2019 | | Gross Additions (C) | | Gross Reductions (D) | | Net Change in Unrealized Appreciation (Depreciation) | | Value as of December 31, 2020 |
| NON-CONTROLLED AFFILIATED PRIVATELY HELD COMPANIES(E): | | | | | | | | | | | | | | | | |
| ABSMaterials, Inc. | | Series A Convertible Preferred Stock | | $ | 0 | | | $ | 0 | | | $ | 22,297 | | | $ | 6,394 | | | $ | 0 | | | $ | 6,394 | | | $ | 28,691 | |
| | Series B Convertible Preferred Stock | | 0 | | | 0 | | | 306,556 | | | 37,265 | | | 0 | | | 37,265 | | | 343,821 | |
| | Secured Convertible Bridge Note | | 10,027 | | | 0 | | | 162,134 | | | 10,027 | | | 0 | | | 0 | | | 172,161 | |
| Accelerator IV-New York Corporation | | Series A Common Stock | | $ | 124,393 | | | $ | 0 | | | $ | 203,677 | | | $ | 465,333 | | | $ | 0 | | | $ | 669,010 | | | $ | 669,010 | |
| Black Silicon Holdings, Inc. | | Series A Convertible Preferred Stock | | $ | 0 | | | $ | 0 | | | $ | 0 | | | $ | 0 | | | $ | 0 | | | $ | 0 | | | $ | 0 | |
| | Series A-1 Convertible Preferred Stock | | 0 | | | 0 | | | 0 | | | 0 | | | 0 | | | 0 | | | 0 | |
| | Series A-2 Convertible Preferred Stock | | 0 | | | 0 | | | 0 | | | 0 | | | 0 | | | 0 | | | 0 | |
| | Series B-1 Convertible Preferred Stock | | 0 | | | 0 | | | 0 | | | 0 | | | 0 | | | 0 | | | 0 | |
| | Series C Convertible Preferred Stock | | 0 | | | 0 | | | 0 | | | 0 | | | 0 | | | 0 | | | 0 | |
| | Secured Convertible Bridge Notes (F) | | 0 | | | 0 | | | 360,465 | | | 476,333 | | | 0 | | | 476,333 | | | 836,798 | |
| EchoPixel, Inc. | | Series Seed Convertible Preferred Stock | | $ | 0 | | | $ | 0 | | | $ | 1,369,554 | | | $ | 0 | | | $ | (484,089) | | | $ | (484,089) | | | $ | 885,465 | |
| | Series Seed-2 Convertible Preferred Stock | | 0 | | | 0 | | | 488,352 | | | 0 | | | (172,468) | | | (172,468) | | | 315,884 | |
| | Series A-2 Convertible Preferred Stock | | 0 | | | 0 | | | 556,486 | | | 0 | | | (179,496) | | | (179,496) | | | 376,990 | |
| Essential Health Solutions, Inc. | | Common Stock | | $ | 0 | | | $ | 0 | | | $ | 143,349 | | | $ | 0 | | | $ | (143,349) | | | $ | (143,349) | | | $ | 0 | |
| | Series A Convertible Preferred Stock | | 0 | | | 0 | | | 2,868,134 | | | 0 | | | (2,540,227) | | | (2,540,227) | | | 327,907 | |
| | Convertible Bridge Note | | 4,011 | | | 0 | | | 50,000 | | | 0 | | | (38,804) | | | (38,804) | | | 11,196 | |
| HALE.life Corporation | | Common Stock | | $ | 0 | | | $ | 0 | | | $ | 117,016 | | | $ | 0 | | | $ | (5,269) | | | $ | (5,269) | | | $ | 111,747 | |
| | Series Seed-1 Convertible Preferred Stock | | 0 | | | 0 | | | 1,613,660 | | | 18,388 | | | 0 | | | 18,388 | | | 1,632,048 | |
| | Series Seed-2 Convertible Preferred Stock | | 0 | | | 0 | | | 1,853,786 | | | 38,330 | | | 0 | | | 38,330 | | | 1,892,116 | |
| | | | | | | | | | | | | | | | |
| | | | | | | | | | | | | | | | | | | | | | | | | | | | | | | | | | | | | | | | | | | | | | | | | | |
| Name of Issuer | | Title of Issue or Nature of Indebtedness (A) | | Amount of Dividends or Interest Credited to Income (B) | | Net Realized Gain (Loss) | | Value as of December 31, 2019 | | Gross Additions (C) | | Gross Reductions (D) | | Net Change in Unrealized Appreciation (Depreciation) | | Value as of December 31, 2020 |
| NON-CONTROLLED AFFILIATED PRIVATELY HELD COMPANIES(E): | | | | | | | | | | | | | | | | |
| Produced Water Absorbents, Inc. | | Warrants for Common Stock | | $ | 0 | | | $ | (64,694) | | | $ | 0 | | | $ | 0 | | | $ | 0 | | | $ | 65,250 | | | $ | 0 | |
| | Common Stock | | 0 | | | (7,604,926) | | | 0 | | | 0 | | | 0 | | | 7,670,281 | | | 0 | |
| | Senior Secured Debt (G) | | 0 | | | (2,512,177) | | | 0 | | | 0 | | | 0 | | | 2,533,766 | | | 0 | |
| TARA Biosystems, Inc. | | Common Stock | | $ | 0 | | | $ | 0 | | | $ | 757,753 | | | $ | 0 | | | $ | (204,851) | | | $ | (204,851) | | | $ | 552,902 | |
| | Series A Convertible Preferred Stock | | 0 | | | 0 | | | 3,196,883 | | | 0 | | | (752,199) | | | (752,199) | | | 2,444,684 | |
| | Series A-2 Convertible Preferred Stock | | 0 | | | 0 | | | 101,062 | | | 0 | | | (23,181) | | | (23,181) | | | 77,881 | |
| Total Non-Controlled Affiliated Privately Held Companies | | | | $ | 138,431 | | | $ | (10,181,797) | | | $ | 14,171,164 | | | $ | 1,052,070 | | | $ | (4,543,933) | | | $ | 6,971,084 | | | $ | 10,679,301 | |
| NON-CONTROLLED AFFILIATED PUBLICLY TRADED SECURITIES(E): | | | | | | | | | | | | | | | | |
| Potbelly Corporation | | Common Stock | | $ | 0 | | | $ | 17,559 | | | $ | 4,735,047 | | | $ | 844,589 | | | $ | 0 | | | $ | 404,595 | | | $ | 5,579,636 | |
| Quantum Corporation | | Common Stock | | $ | 0 | | | $ | 1,515,118 | | | $ | 12,784,660 | | | $ | 0 | | | $ | (3,696,735) | | | $ | (3,148,946) | | | $ | 9,087,925 | |
| Sonim Technologies, Inc. | | Common Stock | | $ | 0 | | | $ | 0 | | | $ | 0 | | | $ | 4,376,746 | | | $ | 0 | | | $ | (164,420) | | | $ | 4,376,746 | |
| Synacor, Inc. | | Common Stock | | $ | 0 | | | $ | 0 | | | $ | 2,450,061 | | | $ | 0 | | | $ | (77,351) | | | $ | (234,389) | | | $ | 2,372,710 | |
| | Stock Options | | 0 | | | 0 | | | 61,514 | | | 0 | | | (17,387) | | | (17,387) | | | 44,127 | |
| | Restricted Stock Units | | 0 | | | 0 | | | 14,384 | | | 55,299 | | | 0 | | | 55,299 | | | 69,683 | |
| TheMaven, Inc. | | Series H Convertible Preferred Stock | | $ | 0 | | | $ | 0 | | | $ | 2,647,689 | | | $ | 0 | | | $ | (339,777) | | | $ | (339,777) | | | $ | 2,307,912 | |
| | Series I Convertible Preferred Stock | | 0 | | | 0 | | | 6,615,833 | | | 0 | | | (6,615,833) | | | (6,615,833) | | | 0 | |
| | Series J Convertible Preferred Stock | | 0 | | | 0 | | | 896,209 | | | 0 | | | (896,209) | | | (896,209) | | | 0 | |
| | Common Stock | | 0 | | | 0 | | | 0 | | | 6,592,764 | | | 0 | | | 6,592,764 | | | 6,592,764 | |
| Total Non- Controlled Affiliated Publicly Traded Securities | | | | $ | 0 | | | $ | 1,532,677 | | | $ | 30,205,397 | | | $ | 11,869,398 | | | $ | (11,643,292) | | | $ | (4,364,303) | | | $ | 30,431,503 | |
| Total Non- Controlled Affiliated Privately Held Companies and Publicly Traded Securities | | | | $ | 138,431 | | | $ | (8,649,120) | | | $ | 44,376,561 | | | $ | 12,921,468 | | | $ | (16,187,225) | | | $ | 2,606,781 | | | $ | 41,110,804 | |
| | | | | | | | | | | | | | | | |
(A)Common stock, warrants, membership units and, in some cases, preferred stock are generally non-income producing and restricted. The principal amount of debt and the number of shares of common and preferred stock and number of membership units are shown in the accompanying Consolidated Schedule of Investments as of December 31, 2020.
(B)Represents the total amount of interest or dividends credited/(debited) to income for the portion of the year an investment was a control or affiliate investment, as appropriate. Amounts credited to preferred or common stock represent accrued bridge note interest related to conversions that occurred during the year ended December 31, 2020.
(C)Gross additions include increases in investments resulting from new portfolio investments, paid-in-kind interest or dividends, the amortization of discounts and fees. Gross additions also include net increases in unrealized appreciation or decreases in unrealized depreciation.
(D)Gross reductions include decreases in investments resulting from principal collections related to investment repayments or sales, the amortization of premiums and acquisition costs. Gross reductions also include net increases in unrealized depreciation or decreases in unrealized appreciation.
(E)"Non-Controlled Affiliated" is defined as ownership of five percent or more, but less than 25 percent, of the voting shares of the portfolio company, or where we hold the right to appoint one or more members to the portfolio company’s board of directors, but less than 25 percent of the members of the board of directors.
(F)Debt security is on non-accrual status as of April 1, 2018
| | | | | | | | | | | | | | | | | | | | | | | | | | | | | |
| Line for Schedule of Investments | Method / Level | | Primary Industry | | # of Shares Purchased/Principal | | Cost of TURN's Investment | | Valuation |
| NON-CONTROLLED AFFILIATED COMPANIES | | | | | | | | | |
| PRIVATELY HELD COMPANIES | | | | | | | | | |
| ABSMaterials, Inc. | | | Specialty Chemicals | | | | | | |
| Series A Convertible Preferred Stock (acquired 2/17/10-10/24/11) | (I) (L3) | | | | 390,000 | | | $ | 435,000 | | | $ | 28,691 | |
| Series B Convertible Preferred Stock (acquired 11/8/13-6/25/14) | (I) (L3) | | | | 1,037,751 | | | 1,217,644 | | | 343,821 | |
| Secured Convertible Bridge Note, 8% PIK, (acquired 1/20/16, maturing 12/31/21) | (M) (L3) | | | | $ | 100,000 | | | 139,627 | | | 139,627 | |
| Secured Convertible Bridge Note, 8% PIK, (acquired 3/28/17, maturing 12/31/21) | (M) (L3) | | | | $ | 25,000 | | | 32,534 | | | 32,534 | |
| | | | | | | $ | 1,824,805 | | | $ | 544,673 | |
| Accelerator IV-New York Corporation | | | Research & Consulting Services | | | | | | |
| Series A Common Stock (acquired 7/21/14-12/12/18) | (I) (L3) | | | | 833,333 | | | $ | 0 | | | $ | 669,010 | |
| Black Silicon Holdings, Inc. | | | Semiconductors | | | | | | |
| Series A Convertible Preferred Stock (acquired 8/4/15) | (M) (L3) | | | | 233,499 | | | $ | 750,000 | | | $ | 0 | |
| Series A-1 Convertible Preferred Stock (acquired 8/4/15) | (M) (L3) | | | | 2,966,667 | | | 890,000 | | | 0 | |
| Series A-2 Convertible Preferred Stock (acquired 8/4/15) | (M) (L3) | | | | 4,207,537 | | | 2,445,000 | | | 0 | |
| Series B-1 Convertible Preferred Stock (acquired 8/4/15) | (M) (L3) | | | | 1,892,836 | | | 1,169,561 | | | 0 | |
| Series C Convertible Preferred Stock (acquired 8/4/15) | (M) (L3) | | | | 1,674,030 | | | 1,171,316 | | | 0 | |
| Secured Convertible Bridge Note, 8% PIK, (acquired 8/25/16, maturing 8/4/21) | (M) (L3) | | | | $ | 1,278,453 | | | 1,444,368 | | | 836,798 | |
| | | | | | | | $ | 7,870,245 | | | $ | 836,798 | |
| EchoPixel, Inc. | | | Health Care Equipment | | | | | | |
| Series Seed Convertible Preferred Stock (acquired 6/21/13-6/30/14) | (I) (L3) | | | | 4,194,630 | | | $ | 1,250,000 | | | $ | 885,465 | |
| Series Seed-2 Convertible Preferred Stock (acquired 1/22/16) | (I) (L3) | | | | 1,476,668 | | | 500,000 | | | 315,884 | |
| Series A-2 Convertible Preferred Stock (acquired 3/23/17) | (I) (L3) | | | | 1,471,577 | | | 350,000 | | | 376,990 | |
| | | | | | | | $ | 2,100,000 | | | $ | 1,578,339 | |
| | | | | | | | | |
| | | | | | | | | | | | | | | | | | | | | | | | | | | | | |
| Line for Schedule of Investments | Method / Level | | Primary Industry | | # of Shares Purchased/Principal | | Cost of TURN's Investment | | Valuation |
| NON-CONTROLLED AFFILIATED COMPANIES | | | | | | | | | |
| PRIVATELY HELD COMPANIES | | | | | | | | | |
| Essential Health Solutions, Inc. | | | Health Care Technology | | | | | | |
| Common Stock (acquired 11/18/16) | (I) (L3) | | | | 200,000 | | | $ | 20 | | | $ | 0 | |
| Series A Convertible Preferred Stock (acquired 11/18/16) | (I) (L3) | | | | 2,750,000 | | | 2,750,000 | | | 327,907 | |
| Unsecured Convertible Bridge Note, 8%, (acquired 12/19/18, maturing 12/19/21) | (I) (L3) | | | | $ | 50,000 | | | 50,000 | | | 11,196 | |
| | | | | | | | $ | 2,800,020 | | | $ | 339,103 | |
| HALE.life Corporation | | | Health Care Technology | | | | | | |
| Common Stock (acquired 3/1/16) | (I) (L3) | | | | 1,000,000 | | | $ | 10 | | | $ | 111,747 | |
| Series Seed-1 Convertible Preferred Stock (acquired 3/28/17) | (I) (L3) | | | | 11,000,000 | | | 1,896,920 | | | 1,632,048 | |
| Series Seed-2 Convertible Preferred Stock (acquired 12/28/18) | (I) (L3) | | | | 12,083,132 | | | 2,500,000 | | | 1,892,116 | |
| | | | | | | | $ | 4,396,930 | | | $ | 3,635,911 | |
| TARA Biosystems, Inc. | | | Life Sciences Tools & Services | | | | | | |
| Common Stock (acquired 8/20/14) | (I) (L3) | | | | 2,000,000 | | | $ | 20 | | | $ | 552,902 | |
| Series A Convertible Preferred Stock (acquired 3/31/17) | (I) (L3) | | | | 6,878,572 | | | 2,545,493 | | | 2,444,684 | |
| Series A-2 Convertible Preferred Stock (acquired 4/18/19) | (I) (L3) | | | | 208,577 | | | 100,000 | | | 77,881 | |
| | | | | | | $ | 2,645,513 | | | $ | 3,075,467 | |
| Total Non-Controlled Affiliated Privately Held Companies (11.1%) | | | | | | | $ | 21,637,513 | | | $ | 10,679,301 | |
| | | | | | | | | |
| NON-CONTROLLED AFFILIATED COMPANIES | | | | | | | | | |
| PUBLICLY TRADED SECURITIES | | | | | | | | | |
| Potbelly Corporation | | | Restaurants | | | | | | |
| Common Stock (acquired 6/24/19-6/1/20) | (M) (L1) | | | | 1,268,099 | | | $ | 5,275,094 | | | $ | 5,579,636 | |
| Quantum Corporation | | | Technology Hardware, Storage & Peripherals | | | | | | |
| Common Stock (acquired 2/4/19-12/9/20) | (M) (L1) | | | | 1,484,955 | | | $ | 3,969,084 | | | $ | 9,087,925 | |
| Sonim Technologies, Inc. | | | Technology Hardware, Storage & Peripherals | | | | | | |
| Common Stock (acquired 6/5/20-7/14/20) | (M) (L1) | | | | 6,045,229 | | | $ | 4,541,166 | | | $ | 4,376,746 | |
| | | | | | | | | |
| | | | | | | | | | | | | | | | | | | | | | | | | | | | | |
| Line for Schedule of Investments | Method / Level | | Primary Industry | | # of Shares Purchased/Principal | | Cost of TURN's Investment | | Valuation |
| NON-CONTROLLED AFFILIATED COMPANIES | | | | | | | | | |
| PUBLICLY TRADED SECURITIES | | | | | | | | | |
| Synacor, Inc. | | | Application Software | | | | | | |
| Common Stock (acquired 4/6/17-10/1/20) | (M) (L1) | | | | 1,744,640 | | | $ | 4,519,510 | | | $ | 2,372,710 | |
| Stock Options for Common Stock Expiring 2/28/29 (acquired 3/1/19) | (I) (L3) | | | | 50,000 | | | 0 | | | 33,743 | |
| Stock Options for Common Stock Expiring 5/16/29 (acquired 5/16/19) | (I) (L3) | | | | 15,000 | | | 0 | | | 10,384 | |
| Restricted Stock Units (acquired 9/8/20-10/27/20) | (M) (L2) | | | | 57,756 | | | 0 | | | 69,683 | |
| | | | | | | | $ | 4,519,510 | | | $ | 2,486,520 | |
| TheMaven, Inc. | | | Interactive Media & Services | | | | | | |
| Series H Convertible Preferred Stock (acquired 6/27/19) | (M) (L3) | | | | 1,320 | | | $ | 2,000,000 | | | $ | 2,307,912 | |
| Common Stock (acquired 12/18/20) | (M) (L3) | | | | 11,429,000 | | | 6,000,000 | | | 6,592,764 | |
| | | | | | | | $ | 8,000,000 | | | $ | 8,900,676 | |
| Total Non-Controlled Affiliated Publicly Traded Securities (31.6%) | | | | | | | $ | 26,304,854 | | | $ | 30,431,503 | |
| Total Non-Controlled Affiliated Privately Held Companies and Publicly Traded Securities (42.7%) | | | | | | | $ | 47,942,367 | | | $ | 41,110,804 | |
| | | | | | | | | |
Report of Independent Registered Public Accounting Firm
To the Board of Directors and Shareholders of 180 Degree Capital Corp.
Opinion on the Financial Statements
We have audited the accompanying consolidated statement of assets and liabilities, including the consolidated schedule of investments, of 180 Degree Capital Corp. and its subsidiaries (the “Company”) as of December 31, 2020, the related consolidated statements of operations and cash flows for the year ended December 31, 2020, the consolidated statements of changes in net assets for each of the two years in the period ended December 31, 2020, including the related notes, and the consolidated financial highlights for each of the five years in the period ended December 31, 2020 (collectively referred to as the “consolidated financial statements”). In our opinion, the consolidated financial statements present fairly, in all material respects, the financial position of the Company as of December 31, 2020, the results of its operations and its cash flows for the year then ended, the changes in its net assets for each of the two years in the period ended December 31, 2020 and the financial highlights for each of the five years in the period ended December 31, 2020 in conformity with accounting principles generally accepted in the United States of America.
Basis for Opinion
These consolidated financial statements are the responsibility of the Company’s management. Our responsibility is to express an opinion on the Company’s consolidated financial statements based on our audits. We are a public accounting firm registered with the Public Company Accounting Oversight Board (United States) (PCAOB) and are required to be independent with respect to the Company in accordance with the U.S. federal securities laws and the applicable rules and regulations of the Securities and Exchange Commission and the PCAOB.
We conducted our audits of these consolidated financial statements in accordance with the standards of the PCAOB. Those standards require that we plan and perform the audit to obtain reasonable assurance about whether the consolidated financial statements are free of material misstatement, whether due to error or fraud.
Our audits included performing procedures to assess the risks of material misstatement of the consolidated financial statements, whether due to error or fraud, and performing procedures that respond to those risks. Such procedures included examining, on a test basis, evidence regarding the amounts and disclosures in the consolidated financial statements. Our audits also included evaluating the accounting principles used and significant estimates made by management, as well as evaluating the overall presentation of the consolidated financial statements. Our procedures included confirmation of securities owned as of December 31, 2020 by correspondence with the custodian, transfer agent, portfolio companies and broker; when replies were not received from portfolio companies and broker, we performed other auditing procedures. We believe that our audits provide a reasonable basis for our opinion.
/s/ PricewaterhouseCoopers LLP
New York, New York
February 22, 2021
We have served as the Company’s auditor since 2002.
Privacy Policy
We are committed to protecting your privacy. This privacy notice explains the privacy policies of 180 Degree Capital Corp. and its affiliates. This notice supersedes any other privacy notice you may have received from 180 Degree Capital Corp.
Generally, we do not receive any non-public personal information relating to our shareholders, although certain non-public personal information of our shareholders may become available to us. We maintain physical, electronic, and procedural safeguards, according to strict standards of security and confidentiality, all information we receive about you. The only information we collect from you is your name, address, and number of shares you hold. This information is used only so that we can send you annual reports and other information about us, and send you proxy statements or other information required by law. When the Company shares non-public shareholder personal information referred to above, the information is made available for limited business purposes and under controlled circumstances designed to protect our shareholders' privacy. We do not permit use of shareholder information for any non-business or marketing purpose, nor do we permit third parties to rent, sell, trade or otherwise release or disclose information to any other party.
We do not share this information with any non-affiliated third party except as described below.
•180 Degree Capital Corp. and affiliate employees. It is our policy that only our authorized employees who need to know your personal information will have access to it. Our personnel who violate our privacy policy are subject to disciplinary action.
•Service Providers. We may disclose your personal information to companies that provide services on our behalf, such as record keeping and mailing you information. These companies are required to protect your information and use it solely for the purpose for which they received it.
•Courts and Government Officials. If required by law, we may disclose your personal information in accordance with a court order or at the request of government regulators. Only that information required by law, subpoena, or court order will be disclosed.
Proxy Voting
We vote proxies relating to our portfolio securities in the best interest of our shareholders. We review on a case-by-case basis each proposal submitted to a shareholder vote to determine its impact on the portfolio securities held by us. Although we generally vote against proposals that may have a negative impact on our portfolio securities, we may vote for such a proposal if there exists compelling long-term reasons to do so.
Our proxy voting decisions are made by our Portfolio Managers, who are responsible for monitoring each of our investments. To ensure that our vote is not the product of a conflict of interest, we require that: (i) anyone involved in the decision making process disclose to our Chief Compliance Officer any potential conflict that he or she is aware of and any contact that he or she has had with any interested party regarding a proxy vote; and (ii) employees involved in the decision making process or vote administration are prohibited from revealing how we intend to vote on a proposal in order to reduce any attempted influence from interested parties.
Information regarding how the Company voted proxies relating to portfolio securities during the most recent 12-month period ended June 30 is available, without charge, upon request, by calling the Company toll-free at 833-293-1769 and on the SEC's website at http://www.sec.gov.
Portfolio Holdings
The Company files its complete schedule of portfolio holdings with the SEC for the first and third quarters of each fiscal year on Form N-PORT. The Company's Forms N-PORT are available on the SEC's website at http://www.sec.gov and may be reviewed and copied at the SEC's Public Reference Room in Washington D.C. Information on the operation of the Public Reference Room may be obtained by calling 1-800-SEC-0330.
180 Degree Capital Corp.
Board of Directors
| | | | | | | | |
Stacy R. Brandom1,2,3,4 | Tonia L. Pankopf1,2 | Kevin M. Rendino6 |
Richard P. Shanley1,2,3,4,5 | Parker A. Weil1,2,3,4 | Daniel B. Wolfe |
1. Member of Audit Committee 2. Member of Valuation Committee 3. Member of Compensation Committee
4. Member of Nominating Committee 5. Lead Independent Director 6. Chairman of the Board
Officers
| | | | | |
| Kevin M. Rendino | Chairman, Chief Executive Officer and Portfolio Manager |
| Daniel B. Wolfe | President, Chief Financial Officer, Chief Compliance Officer and Portfolio Manager |
| Alicia M. Gift | Senior Controller, Secretary and Treasurer |
| Robert E. Bigelow III | Vice President, Head of Fund Development |
7 N. Willow Street, Suite 4B
Montclair, New Jersey 07042
Phone: 973-746-4500 Fax: 973-746-4508
Website: www.180degreecapital.com Email: ir@180degreecapital.com
Counsel: Schulte Roth & Zabel LLP
Independent Registered Public Accounting Firm: PricewaterhouseCoopers LLP
Custodian of Securities: US Bank, N.A.
Transfer Agent & Registrar: American Stock Transfer & Trust Company, LLC
Stockholder Relations Department
6201 15th Avenue
Brooklyn, New York 11219
877-260-8188
Website: www.astfinancial.com Email: info@astfinancial.com
HOUSEHOLDING OPT-OUT NOTICE
To reduce expenses, we may only mail one copy of the 180 Degree Capital Corp.'s shareholder updates, such as prospectus, annual report, semi-annual report, to those addresses shared by two or more accounts. If you are not a direct shareholder (i.e., you hold your shares of us in a brokerage account), please contact your financial institution to opt out of householding. If you are a direct shareholder (i.e., you hold your shares of us at our transfer agent) and wish to receive individual copies of these documents, please call us toll-free at 833-293-1769. We will begin sending you individual copies thirty days after receiving your request.
Item 2. Code of Ethics.
The Board has adopted a code of ethics applicable to our senior executive officers that is designed to promote honest and ethical conduct, including the ethical handling of actual or apparent conflicts of interest between personal and professional relationships (the "Code of Conduct"). Our Code of Conduct is available on the Company's website at https://ir.180degreecapital.com/governance-docs. The Company made amendments to the Code of Conduct to include reference to and items required under the Advisers Act. The Company did not grant any waivers from any provisions of the Code of Conduct during the reporting period.
Item 3. Audit Committee Financial Expert.
The Board has determined that all of the members of the Company's Audit Committee of the Board, Stacy R. Brandom, Tonia L. Pankopf, Richard P. Shanley and Parker A. Weil, meet the definition of "audit committee financial expert" as that term is defined by the SEC and are "independent" pursuant to paragraph (a)(2) of this Item.
Item 4. Principal Accountant Fees and Services.
The information set forth under the captions "Audit Committee's Pre-Approval Policies" and "Fees Paid to PwC for 2020 and 2019" in the Proxy Statement for the 2021 Annual Meeting of Shareholders, to be filed pursuant to Regulation 14A under the Exchange Act (the "2021 Proxy Statement") is herein incorporated by reference.
Item 5. Audit Committee List of Registrants.
The information set forth under the caption "Audit Committee" in our 2021 Proxy Statement is herein incorporated by reference.
Item 6. Investments.
(a) The schedule of investments in securities of unaffiliated issuers is included as part of the report to stockholders filed under Item 1 of this form.
(b) Not applicable.
Item 7. Disclosure of Proxy Voting Policies and Procedures for Closed-End Management Investment Companies.
We vote proxies relating to our portfolio securities in the best interest of our shareholders. We review on a case-by-case basis each proposal submitted to a shareholder vote to determine its impact on the portfolio securities held by us. Although we generally vote against proposals that may have a negative impact on our portfolio securities, we may vote for such a proposal if there exists compelling long-term reasons to do so.
Our proxy voting decisions are made by our Portfolio Managers, who are responsible for monitoring each of our investments. To ensure that our vote is not the product of a conflict of interest, we require that: (i) anyone involved in the decision making process disclose to our Chief Compliance Officer any potential conflict that he or she is aware of and any contact that he or she has had with any interested party regarding a proxy vote; and (ii) employees involved in the decision making process or vote administration are prohibited from revealing how we intend to vote on a proposal in order to reduce any attempted influence from interested parties.
Item 8. Portfolio Managers of Closed-End Management Investment Companies.
(a)(1) As of December 31, 2020, Kevin M. Rendino and Daniel B. Wolfe are primarily responsible for the day-to-day management of the Company's portfolio as Portfolio Managers.
Mr. Rendino has served as Chairman and Chief Executive Officer of the Company since March 2017 and as a member of the Board since June 2016. From 2012 to 2016, Mr. Rendino served as Chairman and Chief Executive Officer of RGJ Capital, where he led a Graham and Dodd approach to value investing. His team focused on a blend of long-only ideas and pair trades when a statistical anomaly and inconsistency between two variables are identified. From November 2017 to August 2019, Mr. Rendino served as a director of TheStreet, Inc., a publicly traded company in which we had an investment. Since March 2019, Mr. Rendino serves as a director of Synacor, Inc., a publicly traded company in which we have an investment.
Mr. Wolfe has served as President since January 2009, as Chief Financial Officer and Chief Compliance Officer since July 2016, and as Portfolio Manager and a member of the Company's Board since March 2017. He served as Chief Operating Officer and a Managing Director from January 2008 to June 30, 2016. He served as Chief Financial Officer from January 2008 to December 31, 2012, as Treasurer from May 2008 to December 31, 2012, and from July 2016 to April 2017. He has served as a member of the board of directors of privately held and publicly traded companies in which we have had investments.
(a)(2) Not applicable.
(a)(3) The principal elements of our executive compensation program for 2020 are base salary, bonus, other benefits and perquisites, and severance benefits. The Compensation Committee of the Board believes that each element is essential to achieve the Company’s objectives as set forth above.
Base Salaries. We recognize the need to pay our named executive officers, and other employees, a competitive annual base salary. We review base salaries for our named executive officers annually, often employing data provided from independent compensation consultants. Base salaries have historically been adjusted annually for inflation and also based on changes in the marketplace and an executive’s individual performance, salary position among peers, career growth potential and/or a change in responsibilities.
Cash Bonuses. The Company provides annual bonuses at the discretion of the Committee derived from a number of quantitative and qualitative inputs including, but not limited to:
•Performance against individual and corporate targets and goals;
•Performance as compared to indices and other observable entities that track or invest in microcapitalization publicly traded companies;
•Full year actual versus estimated expenses and expenses as a percentage of assets;
•Changes in the price per share of the Company’s stock, including dividends, if any;
•Changes in the net asset value of the Company, including dividends, if any; and
•The importance of retaining employees.
The weighting of these inputs in the Committee’s determinations of bonuses are adjusted based on a retrospective full analysis of individual and corporate achievements and challenges during the year under consideration.
Severance Benefits. To further incentivize and retain Messrs. Rendino and Wolfe, we entered into an Executive Severance Agreement with each executive.
Each of Messrs. Rendino and Wolfe's Executive Severance Agreement provides that the executive will receive the following severance benefits in the event that an executive’s employment is terminated by us other than for “cause” or an executive resigns for “good reason.”
•Twelve months of base salary to be paid in cash periodically in accordance with the Company’s normal payroll policies;
•a portion of executive’s incentive compensation in cash for the fiscal year in which executive's employment terminates, pro-rated based on time employed during the fiscal year, only to be paid to the extent that performance metrics in the plan are achieved and at the same time as payments to other executives in the applicable incentive compensation plan are paid; and
•Twelve months of COBRA premiums.
Further, under the terms of each Executive Severance Agreement for Messrs. Rendino and Wolfe, in the event an executive’s employment is terminated other than for “cause” or an executive resigns for “good reason” within the period commencing three months prior to a change in control and ending 12 months after a change in control, the severance will consist of:
•Twelve months of base salary to be paid in a single cash lump-sum;
•a portion of an executive’s incentive compensation in cash for the fiscal year in which executive's employment terminates, pro-rated based on time employed during the fiscal year;
•Twelve months of COBRA premiums.
For purposes of the Executive Severance Agreements, "cause" generally means:
•an act of dishonesty made in connection with the executive’s responsibilities as an employee;
•conviction of, or plea of nolo contendere to, a felony or any crime involving fraud or embezzlement;
•gross misconduct;
•unauthorized use or disclosure of any proprietary information or trade secrets;
•willful breach of any obligations under any written agreement or covenant with the Company;
•failure to cooperate in good faith with a governmental or internal investigation; or
•continued failure to perform duties after receiving a written demand of performance.
For purposes of the Executive Severance Agreements, "good reason" generally means a voluntary termination following the occurrence of one or more of the following, without the executive’s consent that is not cured within 30 days of notice to the Company:
•a material reduction of responsibilities;
•a material reduction in base salary; or;
•a material change (at least 50 miles) in the geographic location of Executive’s primary work facility or location.
(a)(4) As of December 31, 2020, Mr. Rendino and Mr. Wolfe beneficially owned equity securities of the Company valued over $1,000,000 and between $500,001 and $1,000,000, respectively.
Item 9. Purchases of Equity Securities by Closed-End Management Investment Company and Affiliated Purchasers.
| | | | | | | | | | | | | | |
| Period 2020 | (a) Total Number of Shares Purchased | (b) Average Price Paid Per Share | (c) Total Number of Shares Purchased as Part of Publicly Announced Plans or Programs | (d) Approximate Dollar Value of Shares that May Yet Be Purchased Under the Plans or Programs |
| 01/01 - 01/31 | 0 | | 0 | | 0 | | $ | 2,500,000 | |
| 02/01 - 02/28 | 0 | | 0 | | 0 | | 2,500,000 | |
| 03/01 - 03/31 | 0 | | 0 | | 0 | | 2,500,000 | |
| 04/01 - 04/30 | 0 | | 0 | | 0 | | 2,500,000 | |
| 05/01 - 05/31 | 0 | | 0 | | 0 | | 2,500,000 | |
| 06/01 - 06/30 | 0 | | 0 | | 0 | | 2,500,000 | |
| 07/01 - 07/31 | 0 | | 0 | | 0 | | 2,500,000 | |
| 08/01 - 08/31 | 0 | | 0 | | 0 | | 2,500,000 | |
| 09/01 - 09/30 | 0 | | 0 | | 0 | | 2,500,000 | |
| 10/01 - 10/31 | 0 | | 0 | | 0 | | 2,500,000 | |
| 11/01 - 11/30 | 0 | | 0 | | 0 | | 2,500,000 | |
| 12/01 - 12/31 | 0 | | 0 | | 0 | | 2,500,000 | |
| | | | |
| Total for Year | 0 | | | 0 | | |
On August 10, 2020, our Board reauthorized the repurchase of up to $2.5 million of the Company's common stock within a six-month period from the date of notice to investors, which notice was mailed on or about August 17, 2020. As of December 31, 2020, no repurchases had occurred.
On February 19, 2021, our Board reauthorized the repurchase of up to $2.5 million of the Company's common stock within a six-month period from the date of notice to investors, which notice was mailed on or about February 26, 2021.
Item 10. Submission of Matters to a Vote of Shareholders.
There have been no material changes to the procedures by which shareholders may recommend nominees to the registrant's Board of Directors as set forth in the registrant's Proxy Statement, dated March 25, 2020.
Item 11. Controls and Procedures.
(a) Based on an evaluation of the Registrant's Disclosure Controls and Procedures (as defined in Rule 30a-3(c) under the Investment Company Act of 1940, the “Disclosure Controls”) as of a date within 90 days prior to the filing date (the “Filing Date”) of this Form N-CSR (the “Report”), the Chief Executive Officer (its principal executive officer) and Chief Financial Officer (its principal financial officer) have concluded that the Disclosure Controls are reasonably designed to ensure that information required to be disclosed by the Registrant in the Report is recorded, processed, summarized and reported by the Filing Date, including ensuring that information required to be disclosed in the Report is accumulated and communicated to the Registrant's management, including the Registrant's principal executive officer and principal financial officer, as appropriate to allow timely decisions regarding required disclosure.
(b) There were no changes in the Registrant’s internal control over financial reporting (as defined in Rule 30a-3(d) under the Investment Company Act of 1940) that occurred during period covered by this report that have materially affected or are reasonably likely to materially affect the Registrant’s internal control over financial reporting.
Item 12. Disclosure of Securities Lending Activities for Closed-End Management Investment Companies.
(a) Not applicable.
(b) Not applicable.
Item 13. Exhibits.
(a)(1) The Code of Conduct is available on the Company's website at https://ir.180degreecapital.com/governance-docs.
(a)(3) Not applicable.
(a)(4) Not applicable.
SIGNATURES
Pursuant to the requirements of the Securities Exchange Act of 1934 and the Investment Company Act of 1940, the Registrant has duly caused this report to be signed on its behalf by the undersigned, thereunto duly authorized.
180 DEGREE CAPITAL CORP.
| | | | | |
| By: | /s/ Daniel B. Wolfe |
| | Name: Daniel B. Wolfe |
| | Title: President and Chief Financial Officer |
| | |
| | Date: February 22, 2021 |
Pursuant to the requirements of the Securities Exchange Act of 1934 and the Investment Company Act of 1940, this report has been signed below by the following persons on behalf of the Registrant and in the capacities and on the dates indicated.
| | | | | | | | | | | | | | |
| By: | /s/ Kevin M. Rendino | | By: | /s/ Daniel B. Wolfe |
| | Name: Kevin M. Rendino | | | Name: Daniel B. Wolfe |
| | Title: Chief Executive Officer | | | Title: President and Chief Financial Officer |
| | (Principal Executive Officer) | | | (Principal Financial Officer) |
| | | | | |
| | Date: February 22, 2021 | | | Date: February 22, 2021 |