UNITED STATES
SECURITIES AND EXCHANGE COMMISSION
Washington, D.C. 20549
FORM N-CSR
CERTIFIED SHAREHOLDER REPORT OF REGISTERED
MANAGEMENT INVESTMENT COMPANY
Investment Company Act file number 811-07074
| | |
| 180 DEGREE CAPITAL CORP. |
| (Exact Name of Registrant as Specified in Its Charter) |
| | | | | | | | |
| 7 N. Willow Street, Suite 4B, Montclair NJ | | 07042 |
| (Address of Principal Executive Offices) | | (Zip Code) |
| | |
Daniel B. Wolfe
President and Chief Financial Officer
180 Degree Capital Corp.
7 N. Willow Street, Suite 4B
Montclair, NJ 07042 |
| (Name and address of agent for service) |
|
Copy to:
John J. Mahon, Esq.
Schulte Roth & Zabel, LLP
1152 Fifteenth Street, NW
Suite 850
Washington, DC 20005
(202) 729-7477 |
Registrant's telephone number, including area code: (973) 746-4500
Date of fiscal year end: December 31
Date of reporting period: June 30, 2021
Item 1. Report to Shareholders.
Fellow Shareholders,
On July 1, 1990, I began my first day working at Merrill Lynch Asset Management for the Basic Value Fund. I was determined to make a better impression than I had two years prior, on my first day working for Merrill in its two- year analyst program. I remember that day back in 1988 like it was yesterday. I was taking the ferry over to the World Financial Center from Hoboken, New Jersey. It was a typical smoldering 90 degree August day with 85% humidity. I absolutely loved the stock market and spent the last four years of school determined to work on Wall Street and today was the big day! Fresh off the 1987 Oliver Stone movie “Wall Street” I was fired up to begin my Gordon Gekko life sporting my best suit and my most prized suspenders. I was going to work on Merrill’s trading floor, a gigantic football field of people yelling and screaming located in the North Tower of the World Financial Center. Given how hot it was, I had my suit jacket draped over my shoulder as I entered the trading floor on one side, having to walk the entire length of the floor to get to my desk. Feeling adrenaline rushing to my head as I walked the floor, I began to feel that with each passing step, people were starting to stand up and, was it possible, staring at me? It couldn’t be. But maybe they were. It must be my self-absorbed vantage point; obviously they were expecting me and knew I was the “new guy.” By the time I approached my trading desk, which was perched up overlooking the entire floor, I turned around to see the entire trading floor standing up, staring at our desk, and slow clapping en-masse. "What was going on here," I thought to myself. As I shook the hand of my new boss and began to take my seat, I assumed the 1,000 people were giving me a standing ovation for my first day. That’s awesome, what a great tradition! Then, at that moment, my boss came over, took out a pair of scissors, and cut my suspenders in half on both sides while ushering me these welcoming words, “Bud, we don’t do freaking suspenders on this floor. Don’t ever wear them again. Ever. Welcome aboard.” And as the suspenders snapped around my shoulder with each snip, the entire floor started cheering as if the Yankees won the 7th game of the World Series. I received a mouthful of humble pie to start my career on day 1.
So, two years later, I was going to try to make a better impression on my colleagues than I did on that trading desk. I made sure I studied what The Basic Value Equity Fund owned and followed all the names leading up to my first day. Basic Value was the first fund Merrill started back in 1977 and was the department’s biggest fund. My boss, Paul Hoffman, lived for the stock market and was willing to take a risk on a very young graduate of the Merrill Lynch analyst program. I couldn’t have been more excited and more thankful to Paul. As he walked into the office and by my cubicle on the morning of my first day, he yelled out “Morning rookie, follow me to my office.” After welcoming me as an analyst on the fund, I was anxious to show him I was paying attention even before I started. My very first words were “I know we own McDonnell Douglas. Did you see the stock was down 10% last week because of weak deliveries of the MD-11 aircraft?” Oh no, bad choice of words. What I meant to say was “I saw McDonnell Douglas was down 10% because of the MD-11 program. Is there any work you want to me do there?” Too late. His response, which I really can’t repeat verbatim for this G-rated shareholder letter, went something like this: “What? Are you (bleeping) kidding me! Did I see the stock was down 10% last week? What the (bleep) do you think we do all day around here. No, I didn’t see one of my top ten holdings, which ruined our (bleeping) quarter was (bleeping) down 10% last week. That must have been the (bleeping) day I took everyone to (bleeping) New York City to see the Nutcracker. Get the (bleep) out of my office!” It was clear my words hit the rawest nerve imaginable. I didn’t even have time to let him know what I meant to say, for if I didn’t leave the office immediately, I think he would have thrown a shoe at me. The entire floor heard the rant directed at me. The entire floor stood with fascination to see the commotion. As I walked back to my cubicle, once again, embarrassed and ashamed on my first day, my future partner, Bob Martorelli, snuck his head in my cubicle in an attempt to humor me and said sarcastically, “Welcome aboard.”
I learned so much on that first day about what it means to manage other people’s money and the type of people that I would trust managing money. There is simply never a day off. You are either paying attention 24 hours a day, 7 days a week, or you aren’t. For crying out loud, of course he knew about McDonnell Douglas. Like he knew about everything that was going on at all times for the 80 companies he owned and the 50 he was looking at as new investments. He stared at his screen all day long and was having incessant conversations about the markets and his holdings with his personal team, the MLAM department, the sell side, as well as gleaning anything of relevance from newspapers, television, and every other source of information that gave him insight. I learned a lot that morning about how much he cared for the people that entrusted him with their money. The man was wired to win and to take care of the dollars entrusted to him by the Basic Value shareholders. I learned that although he didn’t beat the market every day, month, or year, it wasn’t going to be for a lack of effort, time not spent analyzing companies or having the gumption to make investment decisions at all times. I think I learned from my parents not to focus on the tone of the message from those that are attempting to guide you, but rather the message itself. While I didn’t know it at the time (I really just messed up what I was trying to say!), I realized that there was almost nothing else I could have said to more professionally insult Paul. I literally was questioning his work ethic and his attention to detail. His care and consideration for his job and the money he managed on behalf of others has stayed with me my entire career. He simply paid attention all the time to his holdings, to companies he didn’t own but was researching, to the economy, to trends, to all of it. We have always said we are long term investors, and we are. But I always say the long term is made up of a series of short terms and if you don’t pay attention to the short term, you may not be around for the long term. By now, you know we are disciples of Benjamin Graham and David Dodd (for many years, my kids heard their names so often they thought Graham and Dodd were their uncles--I am not kidding). Graham said, “In the short run, the stock market is a voting machine. Yet in the long run, it is a weighing machine.” This statement means that in the short term, the market is reacting to transitory factors that influence the short term
only, while over the long term, the market properly “weights” the long-term inherent value of a business. Essentially psychology and emotion win the day reacting to short term news, but in the end, fundamentals of the business win.
In the preface to the Sixth Edition of Graham and Dodd’s book, Security Analysis, Seth Klarman remarked, “As Graham has instructed, those who view the market as a weighing machine – a precise and efficient assessor of value – are part of the emotionally driven herd. Those who regard the market as a voting machine – a sentiment-driven popularity contest – will be well positioned to take proper advantage of the extremes of market sentiment.” We believe in both managing our assets with a long-term horizon while respecting the news of today and how that can impact stock valuations in meaningful ways. To the point of managing to both the short and long term, I know many of you model our public portfolio in an attempt to predict our quarter-end performance. To do that, you take our quarter-end share count for each position, multiply that by the price change for each security, and then total the amount in order to quantify our performance. What isn’t known is how the portfolio changes during the three months. This was a very busy three months for us with regards to portfolio construction; we made significant changes since we last reported to you. In the quarter, we:
1.Added 81,287 shares of AFI under $5.00. We then cut our position in half at an average sale price of $5.46. This was an example of being very concerned about the short term while still believing in the long-term thesis.
2.Sold 34% of our ALTG position at $13.49. We became worried about short term but still believe in the long term.
3.Sold our remaining shares of BW at an average price of $8.96.
4.Had an undisclosed PFSW position in Q1 2021 and ended Q2 2021 with 530,328 shares. Interestingly enough, we love the short term and are unsure about the long term.
5.Had an undisclosed SNCR position in Q1 2021 and ended Q2 2021 with 3,205,494 shares.
6.Sold 65% of our SONM position at $0.58. We now neither believe in the short term, nor the long term.
In total, had we left the portfolio alone and gone away on vacation for three months, our public portfolio would have been up 0.6%. With all the inter-quarter changes, we were able to achieve a 5.9% gross total return for our public portfolio, or 6.8% if you include the carried interest from our SMA that would have been paid if it was the end of 2021. We continue to believe that success in portfolio management is derived from making sound long term investment decisions while, at the same time, taking advantage of short-term volatility if opportunities arise. As much as we think AFI is going to be a double-digit stock, if we become worried that short-term supply chain issues are going to affect the stock, then we aren’t afraid to cut the position in half with an eye towards buying it back at lower prices. Our research led us to become ultra-concerned in the short term, so that is what we did with our AFI position. Simply put, the short term matters in determining our performance. The second thing I learned from getting chewed out by Paul within the first minutes of starting my first job is that a 10% change in value of a holding is a lot. McDonnell Douglas’s 10% decline completely triggered a level of anger in Paul to the point I thought he was going to have an aneurysm. If you heard me say it once, you have heard me say it 1,000 times; I do not believe the market is efficient with an eye towards the long term. That said, in the short term, I do believe the market is the compilation of everyone’s opinion of what a business is worth based on the information that everyone has about that company; and remember, everyone has their own proprietary information. We sit around all day and stare at Bloomberg screens filled with letters and numbers and colors. For what reason? Bob Martorelli used to scream out to his analysts all the time, “The screen is talking to you, go find out what it’s saying.” What that means is let’s say XYZ company stock price is down 7% while the market is flat and there is no tangible news for why it’s down. Bob was essentially saying, someone has a piece of information that we don’t know about which is causing the share price to be down 7%. He wanted his analysts to track down the information and ascertain whether or not it was market making information or immaterial. Really, the exercise was one in trying to understand what causes a certain stock to move one way or the other. It is gathering information, whether or not we felt the information was material or a complete non-sequitur to our thesis for why we owned a certain company. It is called learning. So, when we see certain stocks trading in non-correlated patterns versus the rest of the market, our job is to figure out why. As I say often to the 180 team when I see a non-correlated move for one of our holdings, “Somebody knows something that we don’t know. Tell me what that is.” A stock doesn’t need to be up or down 10% to get our antennas up; the learning process often happens when stocks are up or down far less. It is the uncorrelated aspect of stock price movements that causes us to dig in and find out what we don’t know. Maybe we learn something. Maybe we don't. Given the volatility of the market these days, maybe 10% moves feel normal not only for individual stocks, but also the market. If you look at the performance of the Russell Microcap Index for the prior six quarters, they were up or down double digits four of the six past quarters (Q1 2020: -32%, Q2 2020: +30.5%, Q4 2020: +31.4%, Q1 2021: +23.9%). I guess relative to the seemingly "normal" double digit return world, achieving a +6.8% gross total return versus the +4.1% gross total return of the Russell Microcap Index seems like a boring nothing quarter. But +6.8% is not a nothing quarter and on a day-to-day basis, this market feels like anything other than quiet and docile. Over the last 100 years, the stock market returns, on average, approximately +10% a year. The day I view a +6.8% quarterly gross total return for our public holdings as anything less than excellent performance is the day I have lost all perspective. I am pleased with how we have performed this past quarter in our public market strategy.
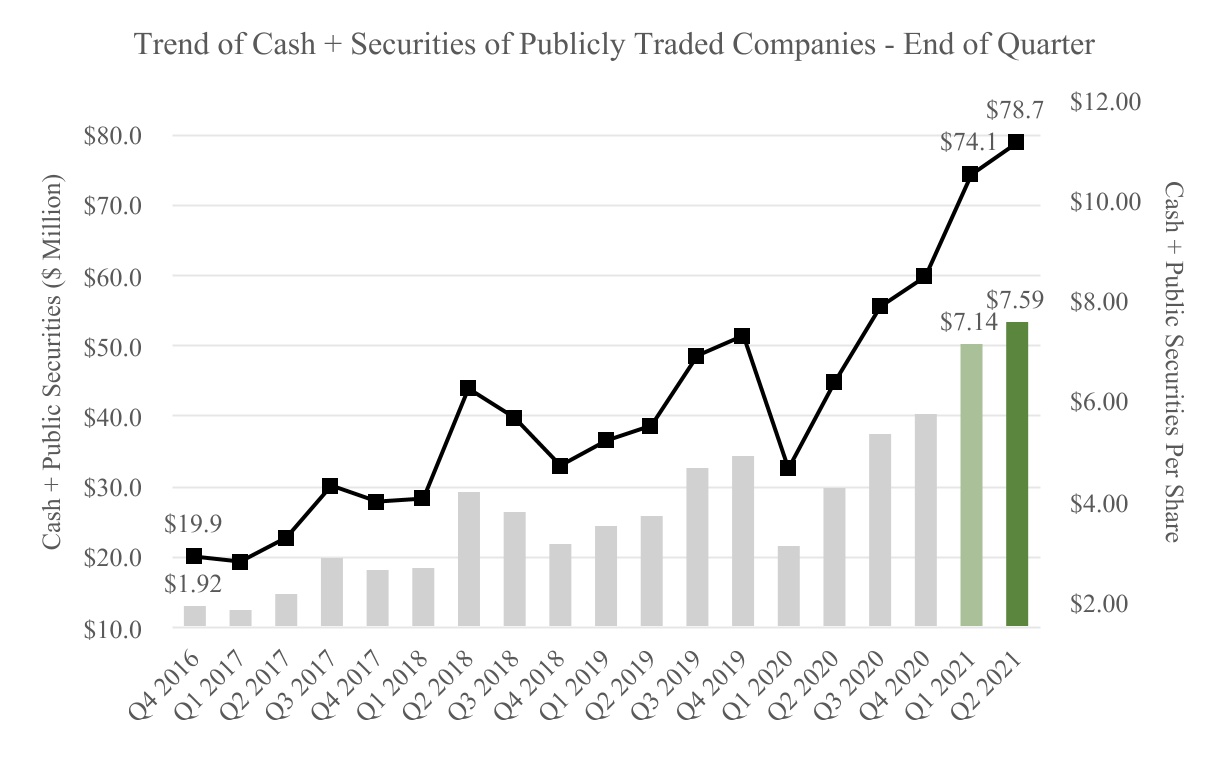
Take a look at this chart that shows the cash and securities of publicly traded companies on our balance sheet as of June 30, 2021. We’ve grown from $19.9 million to $78.7 million since we started in 2017, and we note that this amount does not include potential carried interest in 2021 from our SMA. On a per share basis, our cash and securities of publicly traded companies as of the end of the quarter were greater than TURN’s current stock price. How silly!
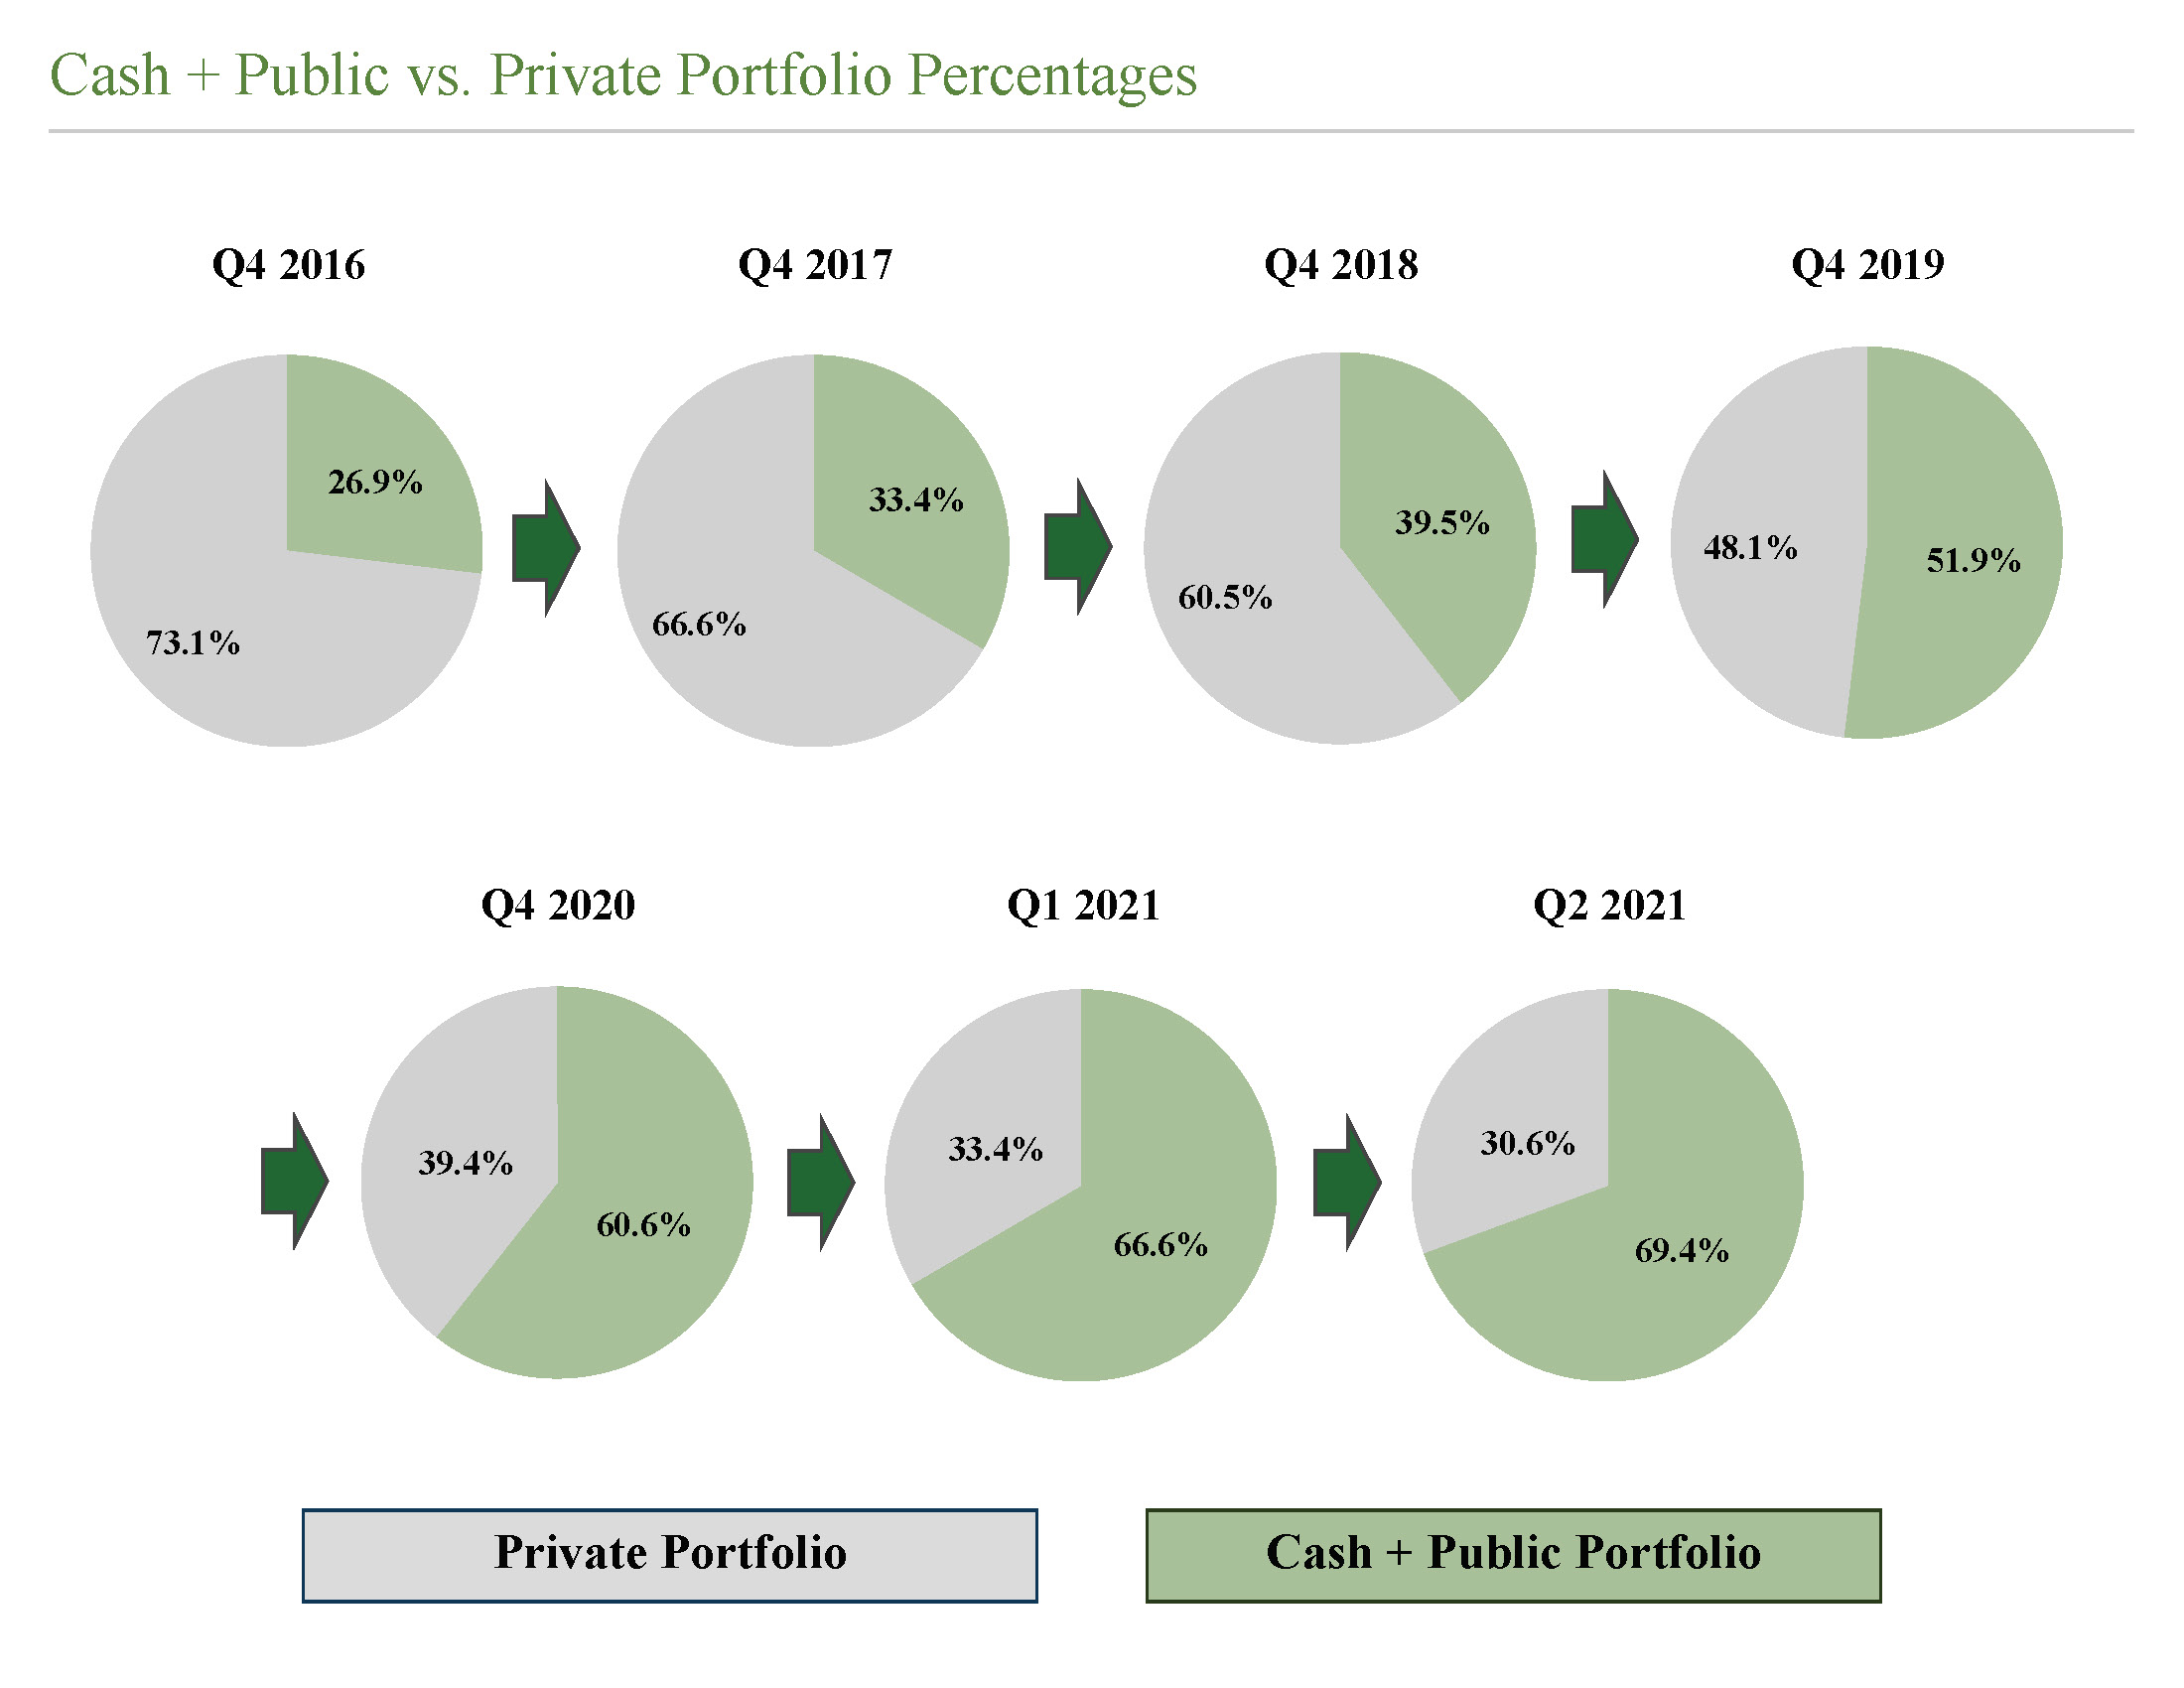
We had a 5.3% decline in our private portfolio in the quarter. While that is maddening to us, it should also be noted that the private portfolio is now just 30% of our total assets, the lowest percentage it has been at any time in our history. The private portfolio simply doesn’t matter as much as it did, and in a quarter where we had a decline of approximately $2.0 million in our private holdings, the drawdown was drowned out by a $4.4 million gain in our public holdings. I have said we expect to have monetization in our private portfolio this year, and this quarter we are pleased to note that the company in which our private portfolio company Black Silicon Holdings, Inc., has a profit interest in, has agreed to be sold to an undisclosed acquirer. We currently anticipate this transaction will close shortly and we will receive approximately $1 million. If at the end of the year we don’t have further news of events for our private portfolio, I will be disappointed and, I might add, surprised. Our share price now trades at our cash and securities of publicly traded companies and provides zero value for our private portfolio. I’ll illustrate that in greater detail in our “Sum of the Parts” section below.
As we mentioned last quarter, 180 is pursuing SPAC opportunities with what we believe are value added partners or management teams who we believe have demonstrated a core competency in sourcing merger candidates. The first of these efforts is in Parabellum Acquisition Corp., where 180 has committed to invest up to $2.7 million in risk capital as a member of the sponsor group in connection with the formation and launch of a new SPAC. In addition, we are currently working with another partner in connection with exploring an additional SPAC sponsor group investment opportunity, although we cannot assure you when or if such investment will ultimately be consummated. We look forward to being able to discuss these continuing efforts in more detail in the future. It is truly gratifying to see our business evolve from one that had no future to where it is today, where we have significantly grown our NAV and are able to take advantage of exciting investment opportunities. We have come a long way.
NET ASSET VALUE PER SHARE
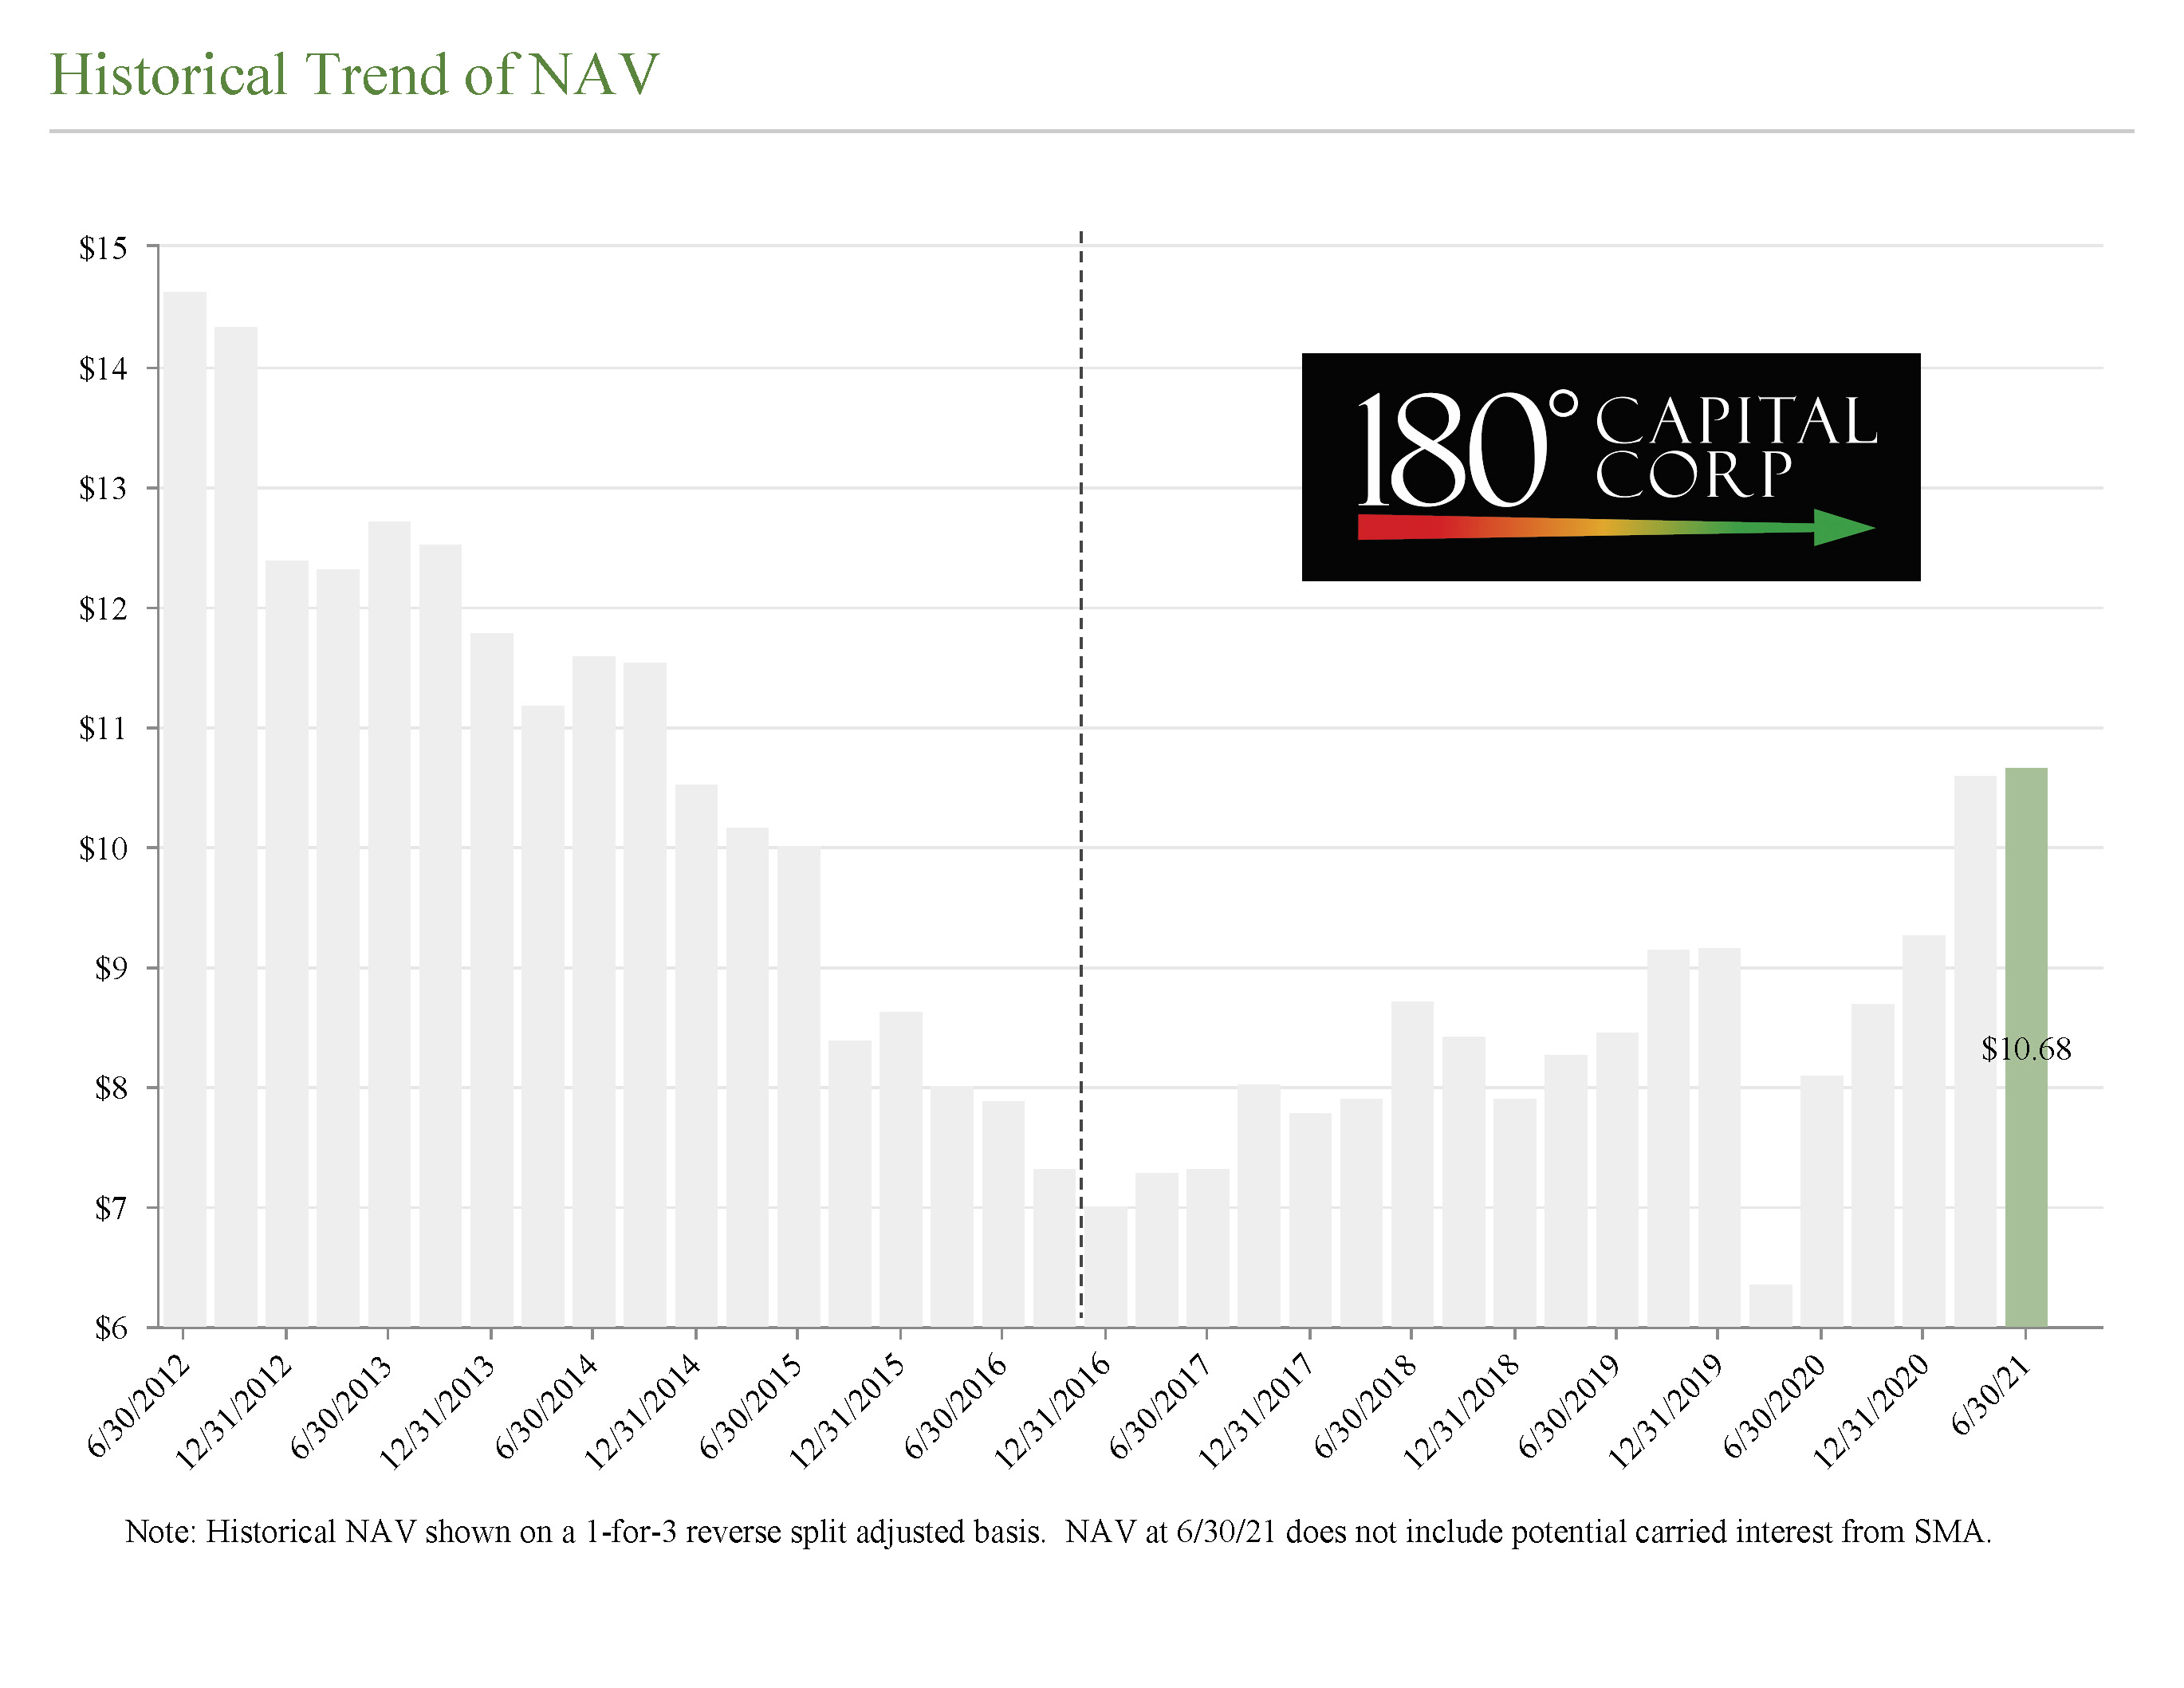
Our net asset value per share (“NAV”) increased this quarter from $10.60 to $10.68, or +0.8%. Our Fund has three principal components to the variance in our NAV: our public portfolio, our private portfolio, and our expenses. For the quarter, our public portfolio companies increased our NAV by $0.42, while our private portfolio companies decreased our NAV by $0.19. Operating expenses, both ongoing and accrual for bonus pool, decreased NAV by $0.15.
| | | | | | | | | | | | | | | | | |
| Quarter | YTD | 1 Year | 3 Year | Inception to Date |
| Q2 2021 | Q4 2020-Q2 2021 | Q2 2020-
Q2 2021 | Q2 2018-
Q2 2021 | Q4 2016-Q2 2021 |
| | | | | |
| | | | | |
| | | | | |
| Change in NAV | 0.8% | 15.1% | 31.9% | 22.3% | 52.1% |
| | | | | |
| Russell Microcap Index | 4.1% | 29.0% | 75.7% | 49.9% | 88.0% |
| Russell Microcap Value Index | 3.2% | 34.9% | 85.5% | 40.4% | 73.7% |
| Russell 2000 | 4.3% | 17.5% | 62.0% | 46.2% | 80.4% |
| | | | | |
| | | | | |
| | | | | |
Four and a half years ago, our Board of Directors asked our shareholders to vote on a strategy change for our business. In a significant landslide vote, our shareholders voted for the strategy change. If you weren’t quite sure about whether or not that decision was the right one, please look at the NAV trends for our business, both before and after. I think the chart speaks for itself.
Public Portfolio
In the chart below, you see our quarter to date, year-to-date, one-year, three-year, and inception to date performance numbers. For Q2 2021, we showed a gross total return for our public portfolio of +5.9% (+6.8% including carried interest), versus a gross total return for the Russell Microcap Index of +4.1% and a gross total return for the Russell Microcap Value Index of +3.2%. Year to date, our +35.9% gross total return (+40.8% including carried interest) compares favorably to the +29.0% return for the Russell Microcap and a +34.9% return for the Russell Microcap Value Index. Our long-term results, as seen in the chart below trounce the indices.
| | | | | | | | | | | | | | | | | |
| Quarter | YTD | 1 Year | 3 Year | Inception to Date |
| Q2 2021 | Q4 2020-Q2 2021 | Q2 2020-
Q2 2021 | Q2 2018-
Q2 2021 | Q4 2016-Q2 2021 |
TURN Public Portfolio
Gross Total Return
(Excluding SMA Carried Interest) | 5.9% | 35.9% | 79.5% | 114.1% | 377.9% |
TURN Public Portfolio
Gross Total Return
(Including SMA Carried Interest) | 6.8% | 40.8% | 93.6% | 130.9% | 382.3% |
| | | | | |
| | | | | |
| | | | | |
| Russell Microcap Index | 4.1% | 29.0% | 75.7% | 49.9% | 88.0% |
| Russell Microcap Value Index | 3.2% | 34.9% | 85.5% | 40.4% | 73.7% |
| Russell 2000 | 4.3% | 17.5% | 62.0% | 46.2% | 80.4% |
| | | | | |
| | | | | |
| | | | | |
Let’s dig into the significant sources of the changes in value in our public portfolio in Q2 2021. Sources of material increases in value:
•Potbelly Corporation (NASDAQ: PBPB) - In June 2020, we filed an amended Form 13D noting the poor performance of the company under its then CEO, while commending PBPB’s Board for hiring a new CFO with restaurant experience. Subsequently, PBPB’s Board hired Robert Wright, the former COO of Wendy’s, as its new CEO. PBPB raised capital in Q1 2021 to improve its balance sheet and aid in the restructuring of its debt. The company reported solid results for Q1 2021 and stated that starting in April 2021, average weekly same-store sales exceeded 2019 levels. The company accelerated its expectation of generating positive cash flow to Q3 2021 with enterprise-level profitability in the second half of 2021. The stock advanced 33.7% in the quarter and increased our NAV by $0.27 per share.
•Armstrong Flooring, Inc. (NYSE:AFI) - Following its large asset sale in Q1 2021, AFI reported continued improvement in gross margins, bookings, and its sales pipeline in Q1 2021. AFI’s CFO made material insider purchases of stock during Q2 2021. Prior to end of the quarter, we became concerned that inflationary pressures, primarily related to shipping costs and raw materials, were greater than management had originally expected, and AFI would not have enough scale to deal with the rising costs without them negatively impacting the business. As a result, we cut our position in half by selling 502,523 shares at an average price of $5.46. While we still believe in the long-term potential for this business, we simply have to become more realistic about these inflationary pressures and right sizing the business to operate profitably in the current environment. AFI’s stock was up 26.6% in the quarter and increased our NAV by $0.09.
•Synchronoss Technologies, Inc., (NASDAQ:SNCR) increased our NAV by $0.25, and we discuss this investment in greater detail below.
On the negative side:
•Quantum Corporation (NASDAQ: QMCO) – QMCO reported results for its fiscal fourth quarter that fell short of expectations due to shortages of one critical semiconductor part required for its tape drive systems. The company provided a wide range guidance for 2022 due to uncertainty as to when it’s supply chain issue will be resolved. The stock declined 17.3 % in the quarter and decreased our NAV by $0.16.
•Sonim Technologies, Inc. (NASDAQ: SONM) – In Q2 2021, SONM issued a surprise announcement with its year-end 2020 results that the SEC investigation, believed to be close to completion, was being extended; thus greater than expected pressure on SONM's cash position would occur in future quarters. Following this announcement, SONM noted its cash position may not be enough to fund operations of the company without additional capital raises. Following this announcement as well as reporting poor financial results, the CEO was removed. What was once a promising business environment following our lead in recapitalizing the company at $0.75 last year, has turned into a business we have lost faith in. The biggest miss was being caught by surprise that one of their biggest customers would cancel a phone that SONM had invested millions of dollars of capital on. That said another big mistake was becoming an observer to the Board at SONM. Following the recapitalization, and a couple of decent financial quarters, SONM’s stock advanced over 100% from our entry price. The problem 180 faced was the restriction placed on us as insiders that limited our ability to transact in the stock. We simply missed the window to sell at a gain on our investment that was afforded to every other shareholder who was free to trade. The reasons for owning the business have materially changed and in sticking to our sell discipline, we have decided to exit the position. It is a lesson learned in how being on boards has the potential to negatively impact your ability to create value for your shareholders. Of course, if your
original long-term thesis plays out the way you envision, this headwind wouldn’t occur. In SONM’s case, we got the thesis wrong. The stock declined 31.9% this quarter and hurt our NAV by $0.14 per share.
Subsequent to the end of the quarter, we sold the remainder of our holdings of SONM. We have often talked about how we do our best to minimize our mistakes while maximizing our successes. As much as we got this one wrong, the loss was contained to $1.3 million, or -28.7%. Part of the reason why the loss was contained was adherence to a strict buy discipline which takes out much of the risk given the price we are paying for the business we are buying.
•TheMaven, Inc. (OTC:MVEN) - MVEN is a media coalition of professional content destinations, operating exclusively on a shared digital publishing, advertising, and distribution platform. MVEN provides a major media scale alternative to news and information on social platforms. The high-scale, unified platform offers operating leverage to all participants in MVEN’s ecosystem by eliminating all non-content operating expenses. MVEN’s distributed operating leverage enables its entire suite of services to be provided on a revenue share basis, which creates lower, non-fixed operating costs than if a media company was forced to run its own platform and digital ad sales team. MVEN provides distribution across 100+ million monthly users in a single platform, allowing advertisers to be more successful with return on investments in marketing. Among its many properties, MVEN operates a 100-year license agreement to run Sports Illustrated and owns TheStreet.com, after acquiring that asset in 2019. MVEN continued to make progress in getting its financial statement current with the SEC by filing its 2019 Annual Report on Form 10-K and the first three quarters of 2020 on Form 10-Q. The company raised $20 million from existing investors at a price per share of $0.70 and completed the acquisition of TheSpun. The volume weighted average price per share to reach 1% of outstanding tradable stock (VWAP) declined from $0.7869 to $0.7357 during the quarter and decreased our NAV by $0.07.
We have two positions to highlight: Synchronoss Technologies, Inc. (NASDAQ:SNCR) and PFSweb, Inc. (NASDAQ:PFSW), which became large positions during the quarter. We have included for your viewing a one-page synopsis of both companies in our slide deck for our shareholder update call that can be found on our investor relations website at https://ir.180degreecapital.com/finanical-results.
On SNCR, like TST and HEAR before, we helped anchor a large transaction, designed to take out an expensive and restrictive preferred security held by Siris Capital Group. For SNCR, we believe that removing the overhang of this preferred instrument will materially improve GAAP EPS. Furthermore, if the company is smart enough to sell its messaging business, SNCR will become a pure play cloud company with the majority of its revenue being recurring. We hope to have helped unlock short term value while SNCR works towards a much brighter longer term.
As for PFSW, our investment thesis was simple. The company had two distinct businesses (exactly as TST had), a Board and management team focused on unlocking the value for each of these businesses, and a stock price that we believed did not reflect the fair value for the combined entity. In fact, we believed the sum of the parts value of PFSW was worth close to 100% more than where the stock was trading. The stock did not do much in Q2 2021. 180’s cost basis in PFSW is approximately $7.13 per share, for an implied fully diluted enterprise value of approximately ~$186mm. Using an estimated multiple to revenue of 1.8x for the LiveArea business, we believed it could be valued at $6.00-6.60 per share based on 2020 actual and 2021 estimated revenue, respectively. Using an estimated multiple to EBITDA of 8x for the PFS Operations business, we believed it could be valued at $4.60-5.28 per share based on 2020 actual and 2021 estimated EBITDA, respectively. This sum of the parts analysis yields our estimated value of PFSW on a combined basis of $10.60-11.88 per share. On July 6, 2021, PFSW announced the sale of its LiveArea business to Merkle for $250 million (3x 2021 revenue and 2.7x 2021 estimated revenue). The company estimates net proceeds will be $185-200 million, or $8.22-8.88 per share. This transaction increased our estimated value of PFSW to $12.82-14.16 per share. We note that we owned 105,545 shares of PFSW at the end of Q1 2021 but chose not to disclose the investment as we were in the process of building our position. We ended Q2 2021 with 530,328 shares of PFSW.
Private Portfolio
For the quarter, our private portfolio decreased in value by approximately $2.0 million, or $0.19 per share. The largest decreases were in HALE.life Corporation (financing risk) and AgBiome, LLC (liquidation preference changes in recent financing). As we said above, the company in which Black Silicon Holdings, Inc. has a profit interest in has agreed to be sold, and we currently anticipate this transaction will close before the end of Q3 2021. We will receive approximately $1 million from this transaction. Also, during the quarter, Lodo Therapeutics Corporation was acquired by Zymergen, Inc., in an all-stock transaction. In almost every shareholder letter, we state that while we desire to shepherd our existing private portfolio to exits or explore opportunities to sell our positions in those companies, we have the luxury of being able to sell our private holdings when we believe it makes sense for shareholders, rather than being forced to do so to survive. Because you haven’t seen a monetization in any given quarter, doesn’t mean we have not been active in attempting to monetize the portfolio. We do not have to sell anything, given our success in remaking our balance sheet over the last four years. And we won’t, unless the price makes sense. Since the start of TURN, our private portfolio has reduced NAV by $0.91 per share while our public investing strategy has increased NAV by $6.43 per share. In 2016 we had holdings in 32 private companies. Today we have 19 but only
10 that matter. Those 10 private holdings comprise 93% of all the private assets. Our hope is the ones we still own have limited downside and decent upside.
EXPENSES
As we have noted in previous letters, we have dramatically reduced our cost structure under our new strategy. In 2016, before our Fund’s change in investment focus and management team, our operating expenses, excluding stock-based compensation and interest on outstanding debt, averaged approximately $1.3 million per quarter. For Q2 2021, our operating expenses, excluding accruals for potential bonuses, equaled approximately $780,000. Given our persistent and outsized performance, the Compensation Committee approved an additional accrual of approximately $793,000 in the quarter, for a potential bonus pool at year end 2021. It should be noted the pool amount will fluctuate based on our total performance for the rest of 2021.
TURN/NAV: SUM OF THE PARTS
As of the end of Q2 2021, TURN traded at 75% of NAV. Our securities of publicly traded companies, cash, the pro rata portion of estimated carried interest from our SMA in 2021 and other assets, net of liabilities, were $7.48 per share. Our stock price was $8.06. If we received 100% credit for the value of these assets, net of liabilities, the market is ascribing a value of approximately $0.58 per share, or approximately $6 million, to our private portfolio. Given our private assets are valued at approximately $34.6 million, the market is discounting the value of our private portfolio assets by approximately 83% as of the end of Q2 2021. If you exclude the $1 million we currently expect to receive from the sale of the underlying asset to Black Silicon Holdings, Inc., the market is discounting the value of our remaining private portfolio by 85%.
As we grow our cash and securities of publicly traded companies, the discount our stock trades to NAV should narrow. I have mentioned in previous letters, AgBiome alone is fair valued at a greater value, than the market is pricing the entire portfolio. I will remind you that Petra Pharma Corporation was acquired in Q2 2020, and between our direct ownership in Petra and our indirect ownership through Accelerator IV-New York Corporation, we received approximately $4.7 million in cash. We retain ownership in a spinout company that will seek to monetize additional assets of the company, and we could receive future milestone payments of up to approximately $86.9 million. While the timing and likelihood of achieving these milestones is uncertain, and we could ultimately receive none of these milestone payments, the Petra acquisition was a material and positive event for 180 and its shareholders. We believe that our other private holdings not only have real value today, but also have the potential to monetize into cash in the future.
At the end of the day, the private portfolio is becoming less and less important to our success. From the chart below, look at how dramatically different our balance sheet looks today versus four and a half years ago. Given our performance in the public markets, combined with a stock price that “only” trades at the value of our cash and liquid securities, in my humble opinion, TURN’s stock is grossly mispriced.
And as you have seen almost every quarter, if the valuation gap doesn’t close, our management team will continue to be buyers in the open market.
CONCLUSION
We have generated outsized returns for the first half of 2021. We have plenty of year left and much to navigate through with regards to the economy, the hopeful end or at least substantial reduction of the impact in daily life of COVID-19, inflation fears, and enormous fiscal stimulus resulting in continually growing massive deficits. The start to the third quarter has been extremely choppy and volatile as the Delta variant is spreading very quickly throughout the globe. While I don’t think we will ever be subject to lockdowns as we were in the beginning of the pandemic, the virus is causing continued pain and suffering for those that contract it. It is also causing governments and companies to enforce stricter guidelines to help contain the virus. For example, last week the Mayor of New York City announced that New York City will require proof of COVID-19 vaccinations from employees and customers of indoor eateries, gyms and entertainment centers. I would have thought that having vaccines and administering those vaccines would have ended this pandemic, but simply put, vaccination rates are still not high enough and the original COVID-19 virus has mutated into the more easily transmitted Delta variant. Some days, this feels like this will never end. The worst part is, globally, there are many countries whose vaccination rates are lower than the United States and those countries are far behind in easing any sort of restrictions. For instance, there are full stay at home orders in Japan, which is why we watched the Olympics with no fans. While 180 focuses its investments on US domestic companies, many of our companies still rely on Asian countries for raw materials. We are seeing severe supply chain issues across the board for various raw materials. A recent chart published by the US census bureau, showed the following disruption of supply chains by sector:
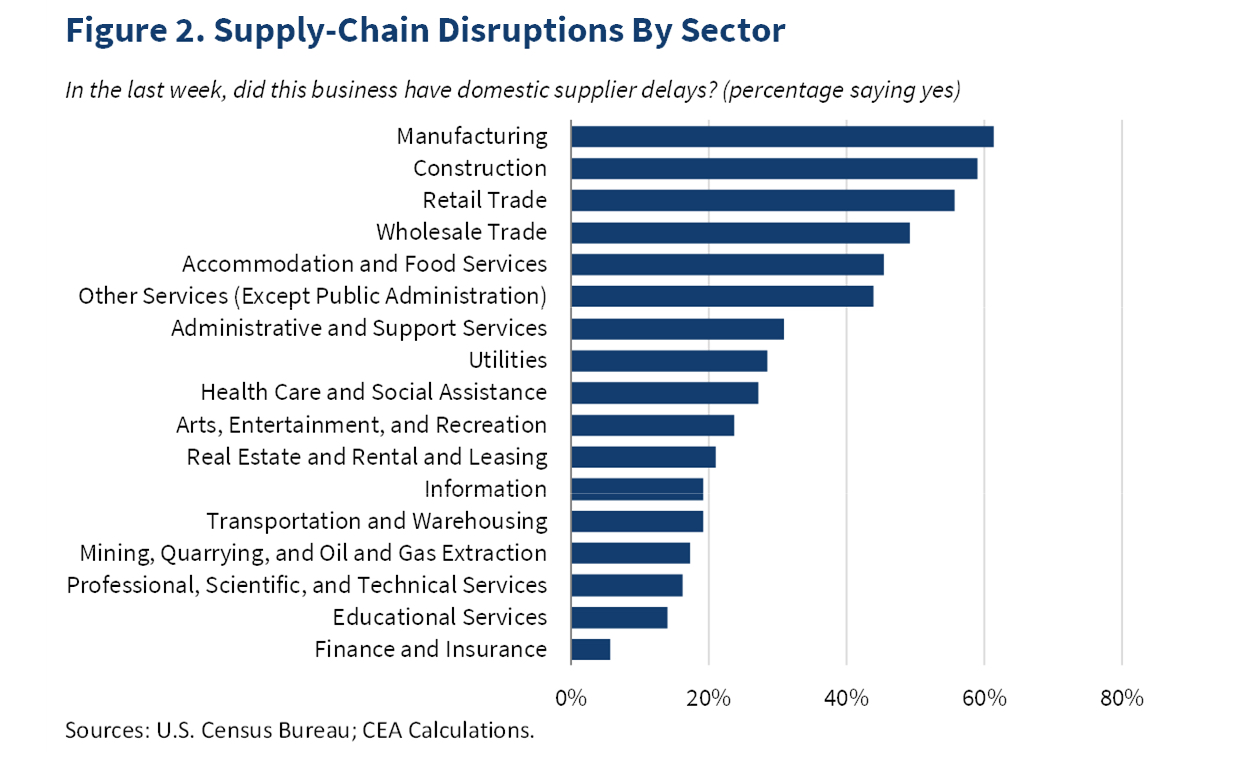
We are seeing constraints of availability of semiconductor chips, lumber, wallboard, and roofing products. We are seeing rising shipping costs and employee shortages for service-oriented businesses. We have seen faster inflation as a result of these shortages, and there doesn’t appear to be much relief in the short term. Simply put, while the stock market has cheered vaccinations and the near end of the pandemic, the actual reopening of the global economy has been challenging. We have seen that with our own companies. QMCO talked about the inability to secure a chip used for its tape products. LTRX cannot get enough components to meet demand. AFI has talked about supply chain issues and rising shipping costs. While all of this may be transient, we are a bit bearish on the current environment, thinking improvement for the manufacturing issues the global economy is facing will not occur for the next couple of quarters. The Russell Microcap Index is down 6% due in part to the turmoil caused by the surging Delta variant through the first month of Q3 2021. The good news is we do have vaccines, the pandemic is coming to an end (dare I say that), global demand is returning, and valuations for many companies are still offering good long-term risk/reward characteristics.
We have completely remade our business and created a real business with a real name in our microcap world. When I first joined the Board of Directors in mid-2016, we had just approximately $17 million in cash and securities of public companies net of outstanding debt. As the end of the Q2 2021, we have nearly $79 million in cash and securities of public companies on our balance sheet, and we grew the assets for our SMA client from $25 million to $41 million. For our performance in growing the value of the SMA in 2021, should it remain flat to where we ended Q2 2021, we have a potential to receive $2.8 million in carried interest at year end. This represents approximately 82% of our normal operating expenses, not including bonuses. We have controlled what we can control and have excelled in our public markets investing. We will continue to navigate through whatever waters the market presents and do our best to continue to enhance value for all of TURN’s shareholders.
We look forward to reviewing our subsequent quarters as the year unfolds.
Thank you for your continued support.
Kevin Rendino
Chairman and Chief Executive Officer
| | |
180 DEGREE CAPITAL CORP.
CONSOLIDATED STATEMENT OF ASSETS AND LIABILITIES (UNAUDITED) |
| | | | | |
| | June 30, 2021 |
| ASSETS | |
| Investments in portfolio securities, at value: | |
| Unaffiliated privately held securities (cost: $12,881,482) | $ | 19,675,862 | |
| Unaffiliated publicly traded securities (cost: $23,659,902) | 34,149,015 | |
| Non-controlled affiliated privately held securities (cost: $21,927,580) | 8,591,108 | |
| Non-controlled affiliated publicly traded securities (cost: $24,684,001) | 35,908,262 | |
| Unaffiliated rights to payments (cost: $6,408,684) | 6,341,873 | |
| Controlled privately held securities (cost: $69,400) | 69,400 | |
| Non-controlled affiliated derivative securities (cost: $224,849) | 355,839 | |
| Unaffiliated derivative securities (cost: $36,188) | 2 | |
| Cash | 7,578,517 | |
| Receivable from portfolio companies | 838,160 | |
| Receivable from securities sold | 468,584 | |
| Receivable from managed funds | 152,151 | |
| Prepaid expenses | 169,743 | |
| Other receivables | 9,219 | |
| Other assets | 29,060 | |
| Total assets | $ | 114,336,795 | |
| LIABILITIES & NET ASSETS | |
| |
| Bonus payable (Note 7) | $ | 1,775,629 | |
| Post-retirement plan liabilities | 825,836 | |
| Payable for securities purchased | 705,606 | |
| Accounts payable and accrued liabilities | 263,172 | |
| Total liabilities | $ | 3,570,243 | |
| Commitments and contingencies (Note 10) | |
| Net assets | $ | 110,766,552 | |
| Net assets are comprised of: | |
| Preferred stock, $0.10 par value, 2,000,000 shares authorized; none issued | $ | 0 | |
| Common stock, $0.03 par value, 15,000,000 shares authorized; 11,541,079 issued | 334,594 | |
| Additional paid in capital | 122,250,693 | |
| Total accumulated distributable loss | (7,213,210) | |
| Treasury stock, at cost 1,167,259 shares | (4,605,525) | |
| Net assets | $ | 110,766,552 | |
| Shares outstanding | 10,373,820 | |
| Net asset value per outstanding share | $ | 10.68 | |
The accompanying notes are an integral part of this unaudited consolidated schedule of investments.
11
| | |
180 DEGREE CAPITAL CORP.
CONSOLIDATED STATEMENT OF OPERATIONS (UNAUDITED) |
| | | | | |
| Six Months Ended
June 30, 2021 |
| Income: | |
| Interest from: | |
| Unaffiliated companies-PIK | $ | 10,363 | |
| Non-controlled affiliated companies-cash | (8,154) | |
| Non-controlled affiliated companies-PIK | 290,067 | |
| Other income (Note 2) | 43,167 | |
| Board fees from portfolio companies-cash | 23,250 | |
| Board fees from portfolio companies-non-cash | 31,449 | |
| Management fee income | 6,083 | |
| Miscellaneous income | 57,587 | |
| Total income | 453,812 | |
| Operating fees and expenses: | |
| Salaries, bonus and benefits | 2,253,398 | |
| Professional | 349,205 | |
| Administration and operations | 168,072 | |
| Directors | 142,500 | |
| Insurance | 155,021 | |
| Rent | 13,674 | |
| Custody | 16,189 | |
| Other | 3,475 | |
| Total operating expenses | 3,101,534 | |
| Net investment loss before income tax expense | (2,647,722) | |
| Income tax expense | 1,557 | |
| Net investment loss | (2,649,279) | |
| Net realized (loss) gain from investments: | |
| Unaffiliated privately held securities | (894,294) | |
| Unaffiliated publicly traded securities | 6,055,881 | |
| Non-controlled affiliated publicly traded securities | 174,575 | |
| Net realized gain from investments | 5,336,162 | |
| Realized gain from funds held in escrow | 163,043 | |
| Net realized gain | 5,499,205 | |
| Change in unrealized appreciation (depreciation) on investments: | |
| Unaffiliated privately held securities | 757,340 | |
| Unaffiliated publicly traded securities | 3,035,737 | |
| Non-controlled affiliated privately held securities | (2,378,260) | |
| Non-controlled affiliated publicly traded securities | 11,562,816 | |
| Unaffiliated rights to payments | (1,378,801) | |
| Net change in unrealized appreciation on investments | 11,598,832 | |
| Net realized gain from investments and change in unrealized appreciation on investments | 17,098,037 | |
| Net increase in net assets resulting from operations | $ | 14,448,758 | |
The accompanying notes are an integral part of this unaudited consolidated schedule of investments.
12
| | |
180 DEGREE CAPITAL CORP.
CONSOLIDATED STATEMENT OF CASH FLOWS (UNAUDITED) |
| | | | | |
| Six Months Ended
June 30, 2021 |
| Cash flows used in operating activities: | |
| Net increase in net assets resulting from operations | $ | 14,448,758 | |
| Adjustments to reconcile net increase in net assets resulting from operations to net cash used in operating activities: |
| Net realized gain from investments | (5,499,205) | |
| Net change in unrealized appreciation on investments | (11,598,832) | |
| Depreciation of fixed assets | 3,471 | |
| Accretion of bridge note PIK interest income | (300,430) | |
| Board fees from portfolio companies-non-cash | (31,449) | |
| Purchase of unaffiliated publicly traded securities | (22,725,051) | |
| Purchase of non-controlled affiliated publicly traded securities | (9,076,289) | |
| Purchase of controlled privately held securities | (69,400) | |
| Proceeds from sale of unaffiliated publicly traded securities | 21,992,320 | |
| Proceeds from sale of non-controlled affiliated publicly traded securities | 5,833,019 | |
| Proceeds from funds held in escrow from sales of investments | 323,683 | |
| Changes in assets and liabilities: | |
| Increase in receivable from sales of securities | (468,584) | |
| Decrease in receivable from managed funds | 2,486,229 | |
| Increase in receivable from portfolio securities | (43,167) | |
| Decrease in prepaid expenses | 156,202 | |
| Decrease in interest receivable | 8,154 | |
| Decrease in other assets | 4 | |
| Increase in bonus payable | 417,707 | |
| Decrease in post-retirement plan liabilities | (16,530) | |
| Increase in payable for securities purchased | 486,461 | |
| Decrease in accounts payable and accrued liabilities | (252,943) | |
| Net cash used in operating activities | (3,925,872) | |
| Cash flows from investing activities: | |
| Purchase of fixed assets | (4,696) | |
| Net cash used in investing activities | (4,696) | |
| Net decrease in cash and restricted cash | (3,930,568) | |
| Cash and restricted cash at beginning of the period | 11,509,085 | |
| Cash at end of the period | $ | 7,578,517 | |
| |
| Supplemental disclosures of cash flow information: | |
| Income taxes paid | $ | 1,557 | |
| |
| Cash | $ | 7,578,517 | |
| Restricted cash | 0 | |
| Total cash and restricted cash shown in the consolidated statement of cash flows | $ | 7,578,517 | |
| |
The accompanying notes are an integral part of this unaudited consolidated schedule of investments.
13
| | |
180 DEGREE CAPITAL CORP.
CONSOLIDATED STATEMENTS OF CHANGES IN NET ASSETS |
| | | | | | | | | | | |
| Six Months Ended
June 30, 2021 | | Year Ended December 31, 2020 |
| (UNAUDITED) | | |
| Changes in net assets from operations: | | | |
| Net investment loss | $ | (2,649,279) | | | $ | (510,224) | |
| Net realized gain (loss) on investments | 5,499,205 | | | (1,071,992) | |
| Net change in unrealized appreciation on investments | 11,598,832 | | | 2,709,272 | |
| Share of loss on equity method investment | 0 | | | (22,901) | |
| Net increase in net assets resulting from operations | 14,448,758 | | | 1,104,155 | |
| Net increase in net assets | 14,448,758 | | | 1,104,155 | |
| Net Assets: | | | |
| Beginning of the period/year | 96,317,794 | | | 95,213,639 | |
| End of the period/year | $ | 110,766,552 | | | $ | 96,317,794 | |
| | | |
The accompanying notes are an integral part of this unaudited consolidated schedule of investments.
14
| | |
180 DEGREE CAPITAL CORP.
CONSOLIDATED FINANCIAL HIGHLIGHTS |
| | | | | | | | | | | | | | | | | | | | | | | | | | | | | | | | | | | |
| Six Months Ended
Jun. 30, 2021 | | Year Ended Dec. 31 2020# | | Year Ended Dec. 31, 2019# | | Year Ended Dec. 31, 2018# | | Year Ended Dec. 31, 2017# | | Year Ended Dec. 31, 2016# |
| (UNAUDITED) | | | | | | | | | | |
| Per Share Operating Performance: | | | | | | | | | | | |
| Net asset value per share, beginning of the period/year | $ | 9.28 | | | $ | 9.18 | | | $ | 7.92 | | | $ | 7.80 | | | $ | 7.02 | | | $ | 8.64 | |
Net investment loss* | (0.25) | | | (0.05) | | | (0.48) | | | (0.21) | | | (0.36) | | | (0.45) | |
Net realized gain (loss) from investments* | 0.53 | | | (0.11) | | | 0.93 | | | (0.75) | | | (1.14) | | | (0.78) | |
Net change in unrealized appreciation (depreciation) on investments and options*1 | 1.12 | | | 0.26 | | | 0.81 | | | 1.08 | | | 2.40 | | | (0.36) | |
Share of loss on equity method investment*2 | 0.00 | | | 0.00 | | | 0.00 | | | 0.00 | | | 0.00 | | | 0.00 | |
| Total* | 1.40 | | | 0.10 | | | 1.26 | | | 0.12 | | | 0.90 | | | (1.59) | |
Net (decrease) increase as a result of stock-based compensation expense*2 | 0.00 | | | 0.00 | | | 0.00 | | | 0.00 | | | (0.03) | | | 0.03 | |
Net increase as a result of purchase of treasury stock | 0.00 | | | 0.00 | | | 0.00 | | | 0.00 | | | 0.00 | | | 0.00 | |
Net decrease as a result of acquisition of vested restricted stock awards related to employee withholding2 | 0.00 | | | 0.00 | | | 0.00 | | | 0.00 | | | (0.06) | | | (0.03) | |
| Total (decrease) increase from capital stock transactions | 0.00 | | | 0.00 | | | 0.00 | | | 0.00 | | | (0.09) | | | 0.00 | |
Net (decrease) increase as a result of other comprehensive (loss) income*2 | 0.00 | | | 0.00 | | | 0.00 | | | 0.00 | | | (0.03) | | | (0.03) | |
| Net increase (decrease) in net asset value | 1.40 | | | 0.10 | | | 1.26 | | | 0.12 | | | 0.78 | | | (1.62) | |
| Net asset value per share, end of the period/year | $ | 10.68 | | | $ | 9.28 | | | $ | 9.18 | | | $ | 7.92 | | | $ | 7.80 | | | $ | 7.02 | |
| | | | | | | | | | | |
| Stock price per share, end of the period/year | $ | 8.06 | | | $ | 6.66 | | | $ | 6.45 | | | $ | 5.25 | | | $ | 5.91 | | | $ | 4.14 | |
| Total return based on stock price | 21.02 | % | | 3.26 | % | | 22.86 | % | | (11.17) | % | | 42.75 | % | | (37.27) | % |
| Supplemental Data: | | | | | | | | | | | |
| Net assets, end of the period/year | $ | 110,766,552 | | | $ | 96,317,794 | | | $ | 95,213,639 | | | $ | 82,034,768 | | | $ | 81,042,989 | | | $ | 72,255,610 | |
| Ratio of expenses, excluding taxes, to average net assets | 2.94 | % | ^ | 4.61 | % | ^ | 6.42 | % | ^ | 3.62 | % | ^ | 6.26 | % | ^ | 7.88 | % |
| Ratio of expenses, including taxes, to average net assets | 2.94 | % | ^ | 4.61 | % | ^ | 6.42 | % | ^ | 3.63 | % | ^ | 6.28 | % | 3^ | 7.89 | % |
| Ratio of net investment loss to average net assets | (2.51) | % | | (0.59) | % | | (5.42) | % | | (2.82) | % | | (4.68) | % | | (5.64) | % |
| Average debt outstanding | $ | 0 | | | $ | 0 | | | $ | 0 | | | $ | 0 | | | $ | 0 | | | $ | 4,590,164 | |
| Average debt per share | $ | 0.00 | | | $ | 0.00 | | | $ | 0.00 | | | $ | 0.00 | | | $ | 0.00 | | | $ | 0.45 | |
| Portfolio turnover | 29.54 | % | | 35.16 | % | | 30.17 | % | | 20.43 | % | | 8.83 | % | | ** |
| Number of shares outstanding, end of the period/year | 10,373,820 | | | 10,373,820 | | | 10,373,820 | | | 10,373,820 | | | 10,373,820 | | | 10,301,363 | |
# Reflect a 1-for-3 reverse stock split that became effective on January 4, 2021. Refer to Note 1. The Company, for further information.
* Based on average shares outstanding.
^ The Company has entered into an expense offsetting arrangement with one of its unaffiliated brokers relating to broker fees paid. The total broker fee charged to the Company was applied as a credit to fees charged by an affiliate of the unaffiliated broker who the Company subscribes to for data services billed during the period/year. The Company received an offset to expense totaling approximately $31,900, $15,700, $17,500 and $5,700 with that broker for the years ended December 31, 2020, December 31, 2019, December 31, 2018 and December 31, 2017, respectively. The Company received an offset to expense totaling approximately $24,800 with that broker for the period ended June 30, 2021.
**Prior to March 2017, the Company was a business development company investing primarily in privately held securities. Portfolio turnover was not a relevant indicator for such investments given that the Company did not generally pay brokerage fees on such investments.
1 Net unrealized losses include rounding adjustments to reconcile change in net asset value per share.
2 Amounts listed as zero are amounts calculated as less than $0.005.
3 Ratio of expenses, including taxes and excluding expenses related to restructuring, to quarterly average net assets for the year ended December 31, 2017 was 5.19%.
The accompanying notes are an integral part of this unaudited consolidated schedule of investments.
15
| | | | | | | | | | | | | | | | | | | | | | | | | | | | | |
| 180 DEGREE CAPITAL CORP. CONSOLIDATED SCHEDULE OF INVESTMENTS AS OF JUNE 30, 2021 (UNAUDITED) |
| | | | | | | | | |
| Method of
Valuation (1) | | Industry | | Shares/Principal | | Cost | | Value |
| | | | | | | | | | | | | | | | | | | | | | | | | | | | | |
| Investments in Unaffiliated Securities (2) - | | | | | | | | | |
| 48.6% of net assets at value | | | | | | | | | |
| | | | | | | | | |
| Privately Held Securities (Illiquid) - | | | | | | | | | |
| 17.8% of net assets at value | | | | | | | | | |
| | | | | | | | | |
| AgBiome, LLC (3)(4) | | | Fertilizers & Agricultural Chemicals | | | | | | |
| Develops agricultural products that reduce risk and improve yield | | | | | | | | | |
| Series A-1 Convertible Preferred Units (acquired 1/30/13) | (H) (L3) | | | | 2,000,000 | | | $ | 2,000,000 | | | $ | 9,408,468 | |
| Series A-2 Convertible Preferred Units (acquired 4/9/13-10/15/13) | (H) (L3) | | | | 417,392 | | | 521,740 | | | 1,964,803 | |
| Series B Convertible Preferred Units (acquired 8/7/15) | (H) (L3) | | | | 160,526 | | | 500,006 | | | 769,213 | |
| | | | | | | 3,021,746 | | | 12,142,484 | |
| | | | | | | | | |
| AutoTech Ventures Management I, LLC (3)(4)(5) | | | Asset Management & Custody Banks | | | | | | |
| Venture capital investing in automotive-related companies | | | | | | | | | |
| LLC Interests (acquired 12/1/17) | (M) (L3) | | | | 0 | | | 0 | | | 225,000 | |
| | | | | | | | | |
| D-Wave Systems, Inc. (3)(4)(6)(7) | | | Technology Hardware, Storage & Peripherals | | | | | | |
| Develops high-performance quantum computing systems | | | | | | | | | |
| Class A Convertible Preferred Stock (acquired 4/14/20) | (H) (L3) | | | | 1,025,045.6 | | | 1,238,050 | | | 1,635,690 | |
| | | | | | | | | |
| Fleet Health Alliance, LLC (3)(4)(7) | | | Health Care Technology | | | | | | |
| Develops software for information transfer amongst healthcare providers and consumers | | | | | | | | | |
| Unsecured Convertible Bridge Note, 0%, (acquired 4/22/16, no maturity date) | (I) (L3) | | | | $ | 225,000 | | | 225,000 | | | 0 | |
| | | | | | | | | |
| Magnolia Neurosciences Corporation (3)(4)(7) | | | Pharmaceuticals | | | | | | |
| Develops novel therapeutics for treatment of neurodegeneration | | | | | | | | | |
| Series A Convertible Preferred Stock (acquired 8/3/18) | (I) (L3) | | | | 862,872 | | | 862,872 | | | 874,837 | |
| | | | | | | | | |
The accompanying notes are an integral part of this unaudited consolidated schedule of investments.
16
| | | | | | | | | | | | | | | | | | | | | | | | | | | | | |
| 180 DEGREE CAPITAL CORP. CONSOLIDATED SCHEDULE OF INVESTMENTS AS OF JUNE 30, 2021 (UNAUDITED) |
| | | | | | | | | |
| Method of
Valuation (1) | | Industry | | Shares/Principal | | Cost | | Value |
| | | | | | | | | | | | | | | | | | | | | | | | | | | | | |
| Investments in Unaffiliated Securities (2) - | | | | | | | | | |
| 48.6% of net assets at value (cont.) | | | | | | | | | |
| | | | | | | | | |
| Privately Held Securities (Illiquid) - | | | | | | | | | |
| 17.8% of net assets at value (cont.) | | | | | | | | | |
| | | | | | | | | |
| Nanosys, Inc. (3)(4)(7)(8) | | | Specialty Chemicals | | | | | | |
| Develops inorganic nanowires and quantum dots for use in LED-backlit devices | | | | | | | | | |
| Series A-1 Convertible Preferred Stock (acquired 5/22/21) | (H) (L3) | | | | 496,572 | | | $ | 496,573 | | | $ | 437,425 | |
| Series A-2 Convertible Preferred Stock (acquired 5/22/21) | (H) (L3) | | | | 2,232,001 | | | 4,500,003 | | | 1,660,747 | |
| | | | | | | 4,996,576 | | | 2,098,172 | |
| | | | | | | | | |
| Phylagen, Inc. (3)(4)(7) | | | Research & Consulting Services | | | | | | |
| Develops technology to improve human health and business productivity | | | | | | | | | |
| Series A Convertible Preferred Stock (acquired 11/14/18) | (M) (L3) | | | | 548,031 | | | 233,845 | | | 374,689 | |
| | | | | | | | | |
| Ravenna Pharmaceuticals, Inc. (3)(4)(7)(9)(10) | | | Pharmaceuticals | | | | | | |
| Holding company for intellectual property in oncology therapeutics | | | | | | | | | |
| Common Stock (acquired 5/14/20) | (M) (L3) | | | | 2,584,763 | | | 103,391 | | | 62,746 | |
| | | | | | | | | |
| Seaport Diagnostics, Inc. (3)(4)(7)(11) | | | Health Care Technology | | | | | | |
| Develops consumer focused genetic tests | | | | | | | | | |
| Series 1 Convertible Preferred Stock (acquired 2/5/15-8/5/15) | (H) (L3) | | | | 1,195,315 | | | 500,000 | | | 939,139 | |
| Series A Convertible Preferred Stock (acquired 11/25/15-9/7/16) | (H) (L3) | | | | 1,364,666 | | | 1,500,000 | | | 1,158,949 | |
| Series A-2 Convertible Preferred Stock (acquired 5/11/17-2/8/18) | (H) (L3) | | | | 176,386 | | | 200,002 | | | 164,156 | |
| | | | | | | 2,200,002 | | | 2,262,244 | |
| | | | | | | | | |
| Total Unaffiliated Privately Held Securities (cost: $12,881,482) | | | | | | | | | $ | 19,675,862 | |
| | | | | | | | | |
The accompanying notes are an integral part of this unaudited consolidated schedule of investments.
17
| | | | | | | | | | | | | | | | | | | | | | | | | | | | | |
| 180 DEGREE CAPITAL CORP. CONSOLIDATED SCHEDULE OF INVESTMENTS AS OF JUNE 30, 2021 (UNAUDITED) |
| | | | | | | | | |
| Method of
Valuation (1) | | Industry | | Shares/Principal | | Cost | | Value |
| | | | | | | | | | | | | | | | | | | | | | | | | | | | | |
| Investments in Unaffiliated Securities (2) - | | | | | | | | | |
| 48.6% of net assets at value (cont.) | | | | | | | | | |
| | | | | | | | | |
| Unaffiliated Publicly Traded Securities - | | | | | | | | | |
| 30.8% of net assets at value | | | | | | | | | |
| | | | | | | | | |
| Alta Equipment Group, Inc. (4) | | | Trading Companies & Distributors | | | | | | |
| Operates as an industrial and construction equipment company | | | | | | | | | |
| Common Stock (acquired 2/14/20-11/12/20) | (M) (L1) | | | | 491,729 | | | $ | 3,790,118 | | | $ | 6,535,078 | |
| | | | | | | | | |
| Armstrong Flooring, Inc. (4) | | | Building Products | | | | | | |
| Produces flooring products | | | | | | | | | |
| Common Stock (acquired 12/22/20-4/21/21) | (M) (L1) | | | | 506,690 | | | 2,377,598 | | | 3,136,411 | |
| | | | | | | | | |
| Enzo Biochem, Inc. (4) | | | Health Care Services | | | | | | |
| Develops health care products and provides diagnostic services | | | | | | | | | |
| Common Stock (acquired 1/13/21-2/23/21) | (M) (L1) | | | | 436,201 | | | 1,326,902 | | | 1,382,757 | |
| | | | | | | | | |
| Everspin Technologies, Inc. (4) | | | Semiconductors | | | | | | |
| Develops magnetic random access memory products | | | | | | | | | |
| Common Stock (acquired 1/6/21-5/17/21) | (M) (L1) | | | | 330,347 | | | 1,839,474 | | | 2,124,131 | |
| | | | | | | | | |
| Lantronix, Inc. (4) | | | Communications Equipment | | | | | | |
| Provides secure data access and management solutions | | | | | | | | | |
| Common Stock (acquired 9/18/18-5/26/21) | (M) (L1) | | | | 653,490 | | | 2,307,933 | | | 3,372,008 | |
| | | | | | | | | |
| PFSweb, Inc. (4) | | | IT Consulting & Other Services | | | | | | |
| Provides management services for ecommerce | | | | | | | | | |
| Common Stock (acquired 3/19/21-6/30/21) | (M) (L1) | | | | 530,328 | | | 3,780,312 | | | 3,913,821 | |
| | | | | | | | | |
| Quantum Corporation (4) | | | Technology Hardware, Storage & Peripherals | | | | | | |
| Provides high-density data storage and high-speed data processing solutions | | | | | | | | | |
| Common Stock (acquired 2/4/19-6/28/21) | (M) (L1) | | | | 1,211,510 | | | 3,524,799 | | | 8,347,304 | |
| | | | | | | | | |
The accompanying notes are an integral part of this unaudited consolidated schedule of investments.
18
| | | | | | | | | | | | | | | | | | | | | | | | | | | | | |
| 180 DEGREE CAPITAL CORP. CONSOLIDATED SCHEDULE OF INVESTMENTS AS OF JUNE 30, 2021 (UNAUDITED) |
| | | | | | | | | |
| Method of
Valuation (1) | | Industry | | Shares/Principal | | Cost | | Value |
| | | | | | | | | | | | | | | | | | | | | | | | | | | | | |
| Investments in Unaffiliated Securities (2) - | | | | | | | | | |
| 48.6% of net assets at value (cont.) | | | | | | | | | |
| | | | | | | | | |
| Unaffiliated Publicly Traded Securities - | | | | | | | | | |
| 30.8% of net assets at value (cont.) | | | | | | | | | |
| | | | | | | | | |
| Sonim Technologies, Inc. (4) | | | Technology Hardware, Storage & Peripherals | | | | | | |
| Provides rugged communications products | | | | | | | | | |
| Common Stock (acquired 6/5/20-6/30/21) | (M) (L1) | | | | 1,907,054 | | | $ | 1,437,535 | | | $ | 1,064,136 | |
| | | | | | | | | |
| Zymergen, Inc. (3)(4)(7)(12) | | | Specialty Chemicals | | | | | | |
| Provides biomanufacturing technology and services | | | | | | | | | |
| Common Stock (acquired 5/17/21) | (M) (L3) | | | | 10,735 | | | 360,615 | | | 429,507 | |
| | | | | | | | | |
| Miscellaneous Common Stocks (13) | (M) (L1) | | | | | | 2,914,616 | | | 3,843,862 | |
| | | | | | | | | |
| Total Unaffiliated Publicly Traded Securities (cost: $23,659,902) | | | | | | | | | $ | 34,149,015 | |
| | | | | | | | | |
| Total Investments in Unaffiliated Securities (cost: $36,541,384) | | | | | | | | | $ | 53,824,877 | |
| | | | | | | | | |
| Investments in Non-Controlled Affiliated Securities (2) - | | | | | | | | | |
| 40.2% of net assets at value | | | | | | | | | |
| | | | | | | | | |
| Privately Held Securities (Illiquid) - | | | | | | | | | |
| 7.8% of net assets at value | | | | | | | | | |
| | | | | | | | | |
| ABSMaterials, Inc. (3)(7)(10) | | | Specialty Chemicals | | | | | | |
| Develops nano-structured absorbent materials for water remediation and consumer applications | | | | | | | | | |
| Series A Convertible Preferred Stock (acquired 2/17/10-10/24/11) | (I) (L3) | | | | 390,000 | | | $ | 435,000 | | | $ | 0 | |
| Series B Convertible Preferred Stock (acquired 11/8/13-6/25/14) | (I) (L3) | | | | 1,037,751 | | | 1,217,644 | | | 0 | |
| Secured Convertible Bridge Note, 8% PIK, (acquired 1/20/16, maturing 12/31/21) | (I) (L3) | | | | $ | 100,000 | | | 100,000 | | | 0 | |
| Secured Convertible Bridge Note, 8% PIK, (acquired 3/28/17, maturing 12/31/21) | (I) (L3) | | | | $ | 25,000 | | | 25,000 | | | 0 | |
| | | | | | | 1,777,644 | | | 0 | |
| | | | | | | | | |
The accompanying notes are an integral part of this unaudited consolidated schedule of investments.
19
| | | | | | | | | | | | | | | | | | | | | | | | | | | | | |
| 180 DEGREE CAPITAL CORP. CONSOLIDATED SCHEDULE OF INVESTMENTS AS OF JUNE 30, 2021 (UNAUDITED) |
| | | | | | | | | |
| Method of
Valuation (1) | | Industry | | Shares/Principal | | Cost | | Value |
| | | | | | | | | | | | | | | | | | | | | | | | | | | | | |
| Investments in Non-Controlled Affiliated Securities (2) - | | | | | | | | | |
| 40.2% of net assets at value (cont.) | | | | | | | | | |
| | | | | | | | | |
| Privately Held Securities (Illiquid) - | | | | | | | | | |
| 7.8% of net assets at value (cont.) | | | | | | | | | |
| | | | | | | | | |
| Accelerator IV-New York Corporation (3)(7)(14) | | | Research & Consulting Services | | | | | | |
| Identifies and managing emerging biotechnology companies | | | | | | | | | |
| Series A Common Stock (acquired 7/21/14-12/12/18) | (I) (L3) | | | | 833,333 | | | $ | 0 | | | $ | 587,462 | |
| | | | | | | | | |
| Black Silicon Holdings, Inc. (3)(7)(10)(15) | | | Semiconductors | | | | | | |
| Holding company for interest in a company that develops silicon-based optoelectronic products | | | | | | | | | |
| Series A Convertible Preferred Stock (acquired 8/4/15) | (M) (L3) | | | | 233,499 | | | 750,000 | | | 0 | |
| Series A-1 Convertible Preferred Stock (acquired 8/4/15) | (M) (L3) | | | | 2,966,667 | | | 890,000 | | | 0 | |
| Series A-2 Convertible Preferred Stock (acquired 8/4/15) | (M) (L3) | | | | 4,207,537 | | | 2,445,000 | | | 0 | |
| Series B-1 Convertible Preferred Stock (acquired 8/4/15) | (M) (L3) | | | | 1,892,836 | | | 1,169,561 | | | 0 | |
| Series C Convertible Preferred Stock (acquired 8/4/15) | (M) (L3) | | | | 1,674,030 | | | 1,171,316 | | | 0 | |
| Secured Convertible Bridge Note, 8% PIK, (acquired 8/25/16, maturing 8/4/21) | (M) (L3) | | | | $ | 1,278,453 | | | 1,781,596 | | | 1,007,596 | |
| | | | | | | 8,207,473 | | | 1,007,596 | |
| | | | | | | | | |
| EchoPixel, Inc. (3)(4)(7) | | | Health Care Equipment | | | | | | |
| Develops virtual reality 3-D visualization software for life sciences and health care applications | | | | | | | | | |
| Series Seed Convertible Preferred Stock (acquired 6/21/13-6/30/14) | (I) (L3) | | | | 4,194,630 | | | 1,250,000 | | | 787,976 | |
| Series Seed-2 Convertible Preferred Stock (acquired 1/22/16) | (I) (L3) | | | | 1,476,668 | | | 500,000 | | | 281,094 | |
| Series A-2 Convertible Preferred Stock (acquired 3/23/17) | (I) (L3) | | | | 1,471,577 | | | 350,000 | | | 337,920 | |
| | | | | | | 2,100,000 | | | 1,406,990 | |
| | | | | | | | | |
The accompanying notes are an integral part of this unaudited consolidated schedule of investments.
20
| | | | | | | | | | | | | | | | | | | | | | | | | | | | | |
| 180 DEGREE CAPITAL CORP. CONSOLIDATED SCHEDULE OF INVESTMENTS AS OF JUNE 30, 2021 (UNAUDITED) |
| | | | | | | | | |
| Method of
Valuation (1) | | Industry | | Shares/Principal | | Cost | | Value |
| | | | | | | | | | | | | | | | | | | | | | | | | | | | | |
| Investments in Non-Controlled Affiliated Securities (2) - | | | | | | | | | |
| 40.2% of net assets at value (cont.) | | | | | | | | | |
| | | | | | | | | |
| Privately Held Securities (Illiquid) - | | | | | | | | | |
| 7.8% of net assets at value (cont.) | | | | | | | | | |
| | | | | | | | | |
| Essential Health Solutions, Inc. (3)(7) | | | Health Care Technology | | | | | | |
| Develops software for information transfer amongst healthcare providers and consumers | | | | | | | | | |
| Common Stock (acquired 11/18/16) | (I) (L3) | | | | 200,000 | | | $ | 20 | | | $ | 0 | |
| Series A Convertible Preferred Stock (acquired 11/18/16) | (I) (L3) | | | | 2,750,000 | | | 2,750,000 | | | 44,975 | |
| Unsecured Convertible Bridge Note, 8%, (acquired 12/19/18, maturing 12/19/21) | (I) (L3) | | | | $ | 50,000 | | | 50,000 | | | 2,225 | |
| | | | | | | 2,800,020 | | | 47,200 | |
| | | | | | | | | |
| HALE.life Corporation (3)(4)(7) | | | Health Care Technology | | | | | | |
| Develops a platform to facilitate precision health and medicine | | | | | | | | | |
| Common Stock (acquired 3/1/16) | (I) (L3) | | | | 1,000,000 | | | 10 | | | 72,218 | |
| Series Seed-1 Convertible Preferred Stock (acquired 3/28/17) | (I) (L3) | | | | 11,000,000 | | | 1,896,920 | | | 1,098,079 | |
| Series Seed-2 Convertible Preferred Stock (acquired 12/28/18) | (I) (L3) | | | | 12,083,132 | | | 2,500,000 | | | 1,280,288 | |
| | | | | | | 4,396,930 | | | 2,450,585 | |
| | | | | | | | | |
| TARA Biosystems, Inc. (3)(4)(7) | | | Life Sciences Tools & Services | | | | | | |
| Develops human tissue models for toxicology and drug discovery applications | | | | | | | | | |
| Common Stock (acquired 8/20/14) | (I) (L3) | | | | 2,000,000 | | | 20 | | | 557,373 | |
| Series A Convertible Preferred Stock (acquired 3/31/17) | (I) (L3) | | | | 6,878,572 | | | 2,545,493 | | | 2,455,711 | |
| Series A-2 Convertible Preferred Stock (acquired 4/18/19) | (I) (L3) | | | | 208,577 | | | 100,000 | | | 78,191 | |
| | | | | | | 2,645,513 | | | 3,091,275 | |
| | | | | | | | | |
| Total Non-Controlled Affiliated Privately Held Securities (cost: $21,927,580) | | | | | | | | | $ | 8,591,108 | |
| | | | | | | | | |
The accompanying notes are an integral part of this unaudited consolidated schedule of investments.
21
| | | | | | | | | | | | | | | | | | | | | | | | | | | | | |
| 180 DEGREE CAPITAL CORP. CONSOLIDATED SCHEDULE OF INVESTMENTS AS OF JUNE 30, 2021 (UNAUDITED) |
| | | | | | | | | |
| Method of
Valuation (1) | | Industry | | Shares/Principal | | Cost | | Value |
| | | | | | | | | | | | | | | | | | | | | | | | | | | | | |
| Investments in Non-Controlled Affiliated Securities (2) - | | | | | | | | | |
| 40.2% of net assets at value (cont.) | | | | | | | | | |
| | | | | | | | | |
| Non-Controlled Affiliated Publicly Traded Securities - | | | | | | | | | |
| 32.4% of net assets at value | | | | | | | | | |
| | | | | | | | | |
| Potbelly Corporation (4)(16) | | | Restaurants | | | | | | |
| Operates a chain of sandwich shops | | | | | | | | | |
| Common Stock (acquired 6/24/19-2/10/21) | (M) (L1) | | | | 1,243,059 | | | $ | 5,097,814 | | | $ | 9,820,166 | |
| | | | | | | | | |
| Synalloy Corporation (4)(16) | | | Steel | | | | | | |
| Manufactures metals and chemicals | | | | | | | | | |
| Common Stock (acquired 12/7/20-5/25/21) | (M) (L1) | | | | 323,138 | | | 2,795,173 | | | 3,228,149 | |
| | | | | | | | | |
| Synchronoss Technologies, Inc. (4)(16) | | | Application Software | | | | | | |
| Provides white-label cloud storage, messaging and other digital analytic services | | | | | | | | | |
| Common Stock (acquired 7/17/20-6/25/21) | (M) (L1) | | | | 3,205,494 | | | 8,791,014 | | | 11,507,723 | |
| | | | | | | | | |
| TheMaven, Inc. (3)(4)(16) | | | Interactive Media & Services | | | | | | |
| Provides a shared digital publishing, advertising and distribution platform | | | | | | | | | |
| Series H Convertible Preferred Stock (acquired 6/27/19) (17) | (M) (L3) | | | | 1,320 | | | 2,000,000 | | | 2,943,589 | |
| Common Stock (acquired 12/18/20) | (M) (L3) | | | | 11,429,000 | | | 6,000,000 | | | 8,408,635 | |
| | | | | | | 8,000,000 | | | 11,352,224 | |
| | | | | | | | | |
| Total Non-Controlled Affiliated Publicly Traded Securities (cost: $24,684,001) | | | | | | | | | $ | 35,908,262 | |
| | | | | | | | | |
| Total Investments in Non-Controlled Affiliated Securities (cost: $46,611,581) | | | | | | | | | $ | 44,499,370 | |
| | | | | | | | | |
The accompanying notes are an integral part of this unaudited consolidated schedule of investments.
22
| | | | | | | | | | | | | | | | | | | | | | | | | | | | | |
| 180 DEGREE CAPITAL CORP. CONSOLIDATED SCHEDULE OF INVESTMENTS AS OF JUNE 30, 2021 (UNAUDITED) |
| | | | | | | | | |
| Method of
Valuation (1) | | Industry | | Shares/Principal | | Cost | | Value |
| | | | | | | | | | | | | | | | | | | | | | | | | | | | | |
| Controlled Affiliated Privately Held Securities (2) - | | | | | | | | | |
| 0.1% of net assets at value | | | | | | | | | |
| | | | | | | | | |
| LS180 Acquisition Holdings, LLC (3)(4) | | | Specialized Finance | | | | | | |
| Holding company for Special Purpose Acquisition Company (SPAC) interests | | | | | | | | | |
| Common Units (acquired 4/13/21) | (M) (L3) | | | | 1,300,000 | | | $ | 13,000 | | | $ | 13,000 | |
| Unsecured Promissory Note, 0% (acquired 5/10/21, maturing 12/31/21) | (M) (L3) | | | | $ | 50,000 | | | 50,000 | | | 50,000 | |
| | | | | | | 63,000 | | | 63,000 | |
| | | | | | | | | |
| Parabellum Acquisition Holdings, LLC (3)(4) | | | Specialized Finance | | | | | | |
| Holding company for Special Purpose Acquisition Company (SPAC) interests | | | | | | | | | |
| Common Units (acquired 4/22/21) | (M) (L3) | | | | 640,000 | | | 6,400 | | | 6,400 | |
| | | | | | | | | |
| Total Controlled Affiliated Privately Held Securities (cost: $69,400) | | | | | | | | | $ | 69,400 | |
| | | | | | | | | |
| Total Investments in Privately Held Securities and Publicly Traded Securities (cost: $83,222,365) | | | | | | | | | $ | 98,393,647 | |
| | | | | | | | | |
| Derivative Securities - | | | | | | | | | |
| 0.3% of net assets at value | | | | | | | | | |
| | | | | | | | | |
| Unaffiliated Derivative Securities (2) - | | | | | | | | | |
| 0.0% of net assets at value | | | | | | | | | |
| | | | | | | | | |
| NanoTerra, Inc. (3)(4)(10) | | | Research & Consulting Services | | | | | | |
| Develops surface chemistry and nano-manufacturing solutions | | | | | | | | | |
| Warrants for Series A-3 Preferred Stock expiring on 11/15/22 (acquired 11/15/12) | (I) (L3) | | | | 47,508 | | | $ | 35,403 | | | $ | 0 | |
| | | | | | | | | |
| OpGen, Inc. (4) | | | Biotechnology | | | | | | |
| Developing tools for genomic sequence assembly and analysis | | | | | | | | | |
| Warrants for the Purchase of Common Stock expiring 2/17/25 (acquired 5/5/15) | (I) (L3) | | | | 62 | | | 785 | | | 2 | |
| | | | | | | | | |
| Total Unaffiliated Derivative Securities (cost: $36,188) | | | | | | | | | $ | 2 | |
| | | | | | | | | |
The accompanying notes are an integral part of this unaudited consolidated schedule of investments.
23
| | | | | | | | | | | | | | | | | | | | | | | | | | | | | |
| 180 DEGREE CAPITAL CORP. CONSOLIDATED SCHEDULE OF INVESTMENTS AS OF JUNE 30, 2021 (UNAUDITED) |
| | | | | | | | | |
| Method of
Valuation (1) | | Industry | | Shares/Principal | | Cost | | Value |
| | | | | | | | | | | | | | | | | | | | | | | | | | | | | |
| Non-Controlled Affiliated Derivative Securities (2) - | | | | | | | | | |
| 0.3% of net assets at value | | | | | | | | | |
| | | | | | | | | |
| Potbelly Corporation (3)(4) | | | Restaurants | | | | | | |
| Operates a chain of sandwich shops | | | | | | | | | |
| Warrants for the Purchase of Common Stock expiring 2/12/26 (acquired 2/10/21) | (I) (L3) | | | | 80,605 | | | $ | 224,849 | | | $ | 355,839 | |
| | | | | | | | | |
| Total Non-Controlled Affiliated Derivative Securities (cost: $224,849) | | | | | | | | | $ | 355,839 | |
| | | | | | | | | |
| Total Derivative Securities (cost: $261,037) | | | | | | | | | $ | 355,841 | |
| | | | | | | | | |
| Total Investments (cost: $83,483,402) | | | | | | | | | $ | 98,749,488 | |
| | | | | | | | | |
| Other Financial Instruments (18) - | | | | | | | | | |
| | | | | | | | | |
| Unaffiliated Rights to Payments (Illiquid) (2) - | | | | | | | | | |
| 5.7% of net assets at value | | | | | | | | | |
| | | Biotechnology | | | | | | |
| Rights to Milestone Payments from Acquisition of BioVex Group, Inc. (acquired 3/4/11) (3)(4)(7)(19) | (I) (L3) | | | | $ | 548,998 | | | $ | 548,998 | | | $ | 407,668 | |
| | | | | | | | | |
| | | Pharmaceuticals | | | | | | |
| Rights to Milestone Payments from Acquisition of Petra Pharma Corporation (acquired 5/14/20) (3)(4)(7)(20) | (I) (L3) | | | | $ | 5,859,686 | | | 5,859,686 | | | 5,934,205 | |
| | | | | | | | | |
| Total Unaffiliated Rights to Payments (cost: $6,408,684) | | | | | | | | | $ | 6,341,873 | |
| | | | | | | | | |
| Total Investments in Privately Held Securities and Publicly Traded Securities and Derivative Securities and Other Financial Instruments (cost: $89,892,086) | | | | | | | | | $ | 105,091,361 | |
The accompanying notes are an integral part of this unaudited consolidated schedule of investments.
24
180 DEGREE CAPITAL CORP.
NOTES TO CONSOLIDATED SCHEDULE OF INVESTMENTS AS OF JUNE 30, 2021
(UNAUDITED)
Notes to Consolidated Schedule of Investments
(1)See Note 2. Summary of Significant Accounting Policies: Portfolio Investment Valuations.
(2)Investments in unaffiliated securities consist of investments in which the Company owns less than five percent of the voting shares of the portfolio company. Investments in non-controlled affiliated securities consist of investments in which the Company owns five percent or more, but less than 25 percent, of the voting shares of the portfolio company, or where the Company controls one or more seats on the portfolio company’s board of directors but do not control the company. Investments in controlled affiliated securities consist of investments in which the Company owns 25 percent or more of the outstanding voting rights of the portfolio company or otherwise control the company, including control of a majority of the seats on the board of directors, or more than 25 percent of the seats on the board of directors, with no other entity or person in control of more director seats than us.
(3)The Company is subject to legal restrictions on the sale of all or a portion of our investment(s) in this company. The total amount of restricted securities held is $46,815,813, or 42.3 percent of net assets.
(4)Represents a non-income producing investment. Investments that have not paid dividends or interest within the last 12 months or are on non-accrual status for at least 12 consecutive months are considered to be non-income producing.
(5)The Company received LLC Interests of 1.25 percent in AutoTech Ventures Management I, LLC ("AutoTech") pursuant to an Administrative Services Agreement between us and AutoTech and due to us following the termination of a former employee of the Company. These LLC Interests were separate from the compensation received for providing the administrative services under the agreement that were paid in cash. The LLC interests have a capital percentage of 0 percent.
(6)The Company initially invested in D-Wave Systems, Inc. starting in 2008 and through 2014, acquiring various classes of preferred stock. On April 14, 2020, D-Wave Systems, Inc. reorganized as a subsidiary of a new company, DWSI Holdings, Inc. ("DWSI"). As part of the reorganization, all of the outstanding stock of D-Wave Systems, Inc., was consolidated into a single class of preferred stock of DWSI on a one-for-one basis. DWSI then completed a 1-for-5 reverse stock split. In January 2021, D-Wave Systems completed an amalgamation of the reorganized business and changed its corporate name back to D-Wave Systems, Inc. The company is located and doing business primarily in Canada.
(7)These securities are held by the Company's wholly owned subsidiary, 180 Degree Private Holdings, LLC ("180PH"), which were transferred from the Company to 180PH in the fourth quarter of 2020. The acquisition dates of the securities reflect the dates such securities were obtained by the Company rather than the transfer date.
(8)The Company invested in Nanosys, Inc. in rounds of financing that occurred in 2003, 2004 and 2005. In May 2021, Nanosys completed a restructuring of its capitalization table that resulted in shares of Series C and Series D Preferred Stock being converted into shares of Series A-2 Preferred Stock and Series E Preferred Stock being converted into shares of Series A-1 Preferred Stock. The date of acquisition listed reflects the date of this conversion rather than the date of our investment in the company.
(9)The Company received shares of Ravenna Pharmaceuticals, Inc., as part of the consideration of the acquisition of Petra Pharma Corporation.
(10)Represents a non-operating entity that exists to collect future payments from licenses or other engagements, monetize assets for future distributions to investors and debt holders, or is in the process of shutting down and distributing remaining assets according to a liquidation waterfall.
(11)ORIG3N, Inc., changed its name to Seaport Diagnostics, Inc. in April 2021.
(12)The Company received shares of Zymergen, Inc., as consideration from its acquisition of Lodo Therapeutics Corporation.
The accompanying notes are an integral part of this unaudited consolidated schedule of investments.
25
180 DEGREE CAPITAL CORP.
NOTES TO CONSOLIDATED SCHEDULE OF INVESTMENTS AS OF JUNE 30, 2021
(UNAUDITED)
(13)The identities of these securities have been concealed to protect the Company while it completes a purchase or selling program for these securities.
(14)Historically, Accelerator IV-New York Corporation ("Accelerator") was valued under the equity method of accounting. In May 2020, the Company received distributions of its pro rata share of the distribution Accelerator received from the acquisition of Petra Pharma Corporation ("Petra"). The Company could receive further distributions of $6,252,754 in potential future milestone payments from the acquisition through its ownership in Accelerator. There can be no assurance as to how much of these amounts the Company will ultimately realize or when they will be realized, if at all. As a result of this transaction, Accelerator is fair valued by the Company's Board of Directors, under the income approach. Additionally, Accelerator plans to distribute its remaining assets to its investors, including the Company, and dissolve the entity. The Company will receive the rights to the future payments from the sale of Petra, shares of Ravenna Pharmaceuticals, warrants for the purchase of shares of Magnolia Neurosciences Corporation and our pro rata share of any remaining cash.
(15)On August 4, 2015, SiOnyx, Inc., reorganized its corporate structure to become a subsidiary of a new company, Black Silicon Holdings, Inc. Our security holdings of SiOnyx, Inc. were converted into securities of Black Silicon Holdings, Inc. SiOnyx, Inc. was then acquired by an undisclosed buyer. Black Silicon Holdings, Inc. owns a profit interest in the undisclosed buyer.
(16)The Company is the Investment Manager of a separately managed account ("SMA") that owns shares of these portfolio companies. Under our investment management agreement for this SMA, the Company has the right to control the votes of the securities held by the SMA. The Company has voting ownership between 5 percent and 25 percent in these companies when the shares held by us and our SMA are aggregated.
(17)The Company's shares of Series H Preferred Stock of TheMaven, Inc. ("MVEN") are convertible into 4,000,920 shares of common stock at the discretion of the Company, subject to its as-converted ownership not exceeding 9.99 percent of the outstanding voting securities of MVEN.
(18)Other financial instruments are holdings of the Company that do not meet the definition of a security or a derivative.
(19)If all the remaining milestones are met, the Company would receive $4,141,910. There can be no assurance as to how much of these amounts the Company will ultimately realize or when they will be realized, if at all.
(20)If all the remaining milestones are met, the Company would receive $80,603,393. There can be no assurance as to how much of these amounts the Company will ultimately realize or when they will be realized, if at all.
The accompanying notes are an integral part of this unaudited consolidated schedule of investments.
26
180 DEGREE CAPITAL CORP.
NOTES TO CONSOLIDATED FINANCIAL STATEMENTS
(UNAUDITED)
NOTE 1. THE COMPANY
180 Degree Capital Corp. (f/k/a Harris & Harris Group, Inc.) (the "Company," "us," "our" and "we"), withdrew its election to be treated as a business development company on March 30, 2017, and subsequently returned to its prior status as a registered non-diversified closed-end management investment company ("Closed-End Fund" or "CEF") under the Investment Company Act of 1940 (the "1940 Act"). We operate as an internally managed investment company whereby our officers and employees, under the general supervision of our Board of Directors, conduct our operations. As of May 22, 2020, we are also registered with the Securities and Exchange Commission as a Registered Investment Adviser under the Investment Advisers Act of 1940 (the "Advisers Act").
H&H Ventures Management, Inc.SM ("Ventures") is a 100 percent owned subsidiary of the Company. Ventures is taxed under Subchapter C (a "C Corporation") of the Internal Revenue Code of 1986 (the "Code"). Harris Partners I, L.P, is a limited partnership and, from time to time, may be used to hold certain interests in our portfolio companies. The partners of Harris Partners I, L.P., are Ventures (sole general partner) and the Company (sole limited partner). Ventures pays taxes on income generated by its operations as well as on any non-passive investment income generated by Harris Partners I, L.P. For the period ended June 30, 2021, there was no non-passive investment income generated by Harris Partners I, L.P. Ventures, as the sole general partner, consolidates Harris Partners I, L.P. The Company consolidates Ventures for financial reporting purposes.
180 Degree Private Holdings, LLC ("180PH"), is a wholly owned limited liability corporation that was created in October 2020 to hold certain of the Company's securities of privately held companies. 180PH is consolidated for financial reporting purposes and is a disregarded entity for tax purposes under the Code.
The Company is the Managing Member of 180 Degree Capital Management, LLC ("180CM"), a limited liability company formed to facilitate the opportunity for interested investors to co-invest alongside the Company in individual publicly traded portfolio companies. As of June 30, 2021, the Company has no capital under management in 180.2 SPV Series ("180.2 SPV"), a series of 180CM, as 180.2 SPV was liquidated during the period.
The Company is the General Partner of 180 Phoenix Fund, L.P. ("180 Phoenix"), a limited partnership formed to facilitate management of a fund that was formed to co-invest alongside the Company in its publicly traded companies on an on-going basis. As of June 30, 2021, 180 Phoenix did not have any capital under management.
The Company is also the Managing Member of H&H Co-Investment Partners, LLC, a limited liability company formed to facilitate the opportunity for interested investors to co-invest alongside the Company in its private portfolio companies. As of June 30, 2021, H&H Co-Investment Partners did not have any capital under management.
As of June 30, 2021, the Company has approximately $42.4 million in a separately managed account ("SMA").
The Company may, in certain cases, receive management fees and carried interest on profits generated on invested capital from any capital under management if and when capital is raised and if and when profits are realized, respectively. The Company does not consolidate the operations of any capital managed in separate series of 180CM, or in the separately managed account and it does not expect to consolidate the operations of any capital managed in separate series of H&H Co-Investment Partners or 180 Phoenix if and when either entity has capital under management.
180 Degree Capital BD, LLC ("180BD") is a 100 percent owned subsidiary of the Company. 180BD was formed to provide services to the Company related to fundraising for co-investment funds and not for investment returns. 180BD is a registered broker-dealer with the Financial Industry Regulatory Authority ("FINRA"). The Company consolidates 180BD for financial reporting purposes. 180BD is currently a disregarded entity for tax purposes under the Code.
Following receipt of approval from shareholders at an annual meeting of shareholders held on May 14, 2020, the Company filed an amendment to its Amended and Restated Certificate of Incorporation on December 31, 2020, to affect a reverse stock split of its issued and outstanding shares of common stock, at a ratio of one share for three shares. All share amounts, per share data and operating performance have been adjusted to reflect the reverse stock split.
NOTE 2. SUMMARY OF SIGNIFICANT ACCOUNTING POLICIES
The following is a summary of significant accounting policies followed in the preparation of the consolidated financial statements:
Principles of Consolidation. The consolidated financial statements have been prepared in accordance with accounting principles generally accepted in the US ("GAAP") and Articles 6 and 12 of Regulation S-X of the SEC and include the accounts of the Company and its wholly owned subsidiaries. The Company is an investment company following accounting and reporting guidance in Accounting Standards Codification 946. In accordance with GAAP and Regulation S-X under 17 C.F.R. Part 210, the Company may only consolidate its interests in investment company subsidiaries and controlled operating companies whose business consists of providing services to the Company. Our wholly owned subsidiaries, Ventures and 180BD, are controlled operating companies that provide services to us and are, therefore, consolidated. All significant intercompany accounts and transactions have been eliminated in the consolidation.
Use of Estimates. The preparation of the consolidated financial statements in conformity with GAAP requires management to make estimates and assumptions that affect the reported amounts of assets and liabilities and contingent assets and liabilities and the reported amounts of revenues and expenses. Actual results could differ from these estimates, and the differences could be material. The most significant estimates relate to the fair valuations of our investments.
Portfolio Investment Valuations. Investments are stated at "value" as defined in the 1940 Act and in the applicable regulations of the SEC and in accordance with GAAP. Value, as defined in Section 2(a)(41) of the 1940 Act, is (i) the market price for those securities for which a market quotation is readily available and (ii) the fair value as determined in good faith by, or under the direction of, the Board of Directors for all other assets. The Valuation Committee, comprised of all of the independent Board members, is responsible for determining the valuation of the Company’s assets within the guidelines established by the Board of Directors. The Valuation Committee receives information and recommendations from management. An independent valuation firm also reviews select portfolio company valuations. The independent valuation firm does not provide independent valuations. The fair values assigned to these investments are based on available information and do not necessarily represent amounts that might ultimately be realized when that investment is sold, as such amounts depend on future circumstances and cannot reasonably be determined until the individual investments are actually liquidated or become readily marketable. The Valuation Committee values the Company's investment assets as of the end of each calendar quarter and as of any other time requested by the Board of Directors.
Accounting Standards Codification Topic 820, "Fair Value Measurements," ("ASC 820") defines fair value as the price that would be received to sell an asset or paid to transfer a liability in an orderly transaction between market participants at the measurement date (exit price). It applies fair value terminology to all valuations whereas the 1940 Act applies market value terminology to readily marketable assets and fair value terminology to other assets.
The main approaches to measuring fair value utilized are the market approach, the income approach and the hybrid approach.
•Market Approach (M): The market approach focuses on inputs and not techniques. The market approach may use quantitative inputs such as prices and other relevant information generated by market transactions involving identical or comparable assets or liabilities and the values of market multiples derived from a set of comparable companies. The market approach may also use qualitative inputs such as progress toward milestones, the long-term potential of the business, current and future financing requirements and the rights and preferences of certain securities versus those of other securities. The selection of the relevant inputs used to derive value under the market approach requires judgment considering factors specific to the significance and relevance of each input to deriving value.
•Income Approach (I): The income approach focuses on techniques and not inputs. The income approach uses valuation techniques to convert future amounts (for example, revenue, cash flows or earnings) to a single present value amount (discounted). The measurement is based on the value indicated by current market expectations about those future amounts. Those valuation techniques include present value techniques; option-pricing models, such as the Black-Scholes-Merton formula (a closed-form model) and a binomial model (a lattice model), which incorporate present value techniques; and the multi-period excess earnings method, which is used to measure the fair value of certain assets.
•Hybrid Approach (H): The hybrid approach uses elements of both the market approach and the income approach. The hybrid approach calculates values using the market and income approach, individually. The resulting values are then distributed among the share classes based on probability of exit outcomes.
ASC Topic 820 classifies the inputs used to measure fair value by these approaches into the following hierarchy:
•Level 1 (L1): Unadjusted quoted prices in active markets for identical assets or liabilities;
•Level 2 (L2): Inputs other than quoted prices included within Level 1 that are observable for the asset or liability, either directly or indirectly. These include quoted prices in active markets for similar assets or liabilities, or quoted prices for identical or similar assets or liabilities in markets that are not active, or inputs other than quoted prices that are observable for the asset or liability, either directly or indirectly, for substantially the full term of the financial instrument. Level 2 inputs are in those markets for which there are few transactions, the prices are not current, little public information exists or instances where prices vary substantially over time or among brokered market makers; and
•Level 3 (L3): Inputs to the valuation methodology are unobservable and significant to the fair value measurement. Unobservable inputs are those inputs that reflect our own assumptions that market participants would use to price the asset or liability based upon the best available information.
Financial assets and liabilities are classified in their entirety based on the lowest level of input that is significant to the fair value measurement and are not necessarily an indication of risks associated with the investment.
As of June 30, 2021, our financial statements include investments fair valued by the Board of Directors of $46,815,815. The fair values were determined in good faith by, or under the direction of, the Board of Directors. The fair value amount includes the values of our investments in privately held companies and rights to future milestone payments, as well as our preferred stock and common stock of TheMaven, Inc., our warrants of OpGen, Inc. and Potbelly Corporation, and our shares of common stock of Zymergen, Inc., which are securities of publicly traded companies.
Cash. Cash includes demand deposits. Cash is carried at cost, which approximates fair value.
Restricted Cash. The Restricted cash, net of any future costs related to the expired sublease, was remitted to the sub-lease tenant during the period.
Unaffiliated Rights to Payments. At June 30, 2021, the outstanding potential milestone payments from Amgen, Inc.’s acquisition of BioVex Group, Inc., were valued at $407,668. At June 30, 2021, the outstanding potential milestone payments from the acquisition of Petra Pharma Corporation by an undisclosed acquirer unrelated to the Company were valued at $5,934,205. The milestone payments are valued using the probability-adjusted, present value of proceeds from future payments that would be due upon successful completion of certain regulatory and sales milestones. There can be no assurance as to how much of these amounts we will ultimately realize or when they will be realized, if at all.
Prepaid Expenses. We include prepaid insurance premiums and deferred financing charges in "Prepaid expenses." Prepaid insurance premiums are recognized over the term of the insurance contract and are included in "Insurance" in the Company's Consolidated Statement of Operations.
Property and Equipment. Property and equipment are included in "Other assets" and are carried at $18,955 at June 30, 2021, representing cost of $216,173, less accumulated depreciation of $197,218. Depreciation is provided using the straight-line method over the estimated useful lives of the property and equipment. We estimate the useful lives to be five to ten years for furniture and fixtures, and three years for computer equipment.
Post-Retirement Plan Liabilities. Until it was terminated on April 27, 2017, the Company provided a Retiree Medical Benefit Plan for employees who met certain eligibility requirements. Until it was terminated on May 5, 2011, the Company also provided an Executive Mandatory Retirement Benefit Plan for certain individuals employed by us in a bona fide executive or high policy-making position. The net periodic post-retirement benefit cost includes service cost and interest on the accumulated post-retirement benefit obligation. Unrecognized actuarial gains and losses are recognized as net periodic benefit cost, pursuant to the Company's historical accounting policy in "Salaries, bonus and benefits" in the Company's Consolidated Statement of Operations. The impact of plan amendments was amortized over the employee's average service period as a reduction of net periodic benefit cost. Unamortized prior service cost was fully amortized during 2017 as a result of the termination of the Retiree Medical Benefit Plan.
Interest Income Recognition. Interest income, including amortization of premium and accretion of discount, is recorded on an accrual basis. When accrued interest is determined not to be recoverable, the Company ceases accruing interest and writes off any previously accrued interest. Write-offs are netted in interest income. During the period ended June 30, 2021, the Company recorded on a net basis, $300,430 of bridge note payment-in-kind ("PIK") interest. Securities are deemed to be non-income producing if investments have not paid dividends or interest within the last 12 months or are on non-accrual status for at least 12 consecutive months.
When the fair value of a security that includes PIK interest is less than the accrued interest, the Company may place the security on non-accrued status. Starting April 1, 2018 and through March 31, 2021, Black Silicon Holdings, Inc. was on non-accrued status. As of April 1, 2021, the debt security was considered to be income producing and interest income was accrued during the period starting from April 1, 2021. Total interest income accrued during the period ended June 30, 2021 was $337,228 and included in "Non-controlled affiliated companies-PIK" in the Company's Consolidated Statement of Operations.
Board Fees From Portfolio Companies. During the period ended June 30, 2021, the Company earned $31,449 in non-cash income, owing to certain of its employees serving as members of the board of directors of Synacor, Inc. The Company recognizes revenues from fee income from board fees as those services are provided.
Management Fee and Performance Fee/Carried Interest from Managed Funds. As a Registered Investment Adviser under the Advisers Act, the Company may be entitled to receive management fee and performance fee from clients including separately managed accounts (SMAs) and special purpose vehicles (SPVs). The Company does not currently collect management fee on our SMA. The Company accrues management fee on our SPVs, that are to be paid upon liquidation of the entity regardless of performance. The management fee from 180.2 SPV was paid during the period following the liquidation of the entity. Performance fee or carried interest, if any, is paid annually by our SMA based on a fixed percentage of the increase in net assets during the year. Performance fee on SPVs, if any, are paid based on the amount of increase in net assets at the time of any distribution of capital above the amount of initial invested capital plus accrued expenses. The timing and payment terms of management fee and performance fee for future client accounts may be different than those of our current SMA and SPV.
Expenses that are the responsibility of client accounts are generally paid for by the Company and then reimbursed at a future date by the client accounts. Our SMA generally pays any reimbursable expenses within 30 days of invoice. 180 SPV paid the accrued amount of expenses at the time of liquidation in April 2021. As of June 30, 2021, $152,151 of expenses reimbursable to us by 180 Phoenix for formation expenses is included in “Receivable from managed funds” in our Consolidated Statement of Assets and Liabilities. If we are unable to raise funds for 180 Phoenix, or if the terms under which we raise capital do not include reimbursement for formation costs, we may not be able to collect on this receivable.
The inception to date collected management fee income from 180.2 SPV for the period ended June 30, 2021, was $77,312. Management fee income for the period ended June 30, 2021, for 180.2 SPV was $6,083. Management fee income from 180.2 SPV for the period ended June 30, 2021, is recorded in "Management fee income" in the Company's Consolidated Statement of Operations.
The Company does not include accruals for carried interest in the consolidated financial statements until such carried interest is received and/or the Company concludes that it is probable that a reversal of any accrual will not occur. There is no carried interest accrued during the period ended June 30, 2021.
Other Income. The Company may purchase restricted securities issued by publicly traded companies that include provisions that provide for payment of partial liquidated damages in the event the issuer does not meet obligations specified in the purchase agreement or other ancillary documents associated with the transaction. These obligations most commonly are associated with the filing of registration statements and/or being up to date with the filing of the issuer's financial statements with the SEC. As of June 30, 2021, the Company is due $838,160 in partial liquidated damages from TheMaven, Inc., one of its publicly traded portfolio companies, as a result of the delay in filing of registration statements related to the Company's securities of TheMaven, Inc., and from the delay in it filing of up-to-date financial information with the SEC. The amount for partial liquidated damages accrued in 2021 is recorded in "Other income" in the Company's Consolidated Statement of Operations and is included in "Receivable from portfolio companies" in the Company's Consolidated Statement of Assets and Liabilities.
Put and Call Options. The Company may purchase options on publicly traded securities as an investment and/or with the intention of limiting its downside risk. When the Company purchases an option, an amount equal to the premium paid is recorded in the Consolidated Statements of Assets and Liabilities as an investment. The Company may also purchase an option at one price and write/sell an option at another price in a simultaneous transaction referred to as a spread. The amount of these assets is subsequently marked-to-market to reflect the current value of the options. In the event that the options are exercised, the Company would be required to deliver those shares to the counterparty. When the options expire unexercised, the Company realizes a loss on the premium paid, or the difference between the premium paid and the premium received, as applicable.
Rent Expense. The Company currently leases and runs daily operations in approximately 1,250 square feet of office space in Montclair, New Jersey, on a month-to-month basis. The base rent is approximately $26 per square foot. Either the Company or the landlord may terminate the lease at any time with two months' written notice to either party.
Miscellaneous Income. Our lease at 1450 Broadway, New York, New York, commenced on January 21, 2010. The lease expired on December 31, 2019. Under the terms of the lease, the Company provided a security deposit of $62,100 to the landlord that was to be returned to the Company, less any unpaid expenses, upon the expiration of the lease. During 2020, the Company wrote off this security deposit as not collectable. During the period ended June 30, 2021, the Company collected $57,587 from the landlord and was recorded as "Miscellaneous income."
Realized Gain or Loss and Unrealized Appreciation or Depreciation of Portfolio Investments. Realized gain or loss is recognized when an investment is disposed of and is computed as the difference between the Company's cost basis in the investment at the disposition date and the net proceeds received from such disposition. Realized gain or loss on investment transactions are determined by specific identification. Unrealized appreciation or depreciation is computed as the difference between the fair value of the investment and the cost basis of such investment.
Income Taxes. As we currently intend to qualify as a Regulated Investment Company ("RIC") under Subchapter M of the Code in future years and distribute any ordinary income, the Company does not accrue for income taxes. The Company has capital loss carryforwards that can be used to offset net realized capital gains. The Company also has operating loss carryforwards that can be used to offset operating income and net realized capital gains in years when we fail to qualify as a RIC. The Company recognizes interest and penalties in income tax expense. We pay federal, state and local income taxes on behalf of our wholly owned subsidiary, Ventures, which is a C Corporation. See Note 9. Income Taxes for further discussion.
Foreign Currency Translation. The accounting records of the Company are maintained in U.S. dollars. All assets and liabilities denominated in foreign currencies are translated into U.S. dollars based on the rate of exchange of such currencies against U.S. dollars on the date of valuation. If Company has assets denominated in foreign currencies, it does not isolate the portion of the results of operations that arises from changes in foreign currency rates on investments held on its Consolidated Statement of Operations.
Securities Transactions. Securities transactions are accounted for on the date the transaction for the purchase or sale of the securities is entered into by the Company (i.e., trade date). Securities transactions outside conventional channels, such as private transactions, are recorded as of the date the Company obtains the right to demand the securities purchased or to collect the proceeds from a sale and incurs the obligation to pay for the securities purchased or to deliver the securities sold.
Concentration of Credit Risk. The Company places its cash with financial institutions and, at times, cash held in depository accounts may exceed the Federal Deposit Insurance Corporation's insured limit and is subject to the credit risk of such institutions to the extent it exceeds such limit.
NOTE 3. BUSINESS RISKS AND UNCERTAINTIES
Our business activities contain elements of risk. We consider the principal types of market risk to be valuation risk, diversification risk, interest rate risk and foreign currency risk. Although we are risk-seeking rather than risk-averse in our investments, we consider the management of risk to be essential to our business.
Valuation Risk
Value, as defined in Section 2(a)(41) of the 1940 Act, is (i) the market price for those securities for which market quotations are readily available and (ii) fair value as determined in good faith by, or under the direction of, the Board of Directors for all other assets. See Note 2. Summary of Significant Accounting Policies for further discussion. In December 2020, the SEC adopted a new rule, Rule 2a-5 under the 1940 Act, governing fund valuation practices. The new rule establishes certain requirements for determining fair value in good faith, and defines when market quotations are considered to be "readily available" for purposes of the 1940 Act. We continue to monitor and assess the impact that this provision may have on the Company's consolidated financial statements.
We have historically invested primarily in privately held companies, the securities of which are inherently illiquid. We are currently focused on investing in what we believe are deeply undervalued microcapitalization publicly traded companies. Our publicly traded securities account for approximately 67.1 percent of the value of our portfolio of investments. Although these companies are publicly traded, their stock may not trade at high volumes and/or we may own a significant portion of a company's outstanding stock, which may restrict our ability to sell our positions in an orderly fashion and prices at which sales can be made may be volatile and materially different than the closing prices of such positions at each financial statement date. We may also be subject to restrictions on transfer and/or other lock-up provisions after these companies complete public offerings and/or if we invest in unregistered securities of public companies. Many of our privately held and publicly traded companies tend to not have attained profitability, and many of these companies also lack management depth and have limited or no history of operations. Because of the speculative nature of our investments and the lack of a liquid market for and restrictions on transfers of privately held investments, there is greater risk of loss relative to traditional marketable investment securities.
Approximately 44.5 percent of our portfolio was fair valued and comprised of securities of privately held companies and rights to potential future milestone payments, as well as our preferred stock and common stock of TheMaven, Inc. (a Level 3 investment), our warrants of OpGen, Inc. and Potbelly Corporation (Level 3 investments), and Zymergen, Inc. (a Level 3 investment) which are publicly traded companies. Because there is typically no public or readily ascertainable market for our interests in the small privately held companies in which we invest, the valuation of the securities in that portion of our portfolio is determined in good faith by our Valuation Committee, which is comprised of all of the independent members of our Board of Directors. The values are determined in accordance with our Valuation Procedures and are subject to significant estimates and judgments. The fair value of the securities in our portfolio may differ significantly from the values that would be placed on these securities if a ready market for the securities existed. Additionally, inputs may become available after a financial statement date that could result in a material change in value at a future financial statement date from the value reported in the current financial statements. Any changes in valuation are recorded in the Company's Consolidated Statement of Operations as "Change in unrealized appreciation (depreciation) on investments." Changes in valuation of any of our investments in privately held companies from one period to another may be significant.
Diversification Risk
While we are subject to certain diversification requirements regarding the concentration of investments in any one industry or group of industries, we do not choose investments based on a strategy of diversification. We also do not rebalance the portfolio should one of our portfolio companies increase in value substantially relative to the rest of the portfolio. Therefore, the value of our portfolio may be more vulnerable to microeconomic events affecting a single sector, industry or portfolio company and to general macroeconomic events that may be unrelated to our portfolio companies. These factors may subject the value of our portfolio to greater volatility than a company that follows a diversification strategy. As of June 30, 2021 our largest 10 investments by value accounted for approximately 70 percent of the value of our investment portfolio. Our largest three investments, by value, AgBiome, LLC, Synchronoss Technologies, Inc., and TheMaven, Inc., accounted for approximately 12 percent, 11 percent and 11 percent, respectively, of our investment portfolio at June 30, 2021. AgBiome, LLC, is a privately held portfolio company and Synchronoss Technologies, Inc. and TheMaven, Inc. are publicly traded companies.
Interest Rate Risk
Interest rate sensitivity refers to the change in earnings that may result from changes in the level of interest rates. We may invest in both short- and long-term U.S. government and agency securities. To the extent that we invest in short- and long-term U.S. government and agency securities, changes in interest rates result in changes in the value of these obligations that result in an increase or decrease of our net asset value. The level of interest rate risk exposure at any given point in time depends on the market environment, the expectations of future price and market movements, and the quantity and duration of long-term U.S. government and agency securities held by the Company, and it will vary from period to period.
In addition, market interest rates for high-yield corporate debt may be an input in determining value of our investments in debt securities of privately held and publicly traded companies. Significant changes in these market rates could affect the value of our debt securities as of the valuation date of measurement of value. While we do not currently have any investments in debt securities with floating interest rates, investment income in such securities should we acquire them in the future could be adversely affected by changes in interest rates, including any that might result from the anticipated transition away from the London Interbank Offered Rate ("LIBOR"). In March 2021, LIBOR's administrator announced that most LIBOR settings will no longer be published after the end of 2021, and that a majority of U.S. dollar LIBOR settings will no longer be published after June 30, 2023. To the extent we acquire investments with floating interest rates tied to LIBOR, this transition could result in losses for the Company.
Foreign Currency Risk
Our investments are not subject to foreign currency risk as they are all denominated in U.S. dollars. We have one investment in a company based in Canada, D-Wave Systems, Inc., however the price per share and terms of those shares are denominated in U.S. dollars.
Coronavirus (COVID-19) Pandemic
In March 2020, the World Health Organization declared COVID-19 (a novel coronavirus) to be a pandemic. The situation is dynamic. Global financial markets have experienced and may continue to experience significant volatility resulting from the spread of COVID-19. The outbreak of COVID-19 has resulted in travel and border restrictions, quarantines, supply chain disruptions, lower consumer demand and general market uncertainty. The global economy, the economies of certain nations and individual issuers have been and may continue to be adversely affected by COVID-19, particularly in light of the interconnectivity between economies and financial markets, all of which may negatively impact the Company's performance. In addition, COVID-19 and governmental responses to COVID-19 may negatively impact the capabilities of the Company's service providers and disrupt the Company's operations.
Beginning in the first quarter of 2021, there has been a trend in many parts of the world of increasing availability and administration of vaccines against COVID-19, as well as an easing of restrictions on social, business, travel and government activities and functions. On the other hand, infection rates and regulations continue to fluctuate in various regions and there are ongoing global impacts resulting from the pandemic, including challenges and increases in costs for logistics and supply chains, such as increased port congestion, intermittent supplier delays and a shortfall of microchip supply. Management of the Company will continue to monitor the impact of COVID-19 on its business.
NOTE 4. FAIR VALUE OF INVESTMENTS
At June 30, 2021, our financial assets valued at fair value were categorized as follows in the fair value hierarchy:
| | | | | | | | | | | | | | | | | | | | | | | | | | |
| | | Fair Value Measurement at Reporting Date Using: |
Description | | Unadjusted Quoted Prices in Active Markets for Identical Assets (Level 1) | |
Significant Other Observable Inputs (Level 2) | |
Significant Unobservable Inputs (Level 3) | | June 30, 2021 |
| Privately Held Securities: | | | | | | | | |
| Preferred Stock | | $ | 0 | | | $ | 0 | | | $ | 25,752,350 | | | $ | 25,752,350 | |
| Bridge Notes | | 0 | | | 0 | | | 1,059,821 | | | 1,059,821 | |
| Common Stock | | 0 | | | 0 | | | 1,299,199 | | | 1,299,199 | |
| Warrants | | 0 | | | 0 | | | 0 | | | 0 | |
| LLC Interests | | 0 | | | 0 | | | 225,000 | | | 225,000 | |
| | | | | | | | |
| Publicly Traded Securities: | | | | | | | | |
| Preferred Stock | | $ | 0 | | | $ | 0 | | | $ | 2,943,589 | | | $ | 2,943,589 | |
| Common Stock | | 58,275,546 | | | 0 | | | 8,838,142 | | | 67,113,688 | |
| Warrants | | 0 | | | 0 | | | 355,841 | | | 355,841 | |
| Total Investments: | | $ | 58,275,546 | | | $ | 0 | | | $ | 40,473,942 | | | $ | 98,749,488 | |
| | | | | | | | |
| Other Financial Instruments: | | | | | | | | |
| Rights to Payments | | $ | 0 | | | $ | 0 | | | $ | 6,341,873 | | | $ | 6,341,873 | |
| Total Financial Assets: | | $ | 58,275,546 | | | $ | 0 | | | $ | 46,815,815 | | | $ | 105,091,361 | |
Significant Unobservable Inputs
The table below presents the valuation technique and quantitative information about the significant unobservable inputs utilized by the Company in the fair value measurements of Level 3 assets. Unobservable inputs are those inputs for which little or no market data exists and, therefore, require an entity to develop its own assumptions.
| | | | | | | | | | | | | | | | | | | | | | | |
| Value as of June 30, 2021 | | Valuation Approach(es) | | Unobservable Input(s) | | Range(s) (Weighted Average(a)) |
| | | | | | | |
| | | | | Public Comparable Adjustment (Including Non-Performance Risk) | | 0.0% - 6.3% (0.6%) |
| | | | | Price Per Share | | $0.85 - $5.93 ($4.40) |
| | | | | Volatility | | 47.7% - 84.3% (75.7%) |
| Preferred Stock | $ | 18,138,590 | | | Hybrid Approach | | Time to Exit / Cash Flows (Years) | | 2.0 - 5.0 (4.6) |
| | | | | Probability of Achieving Independent Milestones | | 0.0% - 75.0% (50.0%) |
| | | | | Price Per Share | | $0.21 - $1.00 ($0.42) |
| | | | | Public Comparable Adjustment (Including Non-Performance Risk) | | -100.0% - 0.0% (-33.6%) |
| | | | | Volatility | | 81.4% - 106.1% (89.1%) |
| Preferred Stock | 7,239,071 | | | Income Approach | | Time to Exit / Cash Flows (Years) | | 5.0 - 5.3 (5.0) |
| | | | | | | |
| | | | | | | |
| | | | | Time to Exit/Lapse of Restrictions (Years) | | 0.1 (0.1) |
| | | | | Discount for Lack of Marketability | | 2.2% (2.2%) |
| Preferred Stock | 3,318,278 | | | Market Approach | | Price Per Share | | $0.00 - $0.68 ($0.68) |
| Bridge Notes | 2,225 | | | Income Approach | | Estimated Value to Cost Ratio at Payout | | 0.00 - 0.04 (0.04) |
| | | | | | | |
| | | | | | | |
| | | | | | | |
| Bridge Notes | 1,057,596 | | | Market Approach | | Estimated Value to Cost Ratio at Payout | | 0.57 - 1.00 (1.57) |
| | | | | Probability of Achieving Independent Milestones | | 3.4%-75.0% (46.7%) |
| | | | | Probability of Achieving Dependent Milestones | | 0.0%-14.1% (1.6%) |
| | | | | Public Comparable Adjustment (Including Non-Performance Risk) | | -50.0% - 0.0% (0.0%) |
| | | | | Volatility | | 81.4% - 106.1% (93.7%) |
| | | | | Time to Exit (Years) | | 5.0 - 14.3 (9.5) |
| Common Stock | 1,217,053 | | | Income Approach | | Price Per Share | | $0.00 - $0.72 ($0.58) |
| | | | | Time to Exit/Lapse of Restrictions (Years) | | 0.1 - 0.4 (0.1) |
| | | | | Discount for Lack of Marketability | | 0.0% - 2.2% (2.2%) |
| Common Stock | 8,920,288 | | | Market Approach | | Price Per Share | | $0.01 - $0.02 ($0.02) |
| | | | | Price Per Share | | $0.00 - $2.27 ($2.27) |
| | | | | Volatility | | 55.2% - 122.9% (55.2%) |
| Warrants | 355,841 | | | Income Approach | | Time to Exit (Years) | | 3.6 - 4.6 (4.6) |
| LLC Interests | 225,000 | | | Market Approach | | Bid/Ask | | $150,000-$300,000 ($225,000) |
| | | | | Probability of Achieving Independent Milestones | | 0.0% - 75.0% (45.3%) |
| | | | | Probability of Achieving Dependent Milestones | | 0.0% - 14.1% (2.1%) |
| Rights to Payments | 6,341,873 | | | Income Approach | | Time to Cash Flows (Years) | | 0.8 - 21.5 (13.9) |
| Total | $ | 46,815,815 | | | | | | | |
(a) Weighted average based on fair value at June 30, 2021.
Valuation Methodologies and Inputs for Level 3 Assets
The following sections describe the valuation techniques and significant unobservable inputs used to measure Level 3 assets.
Preferred Stock, Preferred Units, LLC Interests, Bridge and Promissory Notes and Common Stock
Preferred stock, preferred units, LLC interests, bridge promissory notes and common stock are valued by either a market, income or hybrid approach using internal models with inputs, most of which are not market observable. Common inputs for valuing Level 3 investments include prices from recently executed private transactions in a company’s securities or unconditional firm offers, revenue multiples of comparable publicly traded companies, merger and acquisition ("M&A") transactions consummated by comparable companies, discounts for lack of marketability, rights and preferences of the class of securities we own as compared with other classes of securities the portfolio company has issued, particularly related to potential liquidity scenarios of an initial public offering ("IPO") or an acquisition transaction, estimated time to exit, volatilities of comparable publicly traded companies and management’s best estimate of risk attributable to non-performance risk. Certain securities are valued using the present value of future cash flows.
We may also consider changes in market values for sets of comparable companies when recent private transaction information is not available and/or in consideration of non-performance risk. We define non-performance risk as the risk that the price per share (or implied valuation of a portfolio company) or the effective yield of a debt security of a portfolio company, as applicable, does not appropriately represent the risk that a portfolio company with negative cash flow will be: (a) unable to raise capital, will need to be shut down and will not return our invested capital; or (b) able to raise capital, but at a valuation significantly lower than the implied post-money valuation of the last round of financing. We assess non-performance risk for each private portfolio company quarterly. Our assessment of non-performance risk typically includes an evaluation of the financial condition and operating results of the company, the company's progress towards milestones, and the long-term potential of the business and technology of the company and how this potential may or may not affect the value of the shares owned by us. An increase to the non-performance risk or a decrease in the private offering price of a future round of financing from that of the most recent round would result in a lower fair value measurement and/or a change in the distribution of value among the classes of securities we own.
Option pricing models place a high weighting on liquidation preferences, which means that small differences in how the preferences are structured can have a material effect on the fair value of our securities at the time of valuation and also on future valuations should additional rounds of financing occur with senior preferences. As such, valuations calculated by option pricing models may not increase if 1) rounds of financing occur at higher prices per share, 2) liquidation preferences include multiples on investment, 3) the amount of invested capital is small and/or 4) liquidation preferences are senior to prior rounds of financing. Additionally, an increase in the volatility assumption generally increases the enterprise value calculated in an option pricing model. An increase in the time to exit assumption also generally increases the enterprise value calculated in an option pricing model. Variations in the expected time to exit or expected volatility assumptions have a significant impact on fair value.
Bridge notes commonly contain terms that provide for the conversion of the full amount of principal, and sometimes interest, into shares of preferred stock at a defined price per share and/or the price per share of the next round of financing. The use of a discount for non-performance risk in the valuation of bridge notes would indicate the potential for conversion of only a portion of the principal, plus interest when applicable, into shares of preferred stock or the potential that a conversion event will not occur and that the likely outcome of a liquidation of assets would result in payment of less than the remaining principal outstanding of the note. An increase in non-performance risk would result in a lower fair value measurement.
Warrants and Stock Options
We use the Black-Scholes-Merton option-pricing model to determine the fair value of warrants and stock options held in our portfolio unless there is a publicly traded active market for such warrants and options or another indication of value such as a sale of the portfolio company. Option pricing models, including the Black-Scholes-Merton model, require the use of subjective input assumptions, including expected volatility, expected life, expected dividend rate, and expected risk-free rate of return. In the Black-Scholes-Merton model, variations in the expected volatility or expected term assumptions have a significant impact on fair value. Because certain securities underlying the warrants in our portfolio are not publicly traded, many of the required input assumptions are more difficult to estimate than they would be if a public market for the underlying securities existed.
An input to the Black-Scholes-Merton option-pricing model is the value per share of the type of stock for which the warrant is exercisable as of the date of valuation. This input is derived according to the methodologies discussed in "Preferred Stock, Preferred Units, LLC Interests, Bridge Notes and Common Stock."
Rights to Payments
Rights to payments are valued using a probability-weighted discounted cash flow model. As part of Amgen Inc.’s acquisition of our former portfolio company, BioVex Group, Inc., we are entitled to potential future milestone payments based upon the achievement of certain regulatory and sales milestones. We are also entitled to future payments from the acquisition of Petra Pharma Corporation by an undisclosed acquirer unrelated to the Company. We assign probabilities to the achievements of the various milestones. Milestones identified as independent milestones can be achieved irrespective of the achievement of other contractual milestones. Dependent milestones are those that can only be achieved after another, or series of other, milestones are achieved. The interest rates used in these models are observable inputs from sources such as the published interest rates for corporate bonds of the acquiring or comparable companies.
Changes in Valuation Approaches
During the period ended June 30, 2021, the following changes in valuation methodology occurred since December 31, 2020:
•We changed the valuation methodology of our securities of AgBiome, LLC, D-Wave Systems, Inc. and Nanosys, Inc., from the income approach to the hybrid approach to reflect financing and business related inputs.
•We changed the valuation methodology of our convertible bridge notes of ABSMaterials, Inc., from the market approach to the income approach to reflect business-related inputs.
The following chart shows the components of change in the financial assets categorized as Level 3 for the period ended June 30, 2021.
| | | | | | | | | | | | | | | | | | | | | | | | | | | | | | | | | | | | | | | | | | | | | | | |
| | Beginning
Balance
1/1/2021 | | Total
Realized
Gains (Loss)
Included in
Changes in
Net Assets | | Transfers | | Total
Unrealized
(Depreciation) Appreciation
Included in
Changes in
Net Assets | | Investments in
Portfolio
Companies,
Interest on
Bridge Notes,
and
Amortization
of Loan
Fees, Net | | Disposals
and
Settlements | | Ending
Balance
6/30/2021 | | Amount of Total
(Depreciation) Appreciation for the
period Included in
Changes in Net
Assets Attributable
to the Change in
Unrealized Gains or
Losses Relating to
Assets Still Held at
the Reporting Date |
| | | | | | | | | | | | | | | |
| Preferred Stock | $ | 30,466,688 | | | $ | (658,190) | | 1 | $ | 0 | | | $ | (1,112,559) | | | $ | 0 | | | $ | 0 | | | $ | 28,695,939 | | | $ | (1,112,559) | |
| | | | | | | | | | | | | | | |
| Bridge Notes | 1,107,898 | | | (166,936) | | | 0 | | | 129,044 | | | 350,430 | | | (360,615) | | 3 | 1,059,821 | | | 129,044 | |
| | | | | | | | | | | | | | | |
| Common Stock | 8,029,814 | | | 0 | | 1 | 0 | | | 1,727,512 | | | 380,015 | | 3 | 0 | | | 10,137,341 | | | 1,727,512 | |
| | | | | | | | | | | | | | | |
| Warrants | 3 | | | (69,168) | | 1 | 0 | | | 200,157 | | | 224,849 | | | 0 | | | 355,841 | | | 130,989 | |
| | | | | | | | | | | | | | | |
| LLC Interests | 137,500 | | | 0 | | | 0 | | | 87,500 | | | 0 | | | 0 | | | 225,000 | | | 87,500 | |
| | | | | | | | | | | | | | | |
| Stock Options | 44,127 | | | 0 | | | (44,127) | | 2 | 0 | | | 0 | | | 0 | | | 0 | | | 0 | |
| | | | | | | | | | | | | | | |
| Rights to Payments | 7,720,674 | | | 0 | | | 0 | | | (1,378,801) | | | 0 | | | 0 | | | 6,341,873 | | | (1,378,801) | |
| | | | | | | | | | | | | | | |
| Funds Held in Escrow from Sales of Investments | 161,779 | | | 163,043 | | 1 | 0 | | | (1,139) | | | 0 | | | (323,683) | | | 0 | | | 0 | |
| | | | | | | | | | | | | | | |
| Total | $ | 47,668,483 | | | $ | (731,251) | | | $ | (44,127) | | | $ | (348,286) | | | $ | 955,294 | | | $ | (684,298) | | | $ | 46,815,815 | | | $ | (416,315) | |
1 Represents gross realized gains or gross realized losses.
2 "Stock Options" of Synacor, Inc. were exercised for "Common Stock". Those shares of Common Stock were included in a tender offer dated April 1, 2021.
3 The Company received shares of Common Stock of Zymergen, Inc. as consideration from the acquisition of Lodo Therapeutics Corporation.
We elected to use beginning of the year values to recognize transfers in and out of Level 3 investments, when transfers occur.
NOTE 5. INDUSTRY DIVERSIFICATION
The following table shows the percentage of our net assets invested by industry as of June 30, 2021. | | | | | | | | | | | | | | | | | | | | | | | |
| Industry | Value as of June 30, 2021 | | % of Net Assets | | Value as of June 30, 2021 | | % of Net Assets |
| Application Software | | | | | $ | 11,507,723 | | | 10.4% |
| Unaffiliated Portfolio Companies | $ | 0 | | | 0.0% | | | | |
| Non-Controlled Affiliated Portfolio Companies | 11,507,723 | | | 10.4% | | | | |
| Controlled Affiliated Portfolio Companies | 0 | | | 0.0% | | | | |
| Asset Management & Custody Banks | | | | | 225,000 | | | 0.2% |
| Unaffiliated Portfolio Companies | 225,000 | | | 0.2% | | | | |
| Non-Controlled Affiliated Portfolio Companies | 0 | | | 0.0% | | | | |
| Controlled Affiliated Portfolio Companies | 0 | | | 0.0% | | | | |
| Biotechnology | | | | | 407,670 | | | 0.4% |
| Unaffiliated Portfolio Companies | 407,670 | | | 0.4% | | | | |
| Non-Controlled Affiliated Portfolio Companies | 0 | | 0.0% | | | | |
| Controlled Affiliated Portfolio Companies | 0 | | 0.0% | | | | |
| Building Products | | | | | 3,136,411 | | | 2.8% |
| Unaffiliated Portfolio Companies | 3,136,411 | | | 2.8% | | | | |
| Non-Controlled Affiliated Portfolio Companies | 0 | | | 0.0% | | | | |
| Controlled Affiliated Portfolio Companies | 0 | | | 0.0% | | | | |
| Fertilizers & Agricultural Chemicals | | | | | 12,142,484 | | | 11.0% |
| Unaffiliated Portfolio Companies | 12,142,484 | | | 11.0% | | | | |
| Non-Controlled Affiliated Portfolio Companies | 0 | | | 0.0% | | | | |
| Controlled Affiliated Portfolio Companies | 0 | | | 0.0% | | | | |
| Communications Equipment | | | | | 3,372,008 | | | 3.0% |
| Unaffiliated Portfolio Companies | 3,372,008 | | | 3.0% | | | | |
| Non-Controlled Affiliated Portfolio Companies | 0 | | 0.0% | | | | |
| Controlled Affiliated Portfolio Companies | 0 | | 0.0% | | | | |
| Health Care Equipment | | | | | 1,406,990 | | | 1.3% |
| Unaffiliated Portfolio Companies | 0 | | | 0.0% | | | | |
| Non-Controlled Affiliated Portfolio Companies | 1,406,990 | | | 1.3% | | | | |
| Controlled Affiliated Portfolio Companies | 0 | | | 0.0% | | | | |
| Health Care Services | | | | | 1,382,757 | | | 1.2% |
| Unaffiliated Portfolio Companies | 1,382,757 | | | 1.2% | | | | |
| Non-Controlled Affiliated Portfolio Companies | 0 | | | 0.0% | | | | |
| Controlled Affiliated Portfolio Companies | 0 | | | 0.0% | | | | |
| Health Care Technology | | | | | 4,760,029 | | | 4.3% |
| Unaffiliated Portfolio Companies | 2,262,244 | | | 2.0% | | | | |
| Non-Controlled Affiliated Portfolio Companies | 2,497,785 | | | 2.3% | | | | |
| Controlled Affiliated Portfolio Companies | 0 | | | 0.0% | | | | |
| Interactive Media & Services | | | | | 11,352,224 | | | 10.2% |
| Unaffiliated Portfolio Companies | 0 | | | 0.0% | | | | |
| Non-Controlled Affiliated Portfolio Companies | 11,352,224 | | | 10.2% | | | | |
| Controlled Affiliated Portfolio Companies | 0 | | | 0.0% | | | | |
| IT Consulting & Other Services | | | | | 3,913,821 | | | 3.5% |
| Unaffiliated Portfolio Companies | 3,913,821 | | | 3.5% | | | | |
| Non-Controlled Affiliated Portfolio Companies | 0 | | | 0.0% | | | | |
| Controlled Affiliated Portfolio Companies | 0 | | | 0.0% | | | | |
| | | | | | | | | | | | | | | | | | | | | | | |
| Industry | Value as of June 30, 2021 | | % of Net Assets | | Value as of June 30, 2021 | | % of Net Assets |
| Life Sciences Tools & Services | | | | | $ | 3,091,275 | | | 2.8% |
| Unaffiliated Portfolio Companies | $ | 0 | | | 0.0% | | | | |
| Non-Controlled Affiliated Portfolio Companies | 3,091,275 | | | 2.8% | | | | |
| Controlled Affiliated Portfolio Companies | 0 | | | 0.0% | | | | |
| Pharmaceuticals | | | | | 6,871,788 | | | 6.2% |
| Unaffiliated Portfolio Companies | 6,871,788 | | | 6.2% | | | | |
| Non-Controlled Affiliated Portfolio Companies | 0 | | | 0.0% | | | | |
| Controlled Affiliated Portfolio Companies | 0 | | | 0.0% | | | | |
| Research & Consulting Services | | | | | 962,151 | | | 0.9% |
| Unaffiliated Portfolio Companies | 374,689 | | | 0.3% | | | | |
| Non-Controlled Affiliated Portfolio Companies | 587,462 | | | 0.6% | | | | |
| Controlled Affiliated Portfolio Companies | 0 | | | 0.0% | | | | |
| Restaurants | | | | | 10,176,005 | | | 9.2% |
| Unaffiliated Portfolio Companies | 0 | | | 0.0% | | | | |
| Non-Controlled Affiliated Portfolio Companies | 10,176,005 | | | 9.2% | | | | |
| Controlled Affiliated Portfolio Companies | 0 | | | 0.0% | | | | |
| Semiconductors | | | | | 3,131,727 | | | 2.8% |
| Unaffiliated Portfolio Companies | 2,124,131 | | | 1.9% | | | | |
| Non-Controlled Affiliated Portfolio Companies | 1,007,596 | | | 0.9% | | | | |
| Controlled Affiliated Portfolio Companies | 0 | | | 0.0% | | | | |
| Specialty Chemicals | | | | | 2,527,679 | | | 2.3% |
| Unaffiliated Portfolio Companies | 2,527,679 | | | 2.3% | | | | |
| Non-Controlled Affiliated Portfolio Companies | 0 | | | 0.0% | | | | |
| Controlled Affiliated Portfolio Companies | 0 | | | 0.0% | | | | |
| Specialized Finance | | | | | 69,400 | | | 0.1% |
| Unaffiliated Portfolio Companies | 0 | | | 0.0% | | | | |
| Non-Controlled Affiliated Portfolio Companies | 0 | | | 0.0% | | | | |
| Controlled Affiliated Portfolio Companies | 69,400 | | | 0.1% | | | | |
| Steel | | | | | 3,228,149 | | | 2.9% |
| Unaffiliated Portfolio Companies | 0 | | | 0.0% | | | | |
| Non-Controlled Affiliated Portfolio Companies | 3,228,149 | | | 2.9% | | | | |
| Controlled Affiliated Portfolio Companies | 0 | | | 0.0% | | | | |
| Technology Hardware, Storage & Peripherals | | | | | 11,047,130 | | | 10.0% |
| Unaffiliated Portfolio Companies | 11,047,130 | | | 10.0% | | | | |
| Non-Controlled Affiliated Portfolio Companies | 0 | | | 0.0% | | | | |
| Controlled Affiliated Portfolio Companies | 0 | | | 0.0% | | | | |
| Trading Companies & Distributors | | | | | 6,535,078 | | | 5.9% |
| Unaffiliated Portfolio Companies | 6,535,078 | | | 5.9% | | | | |
| Non-Controlled Affiliated Portfolio Companies | 0 | | | 0.0% | | | | |
| Controlled Affiliated Portfolio Companies | 0 | | | 0.0% | | | | |
| Miscellaneous Common Stocks Industries | | | | | 3,843,862 | | | 3.5% |
| Unaffiliated Portfolio Companies | 3,843,862 | | | 3.5% | | | | |
| Non-Controlled Affiliated Portfolio Companies | 0 | | | 0.0% | | | | |
| Controlled Affiliated Portfolio Companies | 0 | | | 0.0% | | | | |
| Total | $ | 105,091,361 | | | | | $ | 105,091,361 | | | |
| | | | | | | |
NOTE 6. DERIVATIVES
The following table presents the effect of derivatives held during the period ended June 30, 2021, along with the respective location in the consolidated financial statements.
CONSOLIDATED STATEMENT OF ASSETS AND LIABILITIES:
| | | | | | | | | | | | | | | | | | | | | | | | | | | | | |
| | Assets | | Liabilities | |
| Derivatives | | Location | | Fair Value | | Location | | Fair Value | |
| Warrants for the purchase of Series A-3 Preferred Stock of NanoTerra, Inc. expiring 11/15/22 | | Investments | | $ | 0 | | | -- | | -- | |
| | | | | | | | | |
| Warrants for the purchase of common stock of OpGen, Inc. expiring 2/17/25 | | Investments | | 2 | | | -- | | -- | |
| | | | | | | | | |
| Warrants for the purchase of common stock of Potbelly Corporation expiring 2/12/26 | | Investments | | 355,839 | | | -- | | -- | |
CONSOLIDATED STATEMENT OF OPERATIONS:
| | | | | | | | | | | | | | | | | | | | | | | |
| Derivatives | | Location | | Net Realized Gain (Loss) | | Net Change in Unrealized Appreciation (Depreciation) | |
Warrants for the purchase of common stock of Alta Equipment Group, Inc. expiring 4/8/241 | | Net Realized Gain (Loss) and Unrealized Appreciation (Depreciation) on Investments | | $ | 0 | | | $ | (299,250) | | |
| | | | | | | |
| Warrants for the purchase of common stock of NanoTerra, Inc. expired 2/22/21 | | Net Realized Gain (Loss) and Unrealized Appreciation (Depreciation) on Investments | | (69,168) | | | 69,168 | | |
| | | | | | | |
| Warrants for the purchase of Series A-3 Preferred Stock of NanoTerra, Inc. expiring 11/15/22 | | Net Realized Gain (Loss) and Unrealized Appreciation (Depreciation) on Investments | | 0 | | | 0 | | |
| | | | | | | |
| Warrants for the purchase of common stock of OpGen, Inc. expiring 2/17/25 | | Net Realized Gain (Loss) and Unrealized Appreciation (Depreciation) on Investments | | 0 | | | (1) | | |
| | | | | | | |
| Warrants for the purchase of common stock of Potbelly Corporation expiring 2/12/26 | | Net Realized Gain (Loss) and Unrealized Appreciation (Depreciation) on Investments | | 0 | | | 130,990 | | |
1 The warrants for Alta Equipment Group, Inc., were exchanged for shares of common stock in April 2021.
NOTE 7. OFFICERS' AND BOARD OF DIRECTORS' COMPENSATION
The aggregate compensation (salaries, 401(k) employer match, medical and dental benefits) paid by the Company during the period ended June 30, 2021, to its officers amounted to approximately $685,000.
The Compensation Committee authorized the accrual of a 2021 bonus pool of $1,288,480 which is included in "Bonus payable" in the Company's Consolidated Statement of Assets and Liabilities." This accrual may be increased or decreased materially by the Compensation Committee throughout 2021, ahead of final determination at the end of the year.
In addition, and similar to prior years, the Compensation Committee awarded a deferred bonus as of December 31, 2020, to certain of the Company's officers of $212,190 payable only upon achievement of certain metrics defined by the Compensation Committee over the next two years. As of June 30, 2021, the portion of the deferred bonus in the amount of $132,619 was included in "Bonus payable", which represented the time-elapsed portion of the deferred bonus accrued on a straight-line basis through June 30, 2021, based on each metric measurement date.
In addition, and similar to prior years, the Compensation Committee awarded a deferred bonus as of December 31, 2019, to certain of the Company's officers of $763,927 payable only upon achievement of certain metrics defined by the Compensation Committee over the next two preceding years. As of June 30, 2021, $381,964 was paid to those certain Company's officers and the portion of the deferred bonus in the amount of $317,030 was included in "Bonus payable", which represented the time-elapsed portion of the deferred bonus accrued on a straight-line basis through June 30, 2021, based on each metric measurement date.
The aggregate compensation paid by the Company to the independent members of its Board of Directors during the period ended June 30, 2021 was $142,500.
Certain officers and directors currently and may in the future serve as members of the board of directors of our portfolio companies, including our controlled portfolio companies. These officers and directors do not receive any compensation for serving in such roles directly from the portfolio companies. Any such cash compensation paid by portfolio companies to members of their respective boards of directors is paid directly to the Company. In the case of securities-based compensation (restricted stock or stock options), the officer or director due such compensation assigns all beneficial interest, including but not limited to economic benefit and voting control, to such securities over to the Company.
NOTE 8. EMPLOYEE BENEFITS
401(k) Plan
We adopted a 401(k) Plan covering substantially all of our employees. Matching contributions to the plan are at the discretion of the Compensation Committee. For the period ended June 30, 2021, the Compensation Committee approved a 100 percent match, which amounted to $55,250.
Medical Benefit Retirement Plan
We historically administered a plan to provide medical and dental insurance for retirees and their spouses who, at the time of their retirement, attained certain years of service with us and a certain age (the "Medical Benefit Retirement Plan"). On April 27, 2017, the Board of Directors terminated the plan. The termination does not affect benefits accrued by former employees who are grandfathered under the former terms of the plan, and the termination of the plan does not affect benefits accrued by certain former employees who were grandfathered under the amended terms of the plan. The Medical Benefit Retirement Plan was terminated for all other employees.
Executive Mandatory Retirement Benefit Plan
On May 5, 2011, the Board of Directors terminated the Amended and Restated Executive Mandatory Retirement Benefit Plan. Our former President accrued benefits under this plan prior to his retirement, and the termination of this plan has no impact on his accrued benefits. At June 30, 2021, we had $182,943 accrued for benefits for this former employee under the plan, which is included in "Post-retirement plan liabilities" on the Company's Consolidated Statement of Assets and Liabilities.
NOTE 9. INCOME TAXES
The Company filed for the 1999 tax year to elect treatment as a RIC under Subchapter M of the Code and qualified for the same treatment for the years 2000 through 2015, as well as 2017 and 2019. The Company did not qualify as a RIC under Subchapter M of the Code in 2016, 2018 and 2020. The Company did not have net taxable income in 2016, 2018 and 2020, so the failure to qualify as a RIC did not result in a tax liability for the Company. We currently intend to qualify as a RIC in 2021, but we cannot guarantee we will do so.
Under certain circumstances, even if we qualified for Subchapter M treatment for a given year, we might act in a subsequent year to ensure that we would be taxed in that subsequent year as a C Corporation, rather than as a RIC. We will fail to qualify for RIC tax treatment for a taxable year if we do not satisfy the 90 percent Income Test, the Diversification Tests or Annual Distribution Requirement for such year. In the event we do not satisfy the 90 percent Income Test, Diversification Tests or the Annual Distribution Requirement for any taxable year, we will be subject to federal tax with respect to all our taxable income, whether or not distributed. In addition to the corporate tax that would be paid by the Company, all our distributions to shareholders in that situation generally will be taxable as ordinary dividends and generally subject to up to a 30 percent withholding tax if received by a non-U.S. shareholder, although such dividends may qualify for long-term capital gain treatment as "qualified dividends" for U.S. shareholders meeting certain holding period requirements. If the aggregate values of our non-qualifying assets remain below 50 percent of total assets and no non-qualifying asset represents more than 25 percent of the total assets, we will continue to pass the Diversification Tests. Rather than selling portfolio companies that are performing well in order to pass our RIC diversification tests, we may opt instead not to qualify as a RIC. We will choose to take such action only if we believe that the result of the action will benefit the Company and our shareholders.
Historically, we invested in D-Wave Systems, Inc. through Parallel Universes, Inc., a Delaware company ("Parallel Universes"), which held shares of D-Wave Systems, Inc. through a Canadian limited company, 4169841 Canada Ltd. ("Canco"). On April 14, 2020, D-Wave Systems, Inc. reorganized as a subsidiary of a new company, DWSI Holdings, Inc. ("DWSI"). This structure could have resulted in taxation at the Parallel Universes and/or CanCo levels on realized gains on the shares of D-Wave Systems that would not be offset by any current or carryforward losses of the Company. In October 2020, CanCo distributed our shares of DWSI to Parallel Universes in a return of capital. Parallel Universes then distributed the shares to 180PH in exchange for 180PH's ownership of Parallel Universes. As of that date, 180PH directly owned shares of DWSI and no longer had direct or indirect ownership of Parallel Universes or CanCo. As such, future realized gains, if any, on the Company's shares of D-Wave Systems may be able to be offset by current or carryforward losses of the Company should such losses exist at the time of realization. In January 2021, D-Wave Systems completed an amalgamation of the reorganized business and changed its corporate name back to D-Wave Systems, Inc.
The Company's status as a RIC is irrevocable, but qualification is measured annually. Given the Company's status as a RIC and that the ability or inability to use such operating loss carryforwards depends on qualification metrics measured in each taxable year separate from prior years, the Company does not include a deferred tax asset and valuation allowance on its Consolidated Statement of Assets and Liabilities.
For federal tax purposes, the Company’s 2017 through 2019 tax years remain open for examination by the tax authorities under the normal three-year statute of limitations. Generally, for New Jersey state tax purposes, the Company’s 2016 through 2019 tax years remain open for examination by the tax authorities under a four-year statute of limitations. The Company will file its 2020 federal and state taxes.
For the period ended June 30, 2021, the Company recorded a consolidated expense of $1,557 in federal, state and local income taxes.
We pay federal, state and local taxes on behalf of Ventures, which is taxed as a C Corporation.
For the period ended June 30, 2021, the Company recorded aggregate unrealized appreciation of $33,283,935, aggregate unrealized depreciation of $18,084,660 and net unrealized appreciation is $15,199,275. The aggregate book cost of investments is $89,892,086. For the period ended June 30, 2021, the Company was in a loss position and therefore did not have any undistributed ordinary income and/or undistributed long-term capital gains.
As of December 31, 2020, we had post-enactment loss carryforwards under the provisions of the Regulated Investment Company Modernization Act of 2010 (the "Act") of $20,326,815 long term. Capital losses as of December 31, 2020, of $1,071,994 may be carried back 3 years or carried forward 5 years. As of December 31, 2020, we had cumulative capital losses, which were derived during years when the Company failed as a RIC, totaling $16,928,250, which may be carried back 3 years or carried forward 5 years. As of December 31, 2020, we had cumulative capital losses, which were derived during years when the Company qualified as a RIC, totaling $3,398,565. Post-enactment losses have no expiration date in years where we qualify as a RIC.
On December 22, 2017, the Tax Cuts and Jobs Act of 2017 (the "2017 Act") was enacted, which among other changes, lowered the tax rates for corporations and how future loss carryforwards can be used against future gains. The change of the federal corporate tax rate from 35 percent to 21 percent in the 2017 Act may impact future decisions regarding the issuance of deemed dividends should the Company failed to qualify as a RIC under Subchapter M of the Code and be in a net taxable gain position on investments.
NOTE 10. COMMITMENTS AND CONTINGENCIES
As of June 30, 2021, the Company committed to invest up to $2.3 million in Parabellum Acquisition Holdings, LLC, upon the completion of an initial public offering of Parabellum Acquisition Corp., a newly organized blank check company formed for the purpose of effecting a merger, capital stock exchange, asset acquisition, stock purchase, reorganization or similar business combination with one or more businesses.
As of June 30, 2021, the Company does not have any commitment or contingencies to invest additional capital in any of its other portfolio companies. Portfolio companies may seek additional capital in the future and any decision by the Company to not participate in the round of financing could result in outcomes that negatively impact the value of the Company's securities of those portfolio companies.
On March 23, 2017, we signed a month-to-month lease for approximately 1,250 square feet of office space located at 7 N. Willow Street, Suite 4B, Montclair, New Jersey. Upon an event of default, the lease provides that the landlord may terminate the lease and require us to pay all rent that would have been payable during the remainder of the lease or until the date the landlord re-enters the premises.
NOTE 11. PORTFOLIO PURCHASES AND SALES
During the period ended June 30, 2021: | | | | | | | | | | | | | | |
| Company | | Purchases/Cost | | Sales Proceeds/Distributions |
| Alta Equipment Group, Inc. | | $ | 0 | | | $ | 3,274,257 | |
| Armstrong Flooring, Inc. | | 3,579,414 | | | 2,743,919 | |
| Babcock & Wilcox Enterprises, Inc. | | 1,989,000 | | | 2,987,380 | |
| Enzo Biochem, Inc. | | 2,239,233 | | | 1,397,842 | |
| Everspin Technologies, Inc. | | 3,055,657 | | | 1,321,537 | |
| Lantronix, Inc. | | 528,684 | | | 1,112,013 | |
| LS180 Acquisition Holdings LLC | | 63,000 | | | 0 | |
| Manitex International, Inc. | | 0 | | | 397,090 | |
| Parabellun Acquisition Partners LLC | | 6,400 | | | 0 | |
| PFSweb, Inc. | | 3,780,312 | | | 0 | |
| Potbelly Corporation | | 989,998 | | | 1,548,214 | |
| Quantum Corporation | | 444,555 | | | 2,887,218 | |
| Sonim Technologies, Inc. | | 1 | | | 2,413,523 | |
Synacor Inc. (1) | | 31,449 | | | 3,996,671 | |
| Synalloy Corporation | | 2,137,488 | | | 0 | |
| Synchronoss Technologies, Inc. | | 8,086,291 | | | 288,134 | |
| Verso Corporation | | 0 | | | 1,213,167 | |
Zymergen, Inc. (2) | | 360,615 | | | 0 | |
Miscellaneous Common Stocks (3) | | 4,970,707 | | | 2,244,374 | |
| Total Public Portfolio Purchases/Sales Proceeds | | $ | 32,262,804 | | | $ | 27,825,339 | |
| | | | |
| NanoTerra, Inc. | | $ | 0 | | | $ | 0 | |
Lodo Therapeutics Corporation (2) | | 0 | | | 360,615 | |
| Funds held in escrow from sales of investments | | 0 | | | 323,683 | |
| Total Private Portfolio Cost and Distributions | | $ | 0 | | | $ | 684,298 | |
| Total Portfolio Purchases/Cost and Sales Proceeds/Distributions | | $ | 32,262,804 | | | $ | 28,509,637 | |
Note: The table above does not include transactions in short-term call options whose maturities at the time of acquisition were one year or less during the period ended June 30, 2021.
(1) During the period ended June 30, 2021, the Company received restricted stock units from Synacor, Inc. ("SYNC") which were issued to the Company for Kevin Rendino's service on the Board of Directors of SYNC. These restricted stock units had a cost basis of $31,449 on the date the restricted stock units vested. Amounts related to restricted stock units are also presented as "Fee income for providing managerial assistance to portfolio companies-non-cash" on the Company's Consolidated Statement of Cash Flows.
(2) During the period ended June 30, 2021, the Company received distributions of Common Stock, valued at $360,615 on the date issued, for the acquisition of Lodo Therapeutics Corporation by Zymergen, Inc., an acquirer unrelated to the Company.
(3) Miscellaneous Common Stocks are unrestricted common stocks of publicly traded companies that the Company has not disclosed publicly.
NOTE 12. SHARE REPURCHASE PROGRAM
On February 19, 2021, our Board reauthorized the repurchase of up to $2.5 million of the Company's common stock within a six-month period from the date of notice to investors, which notice was mailed on or about February 26, 2021. As of June 30, 2021, no repurchases had occurred.
On August 9, 2021, our Board reauthorized the repurchase of up to $2.5 million of the Company's common stock within a six-month period from the date of notice to investors, which notice was mailed on or about August 13, 2021.
NOTE 13. RELATED PARTY TRANSACTIONS
We have historically provided managerial assistance to some of our portfolio companies, including serving as members of the board of directors. In certain cases, we receive fees for providing such assistance. During the period ended June 30, 2021, we received fees totaling $31,449 in non-cash, included in the Company's Consolidated Statement of Operations in "Board fees from portfolio companies."
NOTE 14. SUBSEQUENT EVENTS
The Company has evaluated subsequent events as of June 30, 2021, through the date these financial statements were issued, and include the following:
In July 2021, the Company increased its commitment to invest in Parabellum Acquisition Holdings, LLC upon the completion of an initial public offering of Parabellum Acquisition Corp. from $2.3 million to $2.7 million.
In July 2021, the company in which Black Silicon Holdings, Inc., has a profit interest in, agreed to be sold to an undisclosed acquirer. We currently anticipate this transaction will close before the end of Q3 2021. The Company expects to receive approximately $1 million after closing.
NOTE 15. INVESTMENTS AND ADVANCES TO AFFILIATES - SCHEDULE 12-14 (UNAUDITED)
| | | | | | | | | | | | | | | | | | | | | | | | | | | | | | | | | | | | | | | | | | | | | | | | | | |
| Name of Issuer | | Title of Issue or Nature of Indebtedness (A) | | Amount of Dividends or Interest Credited to Income (B) | | Net Realized Gain (Loss) | | Value as of December 31, 2020 | | Gross Additions (C) | | Gross Reductions (D) | | Net Change in Unrealized Appreciation (Depreciation) | | Value as of June 30, 2021 |
| CONTROLLED AFFILIATED PRIVATELY HELD SECURITIES (E): | | | | | | | | | | | | | | | | |
| LS180 Acquisition Holdings, LLC | | Common Units | | $ | 0 | | | $ | 0 | | | $ | 0 | | | $ | 13,000 | | | $ | 0 | | | $ | 0 | | | $ | 13,000 | |
| | Promissory Note | | 0 | | | 0 | | | 0 | | | 50,000 | | | 0 | | | 0 | | | 50,000 | |
| Parabellum Acquisition Holdings, LLC | | Common Units | | $ | 0 | | | $ | 0 | | | $ | 0 | | | $ | 6,400 | | | $ | 0 | | | $ | 0 | | | $ | 6,400 | |
| Total Controlled Affiliated Privately Held Securities | | | | $ | 0 | | | $ | 0 | | | $ | 0 | | | $ | 69,400 | | | $ | 0 | | | $ | 0 | | | $ | 69,400 | |
| NON-CONTROLLED AFFILIATED PRIVATELY HELD SECURITIES (F): | | | | | | | | | | | | | | | | |
| ABSMaterials, Inc. | | Series A Convertible Preferred Stock | | $ | 0 | | | | | $ | 28,691 | | | $ | 0 | | | $ | (28,691) | | | $ | (28,691) | | | $ | 0 | |
| | Series B Convertible Preferred Stock | | 0 | | | | | 343,821 | | | 0 | | | (343,821) | | | (343,821) | | | 0 | |
| | Secured Convertible Bridge Note (G) | | (47,161) | | | 0 | | | 172,161 | | | 0 | | | (172,161) | | | (125,000) | | | 0 | |
| Accelerator IV-New York Corporation | | Series A Common Stock | | $ | 0 | | | $ | 0 | | | $ | 669,010 | | | $ | 0 | | | $ | (81,548) | | | $ | (81,548) | | | $ | 587,462 | |
| Black Silicon Holdings, Inc. | | Series A Convertible Preferred Stock | | $ | 0 | | | $ | 0 | | | $ | 0 | | | $ | 0 | | | $ | 0 | | | $ | 0 | | | $ | 0 | |
| | Series A-1 Convertible Preferred Stock | | 0 | | | 0 | | | 0 | | | 0 | | | 0 | | | 0 | | | 0 | |
| | Series A-2 Convertible Preferred Stock | | 0 | | | 0 | | | 0 | | | 0 | | | 0 | | | 0 | | | 0 | |
| | Series B-1 Convertible Preferred Stock | | 0 | | | 0 | | | 0 | | | 0 | | | 0 | | | 0 | | | 0 | |
| | Series C Convertible Preferred Stock | | 0 | | | 0 | | | 0 | | | 0 | | | 0 | | | 0 | | | 0 | |
| | Secured Convertible Bridge Notes (H) | | 337,228 | | | 0 | | | 836,798 | | | 170,798 | | | 0 | | | (166,430) | | | 1,007,596 | |
| EchoPixel, Inc. | | Series Seed Convertible Preferred Stock | | $ | 0 | | | $ | 0 | | | $ | 885,465 | | | $ | 0 | | | $ | (97,489) | | | $ | (97,489) | | | $ | 787,976 | |
| | Series Seed-2 Convertible Preferred Stock | | 0 | | | 0 | | | 315,884 | | | 0 | | | (34,790) | | | (34,790) | | | 281,094 | |
| | Series A-2 Convertible Preferred Stock | | 0 | | | 0 | | | 376,990 | | | 0 | | | (39,070) | | | (39,070) | | | 337,920 | |
| | | | | | | | | | | | | | | | |
| | | | | | | | | | | | | | | | | | | | | | | | | | | | | | | | | | | | | | | | | | | | | | | | | | |
| Name of Issuer | | Title of Issue or Nature of Indebtedness (A) | | Amount of Dividends or Interest Credited to Income (B) | | Net Realized Gain (Loss) | | Value as of December 31, 2020 | | Gross Additions (C) | | Gross Reductions (D) | | Net Change in Unrealized Appreciation (Depreciation) | | Value as of June 30, 2021 |
| NON-CONTROLLED AFFILIATED PRIVATELY HELD SECURITIES (F): | | | | | | | | | | | | | | | | |
| Essential Health Solutions, Inc. | | Common Stock | | $ | 0 | | | $ | 0 | | | $ | 0 | | | $ | 0 | | | $ | 0 | | | $ | 0 | | | $ | 0 | |
| | Series A Convertible Preferred Stock | | 0 | | | 0 | | | 327,907 | | | 0 | | | (282,932) | | | (282,932) | | | 44,975 | |
| | Convertible Bridge Note (G) | | (8,154) | | | 0 | | | 11,196 | | | 0 | | | (8,971) | | | (8,971) | | | 2,225 | |
| HALE.life Corporation | | Common Stock | | $ | 0 | | | $ | 0 | | | $ | 111,747 | | | $ | 0 | | | $ | (39,529) | | | $ | (39,529) | | | $ | 72,218 | |
| | Series Seed-1 Convertible Preferred Stock | | 0 | | | 0 | | | 1,632,048 | | | 0 | | | (533,969) | | | (533,969) | | | 1,098,079 | |
| | Series Seed-2 Convertible Preferred Stock | | 0 | | | 0 | | | 1,892,116 | | | 0 | | | (611,828) | | | (611,828) | | | 1,280,288 | |
| TARA Biosystems, Inc. | | Common Stock | | $ | 0 | | | $ | 0 | | | $ | 552,902 | | | $ | 4,471 | | | $ | 0 | | | $ | 4,471 | | | $ | 557,373 | |
| | Series A Convertible Preferred Stock | | 0 | | | 0 | | | 2,444,684 | | | 11,027 | | | 0 | | | 11,027 | | | 2,455,711 | |
| | Series A-2 Convertible Preferred Stock | | 0 | | | 0 | | | 77,881 | | | 310 | | | 0 | | | 310 | | | 78,191 | |
| Total Non-Controlled Affiliated Privately Held Securities | | | | $ | 281,913 | | | $ | 0 | | | $ | 10,679,301 | | | $ | 186,606 | | | $ | (2,274,799) | | | $ | (2,378,260) | | | $ | 8,591,108 | |
| NON-CONTROLLED AFFILIATED PUBLICLY TRADED SECURITIES (F): | | | | | | | | | | | | | | | | |
| Potbelly Corporation | | Common Stock | | $ | 0 | | | $ | 605,785 | | | $ | 5,579,636 | | | $ | 4,240,530 | | | $ | 0 | | | $ | 4,417,810 | | | $ | 9,820,166 | |
| | Warrants for Common Stock | | 0 | | | 0 | | | 0 | | | 355,839 | | | 0 | | | 130,990 | | | 355,839 | |
| Synacor, Inc. | | Common Stock | | $ | 0 | | | $ | (672,175) | | | $ | 2,372,710 | | | $ | 0 | | | $ | (2,372,710) | | | $ | 2,146,801 | | | $ | 0 | |
| | Stock Options | | 0 | | | 31,400 | | | 44,127 | | | 0 | | | (44,127) | | | (44,127) | | | 0 | |
| | Restricted Stock Units | | 0 | | | 86,486 | | | 69,683 | | | 0 | | | (69,683) | | | (69,683) | | | 0 | |
| Synalloy Corporation | | Common Stock | | $ | 0 | | | $ | 0 | | | $ | 775,788 | | | $ | 2,452,361 | | | $ | 0 | | | $ | 314,873 | | | $ | 3,228,149 | |
| Synchronoss Technologies, Inc. | | Common Stock | | $ | 0 | | | $ | 123,079 | | | $ | 1,371,883 | | | $ | 10,135,840 | | | $ | 0 | | | $ | 2,214,604 | | | $ | 11,507,723 | |
| TheMaven, Inc. | | Series H Convertible Preferred Stock | | $ | 0 | | | $ | 0 | | | $ | 2,307,912 | | | $ | 635,677 | | | $ | 0 | | | $ | 635,677 | | | $ | 2,943,589 | |
| | Common Stock | | 0 | | | 0 | | | 6,592,764 | | | 1,815,871 | | | 0 | | | 1,815,871 | | | 8,408,635 | |
| Total Non- Controlled Affiliated Publicly Traded Securities | | | | $ | 0 | | | $ | 174,575 | | | $ | 19,114,503 | | | $ | 19,636,118 | | | $ | (2,486,520) | | | $ | 11,562,816 | | | $ | 36,264,101 | |
| Total Controlled Affiliated Privately Held Securities, Non- Controlled Affiliated Privately Held Securities and Publicly Traded Securities | | | | $ | 281,913 | | | $ | 174,575 | | | $ | 29,793,804 | | | $ | 19,892,124 | | | $ | (4,761,319) | | | $ | 9,184,556 | | | $ | 44,924,609 | |
(A)Common stock, warrants, membership units and, in some cases, preferred stock are generally non-income producing and restricted. The principal amount of debt and the number of shares of common and preferred stock and number of membership units are shown in the accompanying Consolidated Schedule of Investments as of June 30, 2021.
(B)Represents the total amount of interest or dividends credited/(debited) to income for the portion of the period an investment was a control or affiliate investment, as appropriate. Amounts credited to preferred or common stock represent accrued bridge note interest related to conversions that occurred during the period ended June 30, 2021.
(C)Gross additions include increases in investments resulting from new portfolio investments, paid-in-kind interest or dividends, the amortization of discounts and fees. Gross additions also include net increases in unrealized appreciation or decreases in unrealized depreciation.
(D)Gross reductions include decreases in investments resulting from principal collections related to investment repayments or sales, the amortization of premiums and acquisition costs. Gross reductions also include net increases in unrealized depreciation or decreases in unrealized appreciation.
(E)"Controlled Affiliated" is defined as ownership of 25 percent or more, but less than 50.1 percent or more control of the voting shares of the portfolio company, or where we hold the right to appoint one or more members to the portfolio company’s board of directors
(F)"Non-Controlled Affiliated" is defined as ownership of five percent or more, but less than 25 percent, of the voting shares of the portfolio company, or where we hold the right to appoint one or more members to the portfolio company’s board of directors, but less than 25 percent of the members of the board of directors.
(G)Debt security is on non-accural status as of January 1, 2021, and therefore, is considered non-income producing as of the period ended. All interest income recorded in prior periods was reversed.
(H)Debt security was initially on non-accrual status as of April 1, 2018 through March 31, 2021. As of April 1, 2021, the debt security was considered to be income producing and interest income was accrued during the period starting April 1, 2018 through the period ended June 30, 2021.
| | | | | | | | | | | | | | | | | | | | | | | | | | | | | |
| Line for Schedule of Investments | Method / Level | | Primary Industry | | # of Shares Purchased/Principal | | Cost of TURN's Investment | | Valuation |
| CONTROLLED AFFILIATED SECURITIES | | | | | | | | | |
| PRIVATELY HELD SECURITIES | | | | | | | | | |
| LS180 Acquisition Holdings, LLC | | | Specialized Finance | | | | | | |
| Common Units (acquired 4/13/21) | (M) (L3) | | | | 1,300,000 | | $ | 13,000 | | | $ | 13,000 | |
| Unsecured Promissory Note, 0% (acquired 5/10/21, maturing 12/31/21) | (M) (L3) | | | | $ | 50,000 | | | 50,000 | | | 50,000 | |
| | | | | | | $ | 63,000 | | | $ | 63,000 | |
| Parabellum Acquisition Holdings, LLC | | | Specialized Finance | | | | | | |
| Common Units (acquired 4/22/21) | (M) (L3) | | | | 640,000 | | $ | 6,400 | | | $ | 6,400 | |
| Total Controlled Affiliated Privately Held Securities (0.1%) | | | | | | | $ | 69,400 | | | $ | 69,400 | |
| NON-CONTROLLED AFFILIATED SECURITIES | | | | | | | | | |
| PRIVATELY HELD SECURITIES | | | | | | | | | |
| ABSMaterials, Inc. | | | Specialty Chemicals | | | | | | |
| Series A Convertible Preferred Stock (acquired 2/17/10-10/24/11) | (I) (L3) | | | | 390,000 | | | $ | 435,000 | | | $ | 0 | |
| Series B Convertible Preferred Stock (acquired 11/8/13-6/25/14) | (I) (L3) | | | | 1,037,751 | | | 1,217,644 | | | 0 | |
| Secured Convertible Bridge Note, 8% PIK, (acquired 1/20/16, maturing 12/31/21) | (I) (L3) | | | | $ | 100,000 | | | 100,000 | | | 0 | |
| Secured Convertible Bridge Note, 8% PIK, (acquired 3/28/17, maturing 12/31/21) | (I) (L3) | | | | $ | 25,000 | | | 25,000 | | | 0 | |
| | | | | | | $ | 1,777,644 | | | $ | 0 | |
| Accelerator IV-New York Corporation | | | Research & Consulting Services | | | | | | |
| Series A Common Stock (acquired 7/21/14-12/12/18) | (I) (L3) | | | | 833,333 | | | $ | 0 | | | $ | 587,462 | |
| Black Silicon Holdings, Inc. | | | Semiconductors | | | | | | |
| Series A Convertible Preferred Stock (acquired 8/4/15) | (M) (L3) | | | | 233,499 | | | $ | 750,000 | | | $ | 0 | |
| Series A-1 Convertible Preferred Stock (acquired 8/4/15) | (M) (L3) | | | | 2,966,667 | | | 890,000 | | | 0 | |
| Series A-2 Convertible Preferred Stock (acquired 8/4/15) | (M) (L3) | | | | 4,207,537 | | | 2,445,000 | | | 0 | |
| Series B-1 Convertible Preferred Stock (acquired 8/4/15) | (M) (L3) | | | | 1,892,836 | | | 1,169,561 | | | 0 | |
| Series C Convertible Preferred Stock (acquired 8/4/15) | (M) (L3) | | | | 1,674,030 | | | 1,171,316 | | | 0 | |
| Secured Convertible Bridge Note, 8% PIK, (acquired 8/25/16, maturing 8/4/21) | (M) (L3) | | | | $ | 1,278,453 | | | 1,781,596 | | | 1,007,596 | |
| | | | | | | | $ | 8,207,473 | | | $ | 1,007,596 | |
| | | | | | | | | |
| | | | | | | | | | | | | | | | | | | | | | | | | | | | | |
| Line for Schedule of Investments | Method / Level | | Primary Industry | | # of Shares Purchased/Principal | | Cost of TURN's Investment | | Valuation |
| NON-CONTROLLED AFFILIATED SECURITIES | | | | | | | | | |
| PRIVATELY HELD SECURITIES | | | | | | | | | |
| EchoPixel, Inc. | | | Health Care Equipment | | | | | | |
| Series Seed Convertible Preferred Stock (acquired 6/21/13-6/30/14) | (I) (L3) | | | | 4,194,630 | | | $ | 1,250,000 | | | $ | 787,976 | |
| Series Seed-2 Convertible Preferred Stock (acquired 1/22/16) | (I) (L3) | | | | 1,476,668 | | | 500,000 | | | 281,094 | |
| Series A-2 Convertible Preferred Stock (acquired 3/23/17) | (I) (L3) | | | | 1,471,577 | | | 350,000 | | | 337,920 | |
| | | | | | | | $ | 2,100,000 | | | $ | 1,406,990 | |
| Essential Health Solutions, Inc. | | | Health Care Technology | | | | | | |
| Common Stock (acquired 11/18/16) | (I) (L3) | | | | 200,000 | | | $ | 20 | | | $ | 0 | |
| Series A Convertible Preferred Stock (acquired 11/18/16) | (I) (L3) | | | | 2,750,000 | | | 2,750,000 | | | 44,975 | |
| Unsecured Convertible Bridge Note, 8%, (acquired 12/19/18, maturing 12/19/21) | (I) (L3) | | | | $ | 50,000 | | | 50,000 | | | 2,225 | |
| | | | | | | | $ | 2,800,020 | | | $ | 47,200 | |
| HALE.life Corporation | | | Health Care Technology | | | | | | |
| Common Stock (acquired 3/1/16) | (I) (L3) | | | | 1,000,000 | | | $ | 10 | | | $ | 72,218 | |
| Series Seed-1 Convertible Preferred Stock (acquired 3/28/17) | (I) (L3) | | | | 11,000,000 | | | 1,896,920 | | | 1,098,079 | |
| Series Seed-2 Convertible Preferred Stock (acquired 12/28/18) | (I) (L3) | | | | 12,083,132 | | | 2,500,000 | | | 1,280,288 | |
| | | | | | | | $ | 4,396,930 | | | $ | 2,450,585 | |
| TARA Biosystems, Inc. | | | Life Sciences Tools & Services | | | | | | |
| Common Stock (acquired 8/20/14) | (I) (L3) | | | | 2,000,000 | | | $ | 20 | | | $ | 557,373 | |
| Series A Convertible Preferred Stock (acquired 3/31/17) | (I) (L3) | | | | 6,878,572 | | | 2,545,493 | | | 2,455,711 | |
| Series A-2 Convertible Preferred Stock (acquired 4/18/19) | (I) (L3) | | | | 208,577 | | | 100,000 | | | 78,191 | |
| | | | | | | $ | 2,645,513 | | | $ | 3,091,275 | |
| Total Non-Controlled Affiliated Privately Held Securities (7.8%) | | | | | | | $ | 21,927,580 | | | $ | 8,591,108 | |
| | | | | | | | | |
| | | | | | | | | | | | | | | | | | | | | | | | | | | | | |
| Line for Schedule of Investments | Method / Level | | Primary Industry | | # of Shares Purchased/Principal | | Cost of TURN's Investment | | Valuation |
| NON-CONTROLLED AFFILIATED SECURITIES | | | | | | | | | |
| PUBLICLY TRADED SECURITIES | | | | | | | | | |
| Potbelly Corporation | | | Restaurants | | | | | | |
| Common Stock (acquired 6/24/19-2/10/21) | (M) (L1) | | | | 1,243,059 | | | $ | 5,097,814 | | | $ | 9,820,166 | |
| Synalloy Corporation | | | Steel | | | | | | |
| Common Stock (acquired 12/7/20-5/25/21) | (M) (L1) | | | | 323,138 | | | $ | 2,795,173 | | | $ | 3,228,149 | |
| Synchronoss Technologies, Inc. | | | Application Software | | | | | | |
| Common Stock (acquired 7/17/20-6/25/21) | (M) (L1) | | | | 3,205,494 | | | $ | 8,791,014 | | | $ | 11,507,723 | |
| TheMaven, Inc. | | | Interactive Media & Services | | | | | | |
| Series H Convertible Preferred Stock (acquired 6/27/19) | (M) (L3) | | | | 1,320 | | | $ | 2,000,000 | | | $ | 2,943,589 | |
| Common Stock (acquired 12/18/20) | (M) (L3) | | | | 11,429,000 | | | 6,000,000 | | | 8,408,635 | |
| | | | | | | | $ | 8,000,000 | | | $ | 11,352,224 | |
| Total Non-Controlled Affiliated Publicly Traded Securities (32.4%) | | | | | | | $ | 24,684,001 | | | $ | 35,908,262 | |
| DERIVATIVES INVESTMENTS | | | | | | | | | |
| Potbelly Corporation | | | Restaurants | | | | | | |
| Warrants for the Purchase of Common Stock expiring 2/12/26 (acquired 2/10/21) | (I) (L3) | | | | 80,605 | | $ | 224,849 | | | $ | 355,839 | |
| Total Non-Controlled Affiliated Derivative Investments (0.3%) | | | | | | | $ | 224,849 | | | $ | 355,839 | |
| Total Non-Controlled Affiliated Privately Held Securities, Publicly Traded Securities and Derivative Investments (40.5%) | | | | | | | $ | 46,836,430 | | | $ | 44,855,209 | |
| Total Controlled Affiliated and Non-Controlled Affiliated Privately Held Securities, Publicly Traded Securities and Derivative Investments (40.6%) | | | | | | | $ | 46,905,830 | | | $ | 44,924,609 | |
Privacy Policy
We are committed to protecting your privacy. This privacy notice explains the privacy policies of 180 Degree Capital Corp. and its affiliates. This notice supersedes any other privacy notice you may have received from 180 Degree Capital Corp.
Generally, we do not receive any non-public personal information relating to our shareholders, although certain non-public personal information of our shareholders may become available to us. We maintain physical, electronic, and procedural safeguards, according to strict standards of security and confidentiality, all information we receive about you. The only information we collect from you is your name, address, and number of shares you hold. This information is used only so that we can send you annual reports and other information about us, and send you proxy statements or other information required by law. When the Company shares non-public shareholder personal information referred to above, the information is made available for limited business purposes and under controlled circumstances designed to protect our shareholders' privacy. We do not permit use of shareholder information for any non-business or marketing purpose, nor do we permit third parties to rent, sell, trade or otherwise release or disclose information to any other party.
We do not share this information with any non-affiliated third party except as described below.
•180 Degree Capital Corp. and affiliate employees. It is our policy that only our authorized employees who need to know your personal information will have access to it. Our personnel who violate our privacy policy are subject to disciplinary action.
•Service Providers. We may disclose your personal information to companies that provide services on our behalf, such as record keeping and mailing you information. These companies are required to protect your information and use it solely for the purpose for which they received it.
•Courts and Government Officials. If required by law, we may disclose your personal information in accordance with a court order or at the request of government regulators. Only that information required by law, subpoena, or court order will be disclosed.
Annual Meeting of Shareholders
The Company held its Annual Meeting of Shareholders on April 20, 2021. The following votes were cast for directors:
| | | | | | | | | | | | | | |
| For | % Voted For | Withheld | % Vote Withheld |
| Stacy R. Brandom | 7,152,068 | 96.6% | 251,600 | 3.4% |
| Tonia L. Pankopf | 7,157,284 | 96.7% | 246,384 | 3.3% |
| Kevin M. Rendino | 7,189,547 | 97.1% | 214,122 | 2.9% |
| Richard P. Shanley | 7,150,561 | 96.6% | 253,108 | 3.4% |
| Parker A. Weil | 7,152,124 | 96.6% | 251,544 | 3.4% |
| Daniel B. Wolfe | 7,182,709 | 97.0% | 220,959 | 3.0% |
The following votes were cast to ratify PricewaterhouseCoopers LLP as the Company's independent public accounting firm for the fiscal year ending December 31, 2021:
| | | | | | | | |
| For | Against | Abstain |
| 7,356,166 | 19,785 | 27,718 |
| 99.3% | 0.3% | 0.4% |
Proxy Voting
We vote proxies relating to our portfolio securities in the best interest of our shareholders. We review on a case-by-case basis each proposal submitted to a shareholder vote to determine its impact on the portfolio securities held by us. Although we generally vote against proposals that may have a negative impact on our portfolio securities, we may vote for such a proposal if there exists compelling long-term reasons to do so.
Our proxy voting decisions are made by our Portfolio Managers, who are responsible for monitoring each of our investments. To ensure that our vote is not the product of a conflict of interest, we require that: (i) anyone involved in the decision making process disclose to our Chief Compliance Officer any potential conflict that he or she is aware of and any contact that he or she has had with any interested party regarding a proxy vote; and (ii) employees involved in the decision making process or vote administration are prohibited from revealing how we intend to vote on a proposal in order to reduce any attempted influence from interested parties.
Information regarding how the Company voted proxies relating to portfolio securities during the most recent 12-month period ended June 30 is available, without charge, upon request, by calling the Company toll-free at 833-293-1769 and on the SEC's website at http://www.sec.gov.
Portfolio Holdings
The Company files its complete schedule of portfolio holdings with the SEC for the first and third quarters of each fiscal year on Form N-PORT. The Company's Forms N-PORT are available on the SEC's website at http://www.sec.gov and may be reviewed and copied at the SEC's Public Reference Room in Washington D.C. Information on the operation of the Public Reference Room may be obtained by calling 1-800-SEC-0330.
180 Degree Capital Corp.
Board of Directors
| | | | | | | | |
Stacy R. Brandom1,2,3,4 | Tonia L. Pankopf1,2 | Kevin M. Rendino6 |
Richard P. Shanley1,2,3,4,5 | Parker A. Weil1,2,3,4 | Daniel B. Wolfe |
1. Member of Audit Committee 2. Member of Valuation Committee 3. Member of Compensation Committee
4. Member of Nominating Committee 5. Lead Independent Director 6. Chairman of the Board
Officers
| | | | | |
| Kevin M. Rendino | Chairman, Chief Executive Officer and Portfolio Manager |
| Daniel B. Wolfe | President, Chief Financial Officer, Chief Compliance Officer and Portfolio Manager |
| Alicia M. Gift | Senior Controller, Secretary and Treasurer |
| Robert E. Bigelow III | Vice President, Head of Fund Development |
7 N. Willow Street, Suite 4B
Montclair, New Jersey 07042
Phone: 973-746-4500 Fax: 973-746-4508
Website: www.180degreecapital.com Email: ir@180degreecapital.com
Counsel: Schulte Roth & Zabel LLP
Independent Registered Public Accounting Firm: PricewaterhouseCoopers LLP
Custodian of Securities: US Bank, N.A.
Transfer Agent & Registrar: American Stock Transfer & Trust Company, LLC
Stockholder Relations Department
6201 15th Avenue
Brooklyn, New York 11219
877-260-8188
Website: www.astfinancial.com Email: info@astfinancial.com
HOUSEHOLDING OPT-OUT NOTICE
To reduce expenses, we may only mail one copy of the 180 Degree Capital Corp.'s shareholder updates, such as prospectus, annual report, semi-annual report, to those addresses shared by two or more accounts. If you are not a direct shareholder (i.e., you hold your shares of us in a brokerage account), please contact your financial institution to opt out of householding. If you are a direct shareholder (i.e., you hold your shares of us at our transfer agent) and wish to receive individual copies of these documents, please call us toll-free at 833-293-1769. We will begin sending you individual copies thirty days after receiving your request.
Item 2. Code of Ethics.
Not applicable to this semi-annual report.
Item 3. Audit Committee Financial Expert.
Not applicable to this semi-annual report.
Item 4. Principal Accountant Fees and Services.
Not applicable to this semi-annual report.
Item 5. Audit Committee List of Registrants.
Not applicable to this semi-annual report.
Item 6. Investments.
(a) The schedule of investments in securities of unaffiliated issuers is included as part of the report to stockholders filed under Item 1 of this form.
(b) Not applicable.
Item 7. Disclosure of Proxy Voting Policies and Procedures for Closed-End Management Investment Companies.
Not applicable to this semi-annual report.
Item 8. Portfolio Managers of Closed-End Management Investment Companies.
Not applicable to this semi-annual report.
Item 9. Purchases of Equity Securities by Closed-End Management Investment Company and Affiliated Purchasers.
| | | | | | | | | | | | | | |
| Period 2021 | (a) Total Number of Shares Purchased | (b) Average Price Paid Per Share | (c) Total Number of Shares Purchased as Part of Publicly Announced Plans or Programs | (d) Approximate Dollar Value of Shares that May Yet Be Purchased Under the Plans or Programs |
| 01/01 - 01/31 | 0 | | 0 | | 0 | | $ | 2,500,000 | |
| 02/01 - 02/28 | 0 | | 0 | | 0 | | 2,500,000 | |
| 03/01 - 03/31 | 0 | | 0 | | 0 | | 2,500,000 | |
| 04/01 - 04/30 | 0 | | 0 | | 0 | | 2,500,000 | |
| 05/01 - 05/31 | 0 | | 0 | | 0 | | 2,500,000 | |
| 06/01 - 06/30 | 0 | | 0 | | 0 | | 2,500,000 | |
| | | | |
| Total for Period | 0 | | | 0 | | |
On February 19, 2021, our Board reauthorized the repurchase of up to $2.5 million of the Company's common stock within a six-month period from the date of notice to investors, which notice was mailed on or about February 26, 2021. As of June 30, 2021, no repurchase had occurred.
On August 9, 2021, our Board reauthorized the repurchase of up to $2.5 million of the Company's common stock within a six-month period from the date of notice to investors, which notice was mailed on or about August 13, 2021.
Item 10. Submission of Matters to a Vote of Shareholders.
There have been no material changes to the procedures by which shareholders may recommend nominees to the registrant's Board of Directors as set forth in the registrant's Proxy Statement, dated March 2, 2021.
Item 11. Controls and Procedures.
(a) Based on an evaluation of the Registrant's Disclosure Controls and Procedures (as defined in Rule 30a-3(c) under the Investment Company Act of 1940, the “Disclosure Controls”) as of a date within 90 days prior to the filing date (the “Filing Date”) of this Form N-CSR (the “Report”), the Chief Executive Officer (its principal executive officer) and Chief Financial Officer (its principal financial officer) have concluded that the Disclosure Controls are reasonably designed to ensure that information required to be disclosed by the Registrant in the Report is recorded, processed, summarized and reported by the Filing Date, including ensuring that information required to be disclosed in the Report is accumulated and communicated to the Registrant's management, including the Registrant's principal executive officer and principal financial officer, as appropriate to allow timely decisions regarding required disclosure.
(b) There were no changes in the Registrant’s internal control over financial reporting (as defined in Rule 30a-3(d) under the Investment Company Act of 1940) that occurred during period covered by this report that have materially affected or are reasonably likely to materially affect the Registrant’s internal control over financial reporting.
Item 12. Disclosure of Securities Lending Activities for Closed-End Management Investment Companies.
(a) Not applicable.
(b) Not applicable.
Item 13. Exhibits.
(a)(1) The Code of Conduct is available on the Company's website at https://ir.180degreecapital.com/governance-docs.
(a)(3) Not applicable.
(a)(4) Not applicable.
SIGNATURES
Pursuant to the requirements of the Securities Exchange Act of 1934 and the Investment Company Act of 1940, the Registrant has duly caused this report to be signed on its behalf by the undersigned, thereunto duly authorized.
180 DEGREE CAPITAL CORP.
| | | | | |
| By: | /s/ Daniel B. Wolfe |
| | Name: Daniel B. Wolfe |
| | Title: President and Chief Financial Officer |
| | |
| | Date: August 10, 2021 |
Pursuant to the requirements of the Securities Exchange Act of 1934 and the Investment Company Act of 1940, this report has been signed below by the following persons on behalf of the Registrant and in the capacities and on the dates indicated.
| | | | | | | | | | | | | | |
| By: | /s/ Kevin M. Rendino | | By: | /s/ Daniel B. Wolfe |
| | Name: Kevin M. Rendino | | | Name: Daniel B. Wolfe |
| | Title: Chief Executive Officer | | | Title: President and Chief Financial Officer |
| | (Principal Executive Officer) | | | (Principal Financial Officer) |
| | | | | |
| | Date: August 10, 2021 | | | Date: August 10, 2021 |