20
A
maximum
of 20 percent of our total shares of our common stock issued and outstanding
are
available for awards under the Stock Plan. Under the Stock Plan, no more
than 25
percent of the shares of stock reserved for the grant of the awards under
the
Stock Plan may be restricted stock awards at any time during the term of
the
Stock Plan. If any shares of restricted stock are awarded, such awards will
reduce on a percentage basis the total number of shares of stock for which
options may be awarded. If the Company does not receive exemptive relief
from
the SEC to issue restricted stock, all shares granted under the Stock Plan
may
be subject to stock options. No more than 1,000,000 shares of our common
stock
may be made subject to awards under the Stock Plan to any individual in any
year.
On
June
26, 2006, the Compensation Committee of the Board of Directors of the Company
approved individual stock option awards for certain officers and employees
of
the Company. Both non-qualified stock options ("NQSOs") and incentive stock
options ("ISOs"), subject to the limitations of Section 422 of the Internal
Revenue Code, were awarded under the Stock Plan. The terms and conditions
of the
stock options granted were determined by the Compensation Committee and set
forth in award agreements between the Company and each award recipient. A
total
of 3,958,283 stock options were granted with vesting periods ranging from
December 2006 to June 2014 and with an exercise price of $10.11. Upon exercise,
the shares will be issued from our previously authorized shares. The full
Board
of Directors ratified and approved the grants on August 3, 2006, on which
date
the Company's common stock price fluctuated between $9.76 and
$10.00.
On
June
27, 2007, the Compensation Committee of the Board of Directors of the Company
approved a new grant of individual NQSO awards for certain officers and
employees of the Company. The grant and exercise price were approved by the
full
Board of Directors on June 27, 2007. The terms and conditions of the stock
options granted were determined by the Compensation Committee and set forth
in
award agreements between the Company and each award recipient entered into
on
that date. A total of 1,700,609 stock options were granted with vesting periods
ranging from December 2007 to June 2014 and with an exercise price of $11.11,
which was the closing volume weighted average price of our shares of common
stock on June 27, 2007. Upon exercise, the shares will be issued from our
previously authorized but unissued shares.
The
Company accounts for the Stock Plan in accordance with the provisions of
SFAS
No. 123(R), “Share-Based Payment,” which requires that we determine the fair
value of all share-based payments to employees, including the fair value
of
grants of employee stock options, and record these amounts as an expense
in the
Statement of Operations over the vesting period with a corresponding increase
to
our additional paid-in capital. At June 30, 2007, the increase to our operating
expenses was offset by the increase to our additional paid-in capital, resulting
in no net impact to our net asset value. Additionally, the Company does not
record the tax benefits associated with the expensing of stock options because
the Company intends to qualify as a RIC under Subchapter M of the
Code.
The
amount of stock-based compensation expense recognized in the Consolidated
Statements of Operations is based on the fair value of the awards the Company
expects to vest, recognized over the vesting period on a straight-line basis
for
each award, and adjusted for actual forfeitures that occur before vesting.
The
forfeiture rate is estimated at the time of grant and revised, if necessary,
in
subsequent periods if the actual forfeiture rate differs from the estimated
rate.
21
The
fair
value of each stock option award is estimated on the date of grant using
the
Black-Scholes option pricing model. The stock options granted on June 27,
2007,
were awarded in four different grant types, each with different contractual
terms. The assumptions used in the calculation of fair value of the stock
options granted on June 27, 2007, using the Black-Scholes model for each
contract term were as follows:
|
Number
|
Expected
|
Expected
|
Expected
|
Risk-free
|
Fair
Value
|
|||||||||||||||||
|
Contractual
|
of
Options
|
Term
|
Volatility
|
Dividend
|
Interest
|
Per
|
||||||||||||||||
|
Type
of Award
|
Term
|
Granted
|
in
Yrs
|
Factor
|
Yield
|
Rates
|
Share
|
|||||||||||||||
|
Non-qualified
stock options
|
1.5
Years
|
380,000
|
1
|
42.6
|
%
|
0
|
%
|
4.93
|
%
|
$
|
2.11
|
|||||||||||
|
Non-qualified
stock options
|
2.5
Years
|
600,540
|
2
|
40.1
|
%
|
0
|
%
|
4.91
|
%
|
$
|
2.92
|
|||||||||||
|
Non-qualified
stock options
|
3.5
Years
|
338,403
|
3
|
44.7
|
%
|
0
|
%
|
4.93
|
%
|
$
|
3.94
|
|||||||||||
|
Non-qualified
stock options
|
9
Years
|
381,666
|
Ranging
from 4.75- 6.28
|
Ranging
from 57.8% to 59.9
|
%
|
0
|
%
|
Ranging
from 4.97% to 5.01
|
%
|
Ranging
from $5.92 to $6.85
|
||||||||||||
|
Total
|
1,700,609
|
|||||||||||||||||||||
For
the
three months and six months ended June 30, 2007, the Company recognized
$1,732,456 and $3,422,637 of compensation expense in the Consolidated Statements
of Operations, respectively. As of June 30, 2007, there was approximately
$12,482,116 of unrecognized compensation cost related to unvested stock
option
awards. This cost is expected to be recognized over a weighted-average
period of
approximately 1.60 years.
For
the
three months ended June 30, 2007, a total of 500,895 options were exercised
for
total proceeds to the Company of $5,064,045. For the six months ended June
30,
2007, a total of 826,907 options were exercised for total proceeds to the
Company of $8,360,029. At June 30, 2007, we had a receivable from our broker
of
$151,565 for options exercised at the end of June. These funds were received
in
July 2007.
For
the
three months and six months ended June 30, 2007, the calculation of the
net
decrease in net assets resulting from operations per share excludes the
stock
options because such options were anti-dilutive. The options may be dilutive
in
future periods in which there is a net increase in net assets resulting
from
operations, in the event that there is a significant increase in the average
stock price in the stock market or significant decreases in the amount
of
unrecognized compensation cost.
22
A
summary
of the changes in outstanding stock options is as follows:
|
Weighted
|
Weighted
|
|||||||||||||||
|
Weighted
|
Average
|
Average
|
||||||||||||||
|
Average
|
Grant
|
Remaining
|
Aggregate
|
|||||||||||||
|
Exercise
|
Date
|
Contractual
|
Intrinsic
|
|||||||||||||
|
Shares
|
Price
|
Fair
Value
|
Term
(Yrs)
|
Value
|
||||||||||||
|
Options
Outstanding at January 1, 2007
|
3,699,611
|
$
|
10.11
|
$
|
4.43
|
|||||||||||
|
Granted
|
1,700,609
|
$
|
11.11
|
$
|
3.68
|
3.93
|
||||||||||
|
Exercised
|
826,907
|
$
|
10.11
|
$
|
1.80
|
|||||||||||
|
Forfeited
or Expired
|
-
.
|
|||||||||||||||
|
Options
Outstanding at June 30, 2007
|
4,573,313
|
$
|
10.48
|
$
|
4.62
|
4.73
|
$
|
3,284,302
|
||||||||
|
Options
Exercisable at June 30, 2007
|
1,192,129
|
$
|
10.11
|
$
|
5.07
|
5.19
|
$
|
1,299,421
|
||||||||
|
Options
Exercisable and Expected to be
Exercisable
at June 30, 2007
|
4,190,908
|
$
|
10.51
|
$
|
4.57
|
4.71
|
$
|
2,883,903
|
||||||||
The
aggregate intrinsic value in the table above with respect to options
outstanding, exercisable and expected to be exercisable, is calculated
as the
difference between the Company's closing stock price of $11.20 on the last
trading day of the second quarter of 2007 and the exercise price, multiplied
by
the number of in-the-money options. This represents the total pre-tax intrinsic
value that would have been received by the option holders had all options
been
fully vested and all option holders exercised their awards on June 30,
2007.
For
the
six months ended June 30, 2007, the aggregate intrinsic value of the 826,907
options exercised was $1,421,973.
Unless
earlier terminated by our Board of Directors, the Stock Plan will expire
on May
4, 2016. The expiration of the Stock Plan will not by itself adversely
affect
the rights of plan participants under awards that are outstanding at the
time
the Stock Plan expires. Our Board of Directors may terminate, modify or
suspend
the plan at any time, provided that no modification of the plan will be
effective unless and until any required shareholder approval has been obtained.
The Compensation Committee may terminate, modify or amend any outstanding
award
under the Stock Plan at any time, provided that in such event, the award
holder
may exercise any vested options prior to such termination of the Stock
Plan or
award.
NOTE
5. EMPLOYEE PROFIT-SHARING PLAN
Prior
to
the adoption of the Stock Plan, the Company operated the Amended and Restated
Harris & Harris Group, Inc. Employee Profit-Sharing Plan (the "2002 Plan").
Effective May 4, 2006, the 2002 Plan was terminated.
23
The
2002
Plan (and its predecessor) provided for profit sharing by our officers
and
employees equal to 20 percent of our "qualifying income" for that plan
year.
As
soon
as practicable following the year-end, the Compensation Committee determined
whether, and if so how much, qualifying income existed for a plan year.
Approximately 90 percent of the amount determined by the Compensation Committee
was then paid out to plan participants pursuant to the distribution percentages
set forth in the 2002 Plan. The remaining payment was paid out after we
finalized our tax returns for that plan year.
At
June
30, 2007, and December 31, 2006, we accrued $0 and $261,661, respectively,
for
profit sharing. On March 1, 2006, the Company paid $1,897,072 to plan
participants (employees and former employees), which represented approximately
90 percent of the total estimated profit-sharing payment for 2005. The
balance
of $261,661 was paid on January 31, 2007, upon finalization of our tax
returns.
NOTE
6. INCOME TAXES
We
filed
for the 1999 tax year to elect treatment as a regulated investment company
("RIC") under Subchapter M of the Internal Revenue Code of 1986 (the "Code")
and
qualified for the same treatment for the years 2000 through 2005 pursuant
to
Section 851(e) of the Code. On June 20, 2007, we received SEC certification
for
2006. However, there can be no assurance that we will qualify as a RIC
for 2007
or subsequent years. In addition, under certain circumstances, even if
we
qualified for Subchapter M treatment for a given year, we might take action
in a
subsequent year to ensure that we would be taxed in that subsequent year
as a C
Corporation, rather than as a RIC. As a RIC, we must, among other things,
distribute at least 90 percent of our investment company taxable income
and may
either distribute or retain our realized net capital gains on
investments.
Provided
that a proper election is made, a corporation taxable under Subchapter
C of the
Code or a C Corporation that elects to qualify as a RIC continues to be
taxable
as a C Corporation on any gains realized within 10 years of its qualification
as
a RIC (the "Inclusion Period") from sales of assets that were held by the
corporation on the effective date of the RIC election ("C Corporation Assets"),
to the extent of any gain built into the assets on such date ("Built-In
Gain").
If the corporation fails to make a proper election, it is taxable on its
Built-In Gain as of the effective date of its RIC election. We had Built-In
Gains at the time of our qualification as a RIC and made the election to
be
taxed on any Built-In Gain realized during the Inclusion Period.
We
adopted FIN 48 as of January 1, 2007, the beginning of our fiscal year.
As of
January 1, 2007, we had unrecognized tax benefits of $0 and did not record
any
cumulative effect adjustment to net assets as a result of adopting FIN
48.
For
federal tax purposes, the Company’s 2003 through 2006 tax years remain open for
examination by the tax authorities under the normal three year statute
of
limitations. Generally, for state tax purposes, the Company’s 2002 through 2006
tax years remain open for examination by the tax authorities under a four
year
statute of limitations.
During
the second quarter of 2007, we paid $74,454 in federal income tax interest
and
penalties related to the Company's 2005 tax year, which is included in
income
tax expense. At June 30, 2007, we had $0 accrued for federal, state and
local
taxes payable by the Company.
24
We
pay
federal, state and local taxes on behalf of our wholly owned subsidiary,
Harris
& Harris Enterprises, Inc., which is taxed as a C Corporation. For the
three
months ended June 30, 2007, and 2006, our income tax expense for Harris
&
Harris Enterprises, Inc., was $0 and $9,931, respectively. For the six
months
ended June 30, 2007, and 2006, the income tax expense for Harris & Harris
Enterprises, Inc., was $0 and $19,537, respectively.
Continued
qualification as a RIC requires us to satisfy certain investment asset
diversification requirements in future years. Our ability to satisfy
those
requirements may not be controllable by us. There can be no assurance
that we
will qualify as a RIC in subsequent years.
NOTE
7. CAPITAL TRANSACTIONS
On
November 29, 2006, we filed a registration statement with the SEC on
Form N-2 to
register 4,000,000 shares of our common stock. On December 11, 2006,
and on
April 23, 2007, we filed amended registration statements with the SEC.
On May
11, 2007, the SEC declared the registration statement effective. The
common
stock may be sold at prices and on terms to be set forth in one or more
supplements to the prospectus from time to time.
On
June
25, 2007, we completed the sale of 1,300,000 shares of our common stock
for
gross proceeds of $14,027,000; net proceeds of this offering, after placement
agent fees and offering costs of $1,033,832, were $12,993,168.
NOTE
8. SUBSEQUENT EVENTS
On
July
19, 2007, NanoOpto Corporation completed the sale of its assets to API
Nanotronics Corp.
On
July
27, 2007, we made a $916,928 follow-on investment in BridgeLux,
Inc.
On
August
3, 2007, we made a $1,000,000 follow-on investment in a privately held
tiny
technology portfolio company.
25
HARRIS
& HARRIS GROUP, INC.
FINANCIAL
HIGHLIGHTS
(Unaudited)
|
Three
Months Ended June 30
|
Six
Months Ended June 30
|
||||||||||||
|
2007
|
|
2006
|
|
2007
|
|
2006
|
|||||||
|
Per
Share Operating Performance
|
|||||||||||||
|
Net
asset value per share, beginning
|
|||||||||||||
|
of
period
|
$
|
5.27
|
$
|
5.60
|
$
|
5.42
|
$
|
5.68
|
|||||
|
Net
operating (loss)*
|
(0.13
|
)
|
(0.03
|
)
|
(0.26
|
)
|
(0.07
|
)
|
|||||
|
Net
realized income (loss)
|
|||||||||||||
|
on
investments*
|
(0.00
|
)
|
(0.00
|
)
|
(0.00
|
)
|
(0.00
|
)
|
|||||
|
Net
(increase) decrease in unrealized
|
|||||||||||||
|
depreciation
as a result of sales*
|
(0.00
|
)
|
(0.00
|
)
|
(0.00
|
)
|
(0.00
|
)
|
|||||
|
Net
(increase) decrease in unrealized
|
|||||||||||||
|
depreciation on investments held*
|
(0.06
|
)
|
(0.03
|
)
|
(0.23
|
)
|
(0.07
|
)
|
|||||
|
Total
from investment operations*
|
(0.19
|
)
|
(0.06
|
)
|
(0.49
|
)
|
(0.14
|
)
|
|||||
|
Net
increase as a result of stock-
|
|||||||||||||
|
based compensation
|
0.08
|
0
|
0.16
|
0
|
|||||||||
|
Net
increase as a result of stock-
|
|||||||||||||
|
offering
|
0.26
|
0
|
0.26
|
0
|
|||||||||
|
Net
increase as a result of proceeds
|
|||||||||||||
|
from
exercise of options
|
0.12
|
0
|
0.19
|
0
|
|||||||||
|
Total
increase from capital
|
|||||||||||||
|
stock transactions
|
0.46
|
0
|
0.61
|
0
|
|||||||||
|
Net
asset value per share, end
|
|||||||||||||
|
of
period
|
$
|
5.54
|
$
|
5.54
|
$
|
5.54
|
$
|
5.54
|
|||||
|
Stock
price per share, end
|
|||||||||||||
|
of
period
|
$
|
11.20
|
$
|
11.04
|
$
|
11.20
|
$
|
11.04
|
|||||
|
Total
return based on stock price (1)
|
(13.31
|
)%
|
(20.86
|
)%
|
(7.36
|
)%
|
(20.58
|
)%
|
|||||
|
Supplemental
Data:
|
|||||||||||||
|
Net
assets, end of period
|
$
|
128,222,333
|
$
|
115,166,300
|
$
|
128,222,333
|
$
|
115,166,300
|
|||||
|
Ratio
of expenses to average
|
|||||||||||||
|
net
assets (1)
|
2.9
|
%
|
1.3
|
%
|
5.8
|
%
|
2.6
|
%
|
|||||
|
Ratio
of net operating (loss) to
|
|||||||||||||
|
average
net assets (1)
|
(2.4
|
)%
|
(0.60
|
)%
|
(4.7
|
)%
|
(1.3
|
)%
|
|||||
|
Cash
dividend paid per share
|
$
|
0
|
$
|
0
|
$
|
0
|
$
|
0
|
|||||
|
Deemed
dividend per share
|
$
|
0
|
$
|
0
|
$
|
0
|
$
|
0
|
|||||
|
end
of period
|
23,141,924
|
20,756,345
|
23,141,924
|
20,756,345
|
|||||||||
| * |
Based
on Average Shares Outstanding
|
| (1) |
Not
annualized
|
The
accompanying notes are an integral part of this schedule.
26
Item
2. Management's
Discussion and Analysis of Financial Condition and
Results of Operations
The
information contained in this section should be read in conjunction with
the
Company's unaudited June 30, 2007 Consolidated Financial Statements and
the
Company's audited 2006 Consolidated Financial Statements and notes
thereto.
Background
and Overview
We
incorporated under the laws of the state of New York in August 1981.
In 1983, we
completed an initial public offering and invested $406,936 in Otisville
BioTech,
Inc., which also completed an initial public offering later that year.
In 1984,
Charles E. Harris purchased a controlling interest in us which also made
him the
control person of Otisville. We then divested our other assets and became
a
financial services company, with the investment in Otisville as the initial
focus of our business activity.
In
1992,
we registered as an investment company under the 1940 Act, commencing
operations
as a closed-end, non-diversified investment company. In 1995, we elected
to
become a business development company subject to the provisions of Sections
55
through 65 of the 1940 Act.
Throughout
our corporate history, we have made early stage venture capital investments
in
private and public companies in a variety of industries. We define venture
capital investments as investments in start-up firms and small businesses
with
exceptional growth potential. We have invested a substantial portion
of our
assets in venture capital investments of development stage or start-up
companies. These businesses tend to be thinly capitalized, unproven,
small
companies that lack management depth, have little or no history of operations
and are developing unproven technologies. At June 30, 2007, $58,851,548,
or
45.90 percent, of our net assets at fair value consisted of private venture
capital investments, net of unrealized depreciation of $13,320,521. At
December
31, 2006, $53,667,831, or 47.1 percent, of our net assets at fair value
consisted of private venture capital investments, net of unrealized depreciation
of $8,450,969.
Since
our
investment in Otisville in 1983 through June 30, 2007, we have made a
total of
77 venture capital investments, including four private placement investments
in
securities of publicly traded companies. We have sold 44 of these 77
investments, realizing total proceeds of $143,614,382 on our invested
capital of
$51,229,202. As measured from first dollar in to last dollar out, the
average
and median holding periods for these 44 investments were 3.63 years and
3.19
years, respectively. As measured by the 149 separate rounds of investment
within
these 44 investments, the average and median holding periods for the
149
separate rounds of investment were 2.84 years and 2.44 years,
respectively.
In
1994,
we made our first tiny technology investment. From August 2001 through
June 30,
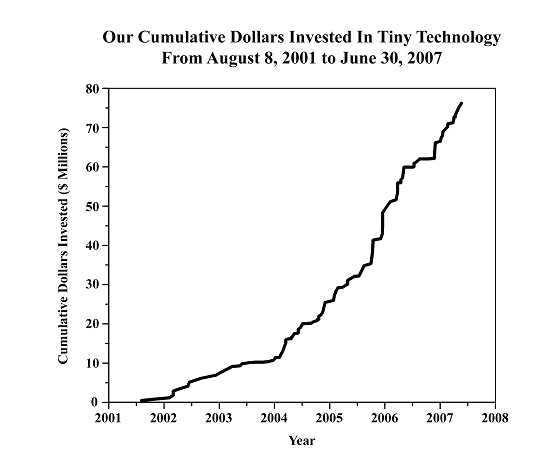
2007, all 35 of our initial investments have been in tiny technology.
From
August 2001 through June 30, 2007, we have invested a total (before any
subsequent write-ups, write-downs or dispositions) of $76,083,116 in
tiny
technology.
27
The
following is a summary of our initial and follow-on investments in
tiny
technology from 2001 to the present. We consider a "round led" to be
a round
where we were the new investor or the leader of a set of new investors
in an
investee company. Typically, but not always, the lead investor negotiates
the
price and terms of a deal with the investee company.
|
2001
|
2002
|
2003
|
2004
|
2005
|
2006
|
YTD
2007
|
||||||||||||||||
|
Total
Incremental Investments
|
$
|
489,999
|
$
|
6,240,118
|
$
|
3,812,600
|
$
|
14,837,846
|
$
|
16,251,339
|
$
|
24,408,187
|
$
|
10,043,027
|
||||||||
|
No.
of New Investments
|
1
|
7
|
5
|
8
|
4
|
6
|
4
|
|||||||||||||||
|
No.
of Follow-On Investment Rounds
|
0
|
1
|
5
|
21
|
13
|
14
|
10
|
|||||||||||||||
|
No.
of Rounds Led
|
0
|
1
|
0
|
2
|
0
|
7
|
2
|
|||||||||||||||
|
Average
Dollar Amount - Initial
|
$
|
489,999
|
$
|
784,303
|
$
|
437,156
|
$
|
911,625
|
$
|
1,575,000
|
$
|
2,383,424
|
$
|
1,223,588
|
||||||||
|
Average
Dollar Amount - Follow-On
|
N/A
|
$
|
750,000
|
$
|
325,364
|
$
|
359,278
|
$
|
765,488
|
$
|
721,974
|
$
|
514,867
|
|||||||||
28
We
currently have 31 tiny technology companies in our portfolio. At June
30, 2007,
from first dollar in, the average and median holding periods for these
31
venture capital investments were 2.87 years and 2.56 years,
respectively.
We
value
our private venture capital investments each quarter as determined
in good faith
by our Valuation Committee, a committee of all of our independent directors,
within guidelines established by our Board of Directors in accordance
with the
1940 Act. (See "Footnote to Consolidated Schedule of Investments" contained
in
"Consolidated Financial Statements.")
In
the
years 2001, 2002, 2003, 2004, 2005 and 2006, the Company recorded the
following
gross write-downs in privately held securities as a percentage of net
assets at
the beginning of the year:
|
2001
|
2002
|
2003
|
2004
|
2005
|
2006
|
YTD
2007
|
||||||||||||||||
|
Net
Asset Value, Beginning of Year
|
$
|
31,833,475
|
$
|
24,334,770
|
$
|
27,256,046
|
$
|
40,682,738
|
$
|
74,744,799
|
$
|
117,987,742
|
$
|
113,930,303
|
||||||||
|
Gross
Write-Downs During Year
|
$
|
(2,532,730
|
)
|
$
|
(5,400,005
|
)
|
$
|
(1,256,102
|
)
|
$
|
(5,711,229
|
)
|
$
|
(3,450,236
|
)
|
$
|
(4,211,323
|
)
|
$
|
(5,704,819
|
)
|
|
|
Gross
Write-Downs as a Percentage of Net Asset Value
|
-7.96
|
%
|
-22.19
|
%
|
-4.61
|
%
|
-14.04
|
%
|
-4.62
|
%
|
-3.57
|
%
|
-5.01
|
%
|
||||||||
We
have
discretion in the investment of our capital. However, we invest primarily
in
illiquid equity securities of private companies. Generally, these investments
take the form of preferred stock, are subject to restrictions on resale
and have
no established trading market. Our principal objective is to achieve
long-term
capital appreciation. Therefore, a significant portion of our investment
portfolio provides little or no income in the form of dividends or
interest. We
earn interest income from fixed-income securities, including U.S. government
and
agency securities. The amount of interest income we earn varies with
the average
balance of our fixed-income portfolio and the average yield on this
portfolio.
Interest income is secondary to capital gains and losses in our results
of
operations.
We
present the financial results of our operations utilizing accounting
principles
generally accepted in the United States for investment companies. On
this basis,
the principal measure of our financial performance during any period
is the net
increase/(decrease) in our net assets resulting from our operating
activities,
which is the sum of the following three elements:
Net
Operating Income / (Loss)
- the
difference between our income from interest, dividends, and fees and
our
operating expenses.
Net
Realized Income / (Loss) on Investments
- the
difference between the net proceeds of sales of portfolio securities
and their
stated cost, plus income from interests in limited liability
companies.
29
Net
Increase / (Decrease) in Unrealized Appreciation or Depreciation on
Investments
- the
net unrealized change in the value of our investment portfolio.
Owing
to
the structure and objectives of our business, we generally expect to
experience
net operating losses and seek to generate increases in our net assets
from
operations through the long-term appreciation of our venture capital
investments. We have relied, and continue to rely, on proceeds from
sales of
investments and on sales of additional shares, rather than on investment
income,
to defray a significant portion of our operating expenses. Because
such sales
are unpredictable, we attempt to maintain adequate working capital
to provide
for fiscal periods when there are no such sales.
Results
of Operations
Three
months ended June 30, 2007, as compared to the three months ended June
30,
2006
In
the
three months ended June 30, 2007, and June 30, 2006, we had net decreases
in net
assets resulting from operations of $4,093,644 and $1,282,997, respectively.
Investment
Income and Expenses:
We
had
net operating losses of $2,891,667 and $693,887 for the three months
ended June
30, 2007, and June 30, 2006, respectively. The variation in these results
is
primarily owing to the changes in investment income and operating expenses.
During the three months ended June 30, 2007, and 2006, total investment
income
was $637,701 and $785,265, respectively. During the three months ended
June 30,
2007, and 2006, total operating expenses were $3,529,368 and $1,479,152,
respectively.
During
the three months ended June 30, 2007, as compared with the same period
in 2006,
investment income decreased from $785,265 to $637,701 owing to a decrease
in our
average holdings of U.S. government and agency securities. During the
three
months ended June 30, 2007, our average holdings of such securities
were
$61,247,875, as compared with $67,744,718 at June 30, 2006.
The
increase in operating expenses for the three months ended June 30,
2007, as
compared to the three months ended June 30, 2006, was primarily owing
to
increases in salaries, benefits and stock-based compensation expense,
increases
in professional fees and directors' fees and expenses, partially offset
by a
decrease in administration and operations expense. Salaries, benefits
and
stock-based compensation expense increased by $1,840,133, or 228.8
percent,
through June 30, 2007, as compared to June 30, 2006, primarily as a
result of
non-cash expense of $1,732,456 associated with the Stock Plan. While
the
non-cash, stock-based, compensation expense for the Stock Plan increased
our
operating expenses by $1,732,456, this increase was offset by a corresponding
increase to our additional paid-in capital, resulting in no net impact
to our
net asset value. The non-cash stock-based compensation expense and
corresponding
increase to our additional paid-in capital may increase in future quarters.
Salaries
and benefits also increased for the three months ended June 30, 2007,
owing to
an increase in our head count as compared with the same period in 2006.
At June
30, 2007, we had 12 full-time and two part-time employees, as compared
with 10
full-time and one part-time employee at June 30, 2006.
Professional fees increased by $237,129, or 242.1 percent, primarily
as a result
of an increase in legal fees. Directors' fees and expenses increased
by $17,257,
or 18.0 percent, primarily as a result of additional meetings held
during the
period ended June 30, 2007, as well as an increase in the monthly retainers
paid
to Committee Chairs and the Lead Independent Director, as compared
with the
period ended June 30, 2006. Administration and operations expense decreased
by
$48,914, or 12.1 percent, for the three months ended June 30, 2007,
as compared
with the same period in 2006, primarily as a result of decreases in
quarterly
reporting and proxy-related expenses and a decrease in the transfer
agent
expense.
30
Realized
Income and Losses on Investments:
During
the three months ended June 30, 2007, we realized net losses on investments
of
$8,213, as compared with realized net gains on investments of $1,500
during the
three months ended June 30, 2006.
During
the three months ended June 30, 2007, we realized net losses of $8,213,
consisting primarily of realized losses on the sale of U.S. government
and
agency securities.
During
the three months ended June 30, 2006, we realized net gains of $1,500,
consisting of income from our investment in AlphaSimplex Group,
LLC.
Net
Unrealized Appreciation and Depreciation on Portfolio
Securities:
During
the three months ended June 30, 2007, net unrealized depreciation on
total
investments increased by $1,193,764, or 9.44 percent, from net unrealized
depreciation of $12,644,883 at March 31, 2007, to net unrealized depreciation
of
$13,838,647 at June 30, 2007. Net unrealized depreciation on total investments
increased by $580,680, or 10.6 percent, during the three months ended
June 30,
2006, from net unrealized depreciation of $5,477,145 at March 31, 2006,
to net
unrealized depreciation of $6,057,825 at June 30, 2006.
During
the three months ended June 30, 2007, net unrealized depreciation on
our venture
capital investments increased by $1,036,500, from $12,284,021 to $13,320,521,
owing primarily to decreases in the valuations of our investments in
Evolved
Nanomaterial Sciences, Inc., of $1,133,677, NanoOpto Corporation of $523,190,
Polatis, Inc., of $15,890 and Questech Corporation of $72,623, partially
offset
by increases in the valuation of our investments in BridgeLux, Inc.,
of
$369,974, Chlorogen, Inc., of $67,748 and Kovio, Inc., of $125,000. We
also had
an increase owing to foreign currency translation of $146,160 on our
investment
in D-Wave Systems, Inc. Unrealized depreciation on our U.S. government
and
agency securities portfolio increased from $360,862 at March 31, 2007,
to
$518,126 at June 30, 2007.
During
the three months ended June 30, 2006, net unrealized depreciation on
our venture
capital investments increased by $219,536, from $4,710,554 to $4,930,090,
owing
primarily to a decrease in the valuation of our investment in NeoPhotonics
Corporation of $319,643 and an increase in the valuation of Questech
Corporation
of $56,934. We also had an unrealized gain on our investment in D-Wave
Systems,
Inc., of $43,175, attributable to foreign currency translation gains.
Unrealized
depreciation on our U.S. government and agency securities portfolio increased
by
$361,144, from $766,591 at March 31, 2006, to $1,127,735 at June 30,
2006.
31
Six
months ended June 30, 2007, as compared to the six months ended June
30,
2006
In
the
six months ended June 30, 2007, we had a net decrease in net assets resulting
from operations of $10,483,804.
In the
six months ended June 30, 2006, we had a net decrease in net assets resulting
from operations of $2,936,987.
Investment
Income and Expenses:
We
had
net operating losses of $5,558,785 and $1,461,630 for the six months
ended June
30, 2007, and June 30, 2006, respectively.
During
the first six months of 2007, as compared with the same period in 2006,
investment income decreased from $1,590,127 to $1,290,199, reflecting
a decrease
in our average holdings throughout the period of U.S. government and
agency
securities. During the six months ended June 30, 2007, our average holdings
of
such securities were $60,666,351, as compared with $72,351,337 at June
30,
2006.
Operating
expenses were $6,848,984 and $3,051,757 for the six months ended June
30, 2007,
and June 30, 2006, respectively. The increase in operating expenses for
the six
months ended June 30, 2007, as compared to the six months ended June
30, 2006,
was primarily owing to increases in salaries, benefits and stock-based
compensation expense and increases in professional fees, directors' fees
and
expenses, and administration and operations expense. Salaries, benefits
and
stock-based compensation expense increased by $3,588,538, or 225.6 percent,
through June 30, 2007, as compared to June 30, 2006, primarily as a result
of
non-cash expense of $3,422,637 associated with the Stock Plan. While
the
non-cash, stock-based, compensation expense for the Stock Plan increased
our
operating expenses by $3,422,637, this increase was offset by a corresponding
increase to our additional paid-in capital, resulting in no net impact
to our
net asset value. The non-cash, stock-based, compensation expense and
corresponding increase to our additional paid-in capital may increase
in future
quarters. Salaries and benefits also increased for the six months ended
June 30,
2007, owing to an increase in our head count as compared with the same
period in
2006. At June 30, 2007, we had 12 full-time and two part-time employees,
as
compared with 10 full-time and one part-time employee at June 30, 2006.
Professional fees increased by $129,437, or 33.38 percent, primarily
as a result
of an increase in legal fees, an increase in audit fees and corporate
consulting
costs for the audit of our compliance program. Directors' fees and expenses
increased by $72,551, or 40.1 percent, primarily as a result of additional
meetings held in the period ended June 30, 2007, as compared with the
period
ended June 30, 2006, as well as an increase in the monthly retainers
paid to
Committee Chairs and the Lead Independent Director. Administration and
operations expense increased by $9,502, or 1.3 percent, for the six months
ended
June 30, 2007, as compared with the same period in 2006.
Realized
Income and Losses on Investments:
During
the six months ended June 30, 2007, we realized net loses on investments
of
$8,887. During the six months ended June 30, 2006, we realized net gains
on
investments of $13,453.
During
the six months ended June 30, 2007, we realized net losses of $8,887,
consisting
primarily of realized losses on the sale of U.S. government and agency
securities and losses on our investment in Exponential Business Development
Company, offset by income from our investment in AlphaSimplex Group,
LLC.
32
During
the six months ended June 30, 2006, we realized net gains of $13,453,
consisting
primarily of proceeds received from the liquidation of Optiva, Inc.,
offset by
net losses realized on our investment in AlphaSimplex Group, LLC. During
2005,
we deemed the securities we held in Optiva, Inc., worthless and recorded
the
proceeds received and due to us on the liquidation of our bridge notes,
realizing a loss of $1,619,245. At December 31, 2005, we recorded a $75,000
receivable for estimated proceeds from the final payment on the Optiva,
Inc.,
bridge notes. During the first quarter of 2006, we received payment of
$95,688
from these bridge notes, resulting in the realized gain of $20,688 on
Optiva,
Inc. These gains were offset by net losses of $10,757 on our investment
in
AlphaSimplex Group, LLC.
Net
Unrealized Appreciation and Depreciation on Investments:
During
the six months ended June 30, 2007,
net
unrealized depreciation on total investments increased by $4,831,227,
or 53.64
percent, from net unrealized depreciation of $9,007,420 at December 31,
2006, to
net unrealized depreciation of $13,838,647 at June 30, 2007. During the
six
months ended June 30, 2006,
net
unrealized depreciation on total investments increased by $1,469,275,
or 32
percent, from net unrealized depreciation of $4,588,550 at December 31,
2005, to
net unrealized depreciation of $6,057,825 at June 30, 2006.
During
the six months ended June 30, 2007, net unrealized depreciation on our
venture
capital investments increased by $4,869,552, from $8,450,969 to $13,320,521,
owing primarily to decreases in the valuations of our investments in
Chlorogen,
Inc., of $1,302,951, Evolved Nanomaterial Sciences, Inc., of $2,361,958,
Nanomix, Inc., of $459,772, NanoOpto Corporation of $1,415,599 and Questech
Corporation of $164,539, offset partially by increases in the valuation
of our
investments in BridgeLux, Inc., of $369,974, Polatis, Inc., of $174,790
and
Kovio, Inc., of $125,000. We also had an increase owing to foreign currency
translation of $164,316 on our investment in D-Wave Systems, Inc. Unrealized
depreciation on our U.S. government and agency securities portfolio decreased
from $556,451 at December 31, 2006, to $518,126 at June 30, 2007.
During
the six months ended June 30, 2006, net unrealized depreciation on our
venture
capital investments increased by $411,081, from $4,519,009 to $4,930,090,
owing
primarily to decreases in the valuation of our investments in NeoPhotonics
Corporation of $319,643, and Zia Laser, Inc., of $187,500, and an increase
in
the valuation of Questech Corporation of $56,934. We also had an increase
owing
to foreign currency translation of $43,175 on our investment in D-Wave
Systems,
Inc. Unrealized depreciation on our U.S. government and agency securities
portfolio increased from $69,541 at December 31, 2005, to $1,127,735
at June 30,
2006.
Financial
Condition
Six
Months ended June 30, 2007
At
June
30, 2007, our total assets and net assets were $132,584,447 and $128,222,333,
respectively. At December 31, 2006, they were $118,328,590 and $113,930,303,
respectively.
At
June
30, 2007, net asset value per share was $5.54, as compared with $5.42
at
December 31, 2006. At June 30, 2007, our shares outstanding increased
to
23,141,924, as compared with 21,015,017 at December 31, 2006.
33
Significant
developments in the six months ended June 30, 2007, included
an increase in the value of our venture capital investments of $5,183,717
and an
increase in the value of our investment in U.S. government and agency
obligations of $9,207,304. The increase in the value of our venture capital
investments, from $53,667,831 at December 31, 2006, to $58,851,548 at
June 30,
2007, resulted primarily from four new and 10 follow-on investments,
partially
offset by a net decrease of $4,870,739 in the net value of our previous
venture
capital investments. The increase in the value of our U.S. government
and agency
obligations, from $58,656,147 at December 31, 2006, to $67,863,451 at
June 30,
2007, is primarily owing to the use of net proceeds of $12,993,168 received
through the registered stock offering and proceeds received from stock
option
exercises of $8,360,029, offset by a payment of $74,454 for federal tax
interest
and penalties, profit sharing payments of $261,661, net operating expenses
and
by new and follow-on venture capital investments totaling
$10,043,027.
The
following table is a summary of additions to our portfolio of venture
capital
investments during the six months ended June 30, 2007:
|
New
Investment
|
Amount
|
|||
|
Adesto
Technologies Corporation
|
$
|
1,147,826
|
||
|
Ancora
Pharmaceuticals, Inc.
|
$
|
800,000
|
||
|
Ensemble
Discovery Corporation
|
$
|
2,000,000
|
||
|
Lifco,
Inc.
|
$
|
946,528
|
||
|
Follow-on
Investment
|
||||
|
BridgeLux,
Inc.
|
$
|
584,795
|
||
|
Cambrios
Technologies Corporation
|
$
|
1,300,000
|
||
|
Chlorogen,
Inc.
|
$
|
7,042
|
||
|
Kereos,
Inc.
|
$
|
540,000
|
||
|
Mersana
Therapeutics, Inc.
|
$
|
500,000
|
||
|
Nanomix,
Inc.
|
$
|
680,240
|
||
|
NanoOpto
Corporation
|
$
|
268,654
|
||
|
Nextreme
Thermal Solutions, Inc.
|
$
|
750,000
|
||
|
Polatis,
Inc.
|
$
|
17,942
|
||
|
Solazyme,
Inc.
|
$
|
500,000
|
||
|
Total
|
$
|
10,043,027
|
The
following tables summarize the fair values of our portfolios of venture
capital
investments and U.S. government and agency obligations, as compared with
their
cost, at June 30, 2007, and December 31, 2006:
|
June
30, 2007
|
|
December
31, 2006
|
|||||
|
Venture
capital investments, at
cost
|
$
|
72,172,069
|
$
|
62,118,800
|
|||
|
Net
unrealized depreciation (1)
|
13,320,521
|
8,450,969
|
|||||
|
at
value
|
$
|
58,851,548
|
$
|
53,667,831
|
|||
34
|
June
30, 2007
|
|
December
31, 2006
|
|||||
|
U.S.
government and agency
|
|||||||
|
obligations,
at cost
|
$
|
68,381,577
|
$
|
59,212,598
|
|||
|
Net
unrealized depreciation(1)
|
518,126
|
556,451
|
|||||
|
obligations,
at value
|
$
|
67,863,451
|
$
|
58,656,147
|
|||
1)At
June 30, 2007, and December 31, 2006, the net accumulated unrealized
depreciation on investments was $13,838,647 and $9,007,420,
respectively.
The
following table summarizes the fair value composition of our venture
capital
investment portfolio at June 30, 2007, and December 31, 2006.
|
June
30, 2007
|
|
December
31, 2006
|
|||||
|
Category
|
|||||||
|
Tiny
Technology
|
99.9
|
%
|
99.9
|
%
|
|||
|
0.1
|
%
|
0.1
|
%
|
||||
|
Total
Venture Capital Investments
|
100.0
|
%
|
100.0
|
%
|
|||
Liquidity
Our
primary sources of liquidity are cash, receivables and freely marketable
securities, net of short-term indebtedness. Our secondary sources of
liquidity
are restricted securities of companies that are publicly traded.
At
June
30, 2007, and December 31, 2006, our total net primary liquidity was
$70,661,859
and $61,323,306, respectively, and our secondary liquidity was $0 and
$0,
respectively.
The
increase in our primary liquidity from December 31, 2006, to June 30,
2007, is
primarily owing to the proceeds received through the registered stock
offering
and proceeds received from stock option exercises, offset by the use
of funds
for investments and payment of net operating expenses.
Capital
Resources
On
November 29, 2006, we filed a registration statement with the SEC on
Form N-2 to
register 4,000,000 shares of our common stock. On December 11, 2006,
and on
April 23, 2007, we filed amended registration statements with the SEC.
On May
11, 2007, the SEC declared the registration statement effective. The
common
stock may be sold at prices and on terms to be set forth in one or more
supplements to the prospectus from time to time.
35
On
June
25, 2007, we completed the sale of 1,300,000 shares of our common stock
for
gross proceeds of $14,027,000; net proceeds of this offering, after placement
agent fees and offering costs of $1,033,832, were $12,993,168.
In
September 2005, we completed the sale of 3,507,500 common shares, for
total
gross proceeds of $37,091,813; net proceeds, after offering costs of
$565,246,
were $36,526,567. We intend to use, and have been using, the net proceeds
of
this offering to make new investments in tiny technology, as well as
for
follow-on investments in our existing venture capital investments and
for
working capital. Through June 30, 2007, we have used $31,741,806 of the
net
proceeds from this offering for these purposes.
Critical
Accounting Policies
The
Company's significant accounting policies are described in Note 3 to
the
Consolidated Financial Statements and in the Footnote to the Consolidated
Schedule of Investments. Critical accounting policies are those that
are both
important to the presentation of our financial condition and results
of
operations and those that require management’s most difficult, complex or
subjective judgments. The Company considers the following accounting
policies
and related estimates to be critical:
Stock-Based
Compensation
Determining
the appropriate fair-value model and calculating the fair value of share-based
awards at the date of grant requires judgment. We use the Black-Scholes
option
pricing model to estimate the fair value of employee stock options, consistent
with the provisions of SFAS No. 123(R). Management uses the Black-Scholes
option pricing model because of the lack of historical option data which
is
required for use in other, more complex models. Other models may yield
fair
values that are significantly different from those calculated by the
Black-Scholes option pricing model.
Option
pricing models, including the Black-Scholes model, require the use of
subjective
input assumptions, including expected volatility, expected life, expected
dividend rate, and expected risk-free rate of return. In the Black-Scholes
model, variations in the expected volatility or expected term assumptions
have a
significant impact on fair value. As the volatility or expected term
assumptions
increase, the fair value of the stock option increases. In the Black-Scholes
model, the expected dividend rate and expected risk-free rate of return
are not
as significant to the calculation of fair value. A higher assumed dividend
rate
yields a lower fair value, whereas higher assumed interest rates yield
higher
fair values for stock options.
We
use
the simplified calculation of expected life described in the SEC’s Staff
Accounting Bulletin 107 because of the lack of historical information
about
option exercise patterns. Future exercise behavior could be materially
different
than that which is assumed by the model.
Expected
volatility is based on the historical fluctuations in the Company's stock.
The
Company's stock has historically been volatile, which increases the fair
value.
36
SFAS
No. 123(R) requires us to develop an estimate of the number of share-based
awards that will be forfeited owing to employee turnover. Quarterly changes
in
the estimated forfeiture rate can have a significant effect on reported
share-based compensation, as the effect of adjusting the rate for all
expense
amortization after the grant date, is recognized in the period the forfeiture
estimate is changed. If the actual forfeiture rate proves to be higher
than the
estimated forfeiture rate, then an adjustment will be made to increase
the
estimated forfeiture rate, which would result in a decrease to the expense
recognized in the financial statements. If the actual forfeiture rate
proves to
be lower than the estimated forfeiture rate, then an adjustment will
be made to
decrease the estimated forfeiture rate, which would result in an increase
to the
expense recognized in the financial statements. Such adjustments would
affect
our operating expenses and additional paid-in capital, but would have
no effect
on our net asset value.
Valuation
of Portfolio Investments
As
a
business development company, we invest in illiquid securities including
debt
and equity securities of private companies. These investments are generally
subject to restrictions on resale and generally have no established trading
market. We value substantially all of our equity investments at fair
value as
determined in good faith by our Valuation Committee on a quarterly basis.
The
Valuation Committee, comprised of all of our non-interested Board members,
reviews and approves the valuation of our investments within the valuation
procedures established by the Board of Directors. Fair value is generally
defined as the amount that an investment could be sold for in an orderly
disposition over a reasonable time. Generally, to increase objectivity
in
valuing our assets, external measures of value, such as public markets
or third
party transactions, are utilized whenever possible. Valuation is not
based on
long-term work-out value, nor immediate liquidation value, nor incremental
value
for potential changes that may take place in the future. Upon sale of
investments, the values that are ultimately realized may be different
from what
is presently estimated. This difference could be material.
Pension
and Post-Retirement Benefit Plan Assumptions
The
Company provides a Retiree Medical Benefit Plan for employees who meet
certain
eligibility requirements. Several statistical and other factors that
attempt to
anticipate future events are used in calculating the expense and liability
values related to our post-retirement benefit plans. These factors include
assumptions we make about the discount rate, the rate of increase in
healthcare
costs, and mortality, among others.
The
discount rate reflects the current rate at which the post-retirement
benefit
liabilities could be effectively settled considering the timing of expected
payments for plan participants. In estimating this rate, we consider
rates of
return on high quality fixed-income investments included in published
bond
indexes. We consider the Moody’s Aa Corporate Bond Index and the Citigroup
Pension Liability Index in the determination of the appropriate discount
rate
assumptions. The weighted average rate we utilized to measure our post
retirement benefit obligation as of December 31, 2006, and to calculate our
2007 expense was 5.75 percent, which is an increase from the 5.5 percent
rate
used in determining the 2006 expense.
Recent
Developments — Portfolio Companies
On
July
19, 2007, NanoOpto Corporation completed the sale of its assets to API
Nanotronics Corp.
37
On
July
27, 2007, we made a $916,928 follow-on investment in BridgeLux,
Inc.
On
August
3, 2007, we made a $1,000,000 follow-on investment in a privately held
tiny
technology portfolio company.
Forward-Looking
Statements
The
information contained herein contains certain forward-looking statements.
These
statements include the plans and objectives of management for future
operations
and financial objectives, portfolio growth and availability of funds.
These
forward-looking statements are subject to the inherent uncertainties
in
predicting future results and conditions. Certain factors that could
cause
actual results and conditions to differ materially from those projected
in these
forward-looking statements are set forth herein. Other factors that could
cause
actual results to differ materially include the uncertainties of economic,
competitive and market conditions, and future business decisions, all
of which
are difficult or impossible to predict accurately and many of which are
beyond
our control. Although we believe that the assumptions underlying the
forward-looking statements included herein are reasonable, any of the
assumptions could be inaccurate and, therefore, there can be no assurance
that
the forward-looking statements included or incorporated by reference
herein will
prove to be accurate. Therefore, the inclusion of such information should
not be
regarded as a representation by us or any other person that our plans
will be
achieved.
Item
3. Quantitative
and Qualitative Disclosures About Market Risk
Our
business activities contain elements of risk. We consider the principal
types of
market risk to be valuation risk and the risk associated with fluctuations
in
interest rates. Although we are risk-seeking rather than risk-averse
in our
investments, we consider the management of risk to be essential to our
business.
Value,
as
defined in Section 2(a)(41) of the 1940 Act, is (i) the market price
for those
securities for which market quotations are readily available and (ii)
fair value
as determined in good faith by, or under the direction of, the Board
of
Directors for all other assets. (See the "Valuation Procedures" in the
"Footnote
to Consolidated Schedule of Investments" contained in "Item 1. Consolidated
Financial Statements.")
Neither
our investments nor an investment in us is intended to constitute a balanced
investment program.
We
have
invested a substantial portion of our assets in private development stage
or
start-up companies. These private businesses tend to be based on new
technology
and to be thinly capitalized, unproven, small companies that lack management
depth and have not attained profitability or have no history of operations.
Because of the speculative nature and the lack of a public market for
these
investments, there is significantly greater risk of loss than is the
case with
traditional investment securities. We expect that some of our venture
capital
investments will be a complete loss or will be unprofitable and that
some will
appear to be likely to become successful but never realize their potential.
Even
when our private equity investments complete initial public offerings
(IPOs), we
are normally subject to lock-up agreements for a period of time, and
thereafter,
the market for the unseasoned publicly traded securities may be relatively
illiquid.
38
Because
there is typically no public market for our interests in the small privately
held companies in which we invest, the valuation of the equity interests
in that
portion of our portfolio is determined in good faith by our Valuation
Committee,
comprised of the independent members of our Board of Directors, in accordance
with our Valuation Procedures. In the absence of a readily ascertainable
market
value, the determined value of our portfolio of equity interests may
differ
significantly from the values that would be placed on the portfolio if
a ready
market for the equity interests existed. Any changes in valuation are
recorded
in our consolidated statements of operations as "Net increase (decrease)
in
unrealized appreciation on investments." Changes in valuation of any
of our
investments in privately held companies from one period to another may
be
volatile.
We
also
invest in short-term money market instruments, and both short and long-term
U.S.
government and agency securities. To the extent that we invest in short
and
long-term U.S. government and agency securities, changes in interest
rates may
result in changes in the value of these obligations which would result
in an
increase or decrease of our net asset value. The level of interest rate
risk
exposure at any given point in time depends on the market environment,
the
expectations of future price and market movements, and the quantity and
duration
of both the short and long-term U.S. government and agency securities
held by
the Company, and it will vary from period to period. If the average interest
rate on U. S. government and agency securities at June 30, 2007, were
to
increase by 25, 75 and 150 basis points, the weighted average value of
these
securities held by us at June 30, 2007, would decrease by approximately
$212,180, $636,539 and $1,273,079, respectively, and our net asset value
would
decrease correspondingly.
Most
of
our investments are denominated in U.S. dollars. We currently have one
investment denominated in Canadian dollars. We are exposed to foreign
currency
risk related to potential changes in foreign currency exchange rates.
The
potential loss in fair value on this investment resulting from a 10 percent
adverse change in quoted foreign currency exchange rates is $188,076
at June 30,
2007.
In
addition, in the future, we may from time to time opt to borrow money
to make
investments. Our net investment income will be dependent upon the difference
between the rate at which we borrow funds and the rate at which we invest
such
funds. As a result, there can be no assurance that a significant change
in
market interest rates will not have a material adverse effect on our
net
investment income in the event we choose to borrow funds for investing
purposes.
Item
4. Controls and Procedures
(a)
Disclosure
Controls and Procedures. As
of the
end of the period covered by this report, the Company’s management, under the
supervision and with the participation of our chief executive officer
and chief
financial officer, conducted an evaluation of the effectiveness of the
design
and operation of our disclosure controls and procedures (as required
by Rules
13a-15 of the 1934 Act). Disclosure controls and procedures means controls
and
other procedures of an issuer that are designed to ensure that information
required to be disclosed by the issuer in the reports that it files or
submits
under the 1934 Act is recorded, processed, summarized and reported, within
time
periods specified in the SEC's rules and forms, and that such information
is
accumulated and communicated to the issuer's management, as appropriate,
to
allow timely decisions regarding required disclosures. As of June 30,
2007,
based upon this evaluation of our disclosure controls and procedures,
our chief
executive officer and chief financial officer concluded that our disclosure
controls and procedures were effective.
39
(b)
Changes
in Internal Control Over Financial Reporting. There
have not been any changes in the Company's internal control over financial
reporting (as such term is defined in Rules 13a-15(f) and 15d-15(f)
under the
Exchange Act) during the second quarter of 2007 to which this report
relates
that have materially affected, or are reasonably likely to materially
affect,
the Company’s internal control over financial reporting.
40
PART
II. OTHER INFORMATION
Item
1A. Risk Factors
Investing
in our common stock involves significant risks relating to our business
and
investment objective. You should carefully consider the risks and uncertainties
described in our Annual Report on Form 10-K for the year ended December
31,
2006, before you purchase any of our common stock. The risks described
in our
Annual Report on Form 10-K are not the only risks facing our Company.
Unknown
additional risks and uncertainties, or ones that we currently consider
immaterial, may also impair our business. If any of these risks or
uncertainties
materialize, our business, financial condition or results of operations
could be
materially adversely affected. In this event, the trading price of
our common
stock could decline, and you could lose all or part of your
investment.
Our
portfolio companies may generate revenues from the sale of non-tiny
technology-enabled products.
We
consider a company to be a tiny technology company if a product or
products, or
intellectual property covering a product or products, that we consider
to be at
the microscale or smaller is material to its business plan. The core
business of
some of these companies may not be tiny technology-enabled products,
and,
therefore, their success or failure may not be dependent upon the tiny
technology aspects of their business. In addition to developing products
that we
consider tiny technology, some of these companies may also develop
products that
we do not consider enabled by tiny technology. Some of these companies
will
generate revenues from the sale of non-tiny technology-enabled products.
Additionally, it is possible that a portfolio company may decide to
change its
business focus after our initial investment and decide to develop and
commercialize non-tiny technology-enabled products.
Item
4. Submission
of Matters to a Vote of Security Holders
On
May 3,
2007, we held our Annual Meeting of Shareholders to (1) elect 12 directors
of
the Company and (2) approve the selection of PricewaterhouseCoopers
LLP as the
independent registered public accountant.
At
the
close of business on the record date, March 13, 2007, an aggregate
of 21,341,029
shares of common stock were issued and outstanding.
All
of
the nominees at the May 3, 2007, Annual Meeting were elected as
directors:
|
Nominees
|
For
|
|
|
Withheld
|
|||
|
W.
Dillaway Ayres, Jr.
|
18,759,040
|
248,578
|
|||||
|
Dr.
C. Wayne Bardin
|
18,550,813
|
456,805
|
|||||
|
Dr.
Phillip A. Bauman
|
18,746,717
|
260,901
|
|||||
|
G.
Morgan Browne
|
18,548,111
|
459,507
|
|||||
|
Dugald
A. Fletcher
|
18,530,066
|
477,552
|
|||||
|
Charles
E. Harris
|
18,472,729
|
534,889
|
|||||
|
Douglas
W. Jamison
|
18,566,558
|
441,060
|
|||||
|
Dr.
Kelly S. Kirkpatrick
|
18,474,592
|
533,026
|
|||||
|
Lori
D. Pressman
|
18,479,919
|
527,791
|
|||||
|
Charles
E. Ramsey
|
18,755,334
|
252,284
|
|||||
|
18,527,178
|
480,440
|
||||||
|
Richard
P. Shanley
|
18,723,193
|
284,425
|
41
With
respect to proposal number two, described as a proposal “to ratify, confirm and
approve the Audit Committee's selection of PricewaterhouseCoopers LLP
as the
independent registered public accountant for the fiscal year ending
December 31,
2007,” the affirmative votes cast were 18,877,267, the negative votes cast
were
85,717, those abstaining were 44,632. There were no broker non-votes
for either
proposal.
Item
6. Exhibits
|
Certification
of CEO pursuant to Section 302 of the Sarbanes-Oxley Act of
2002.
|
|
|
31.02*
|
Certification
of CFO pursuant to Section 302 of the Sarbanes-Oxley Act of
2002.
|
|
|
|
|
32.01*
|
Certification
of CEO and CFO pursuant to 18 U.S.C. Section 1350, as adopted
pursuant to
Section 906 of the Sarbanes-Oxley Act of
2002.
|
*filed
herewith
42