|
x
|
ANNUAL
REPORT PURSUANT TO SECTION 13 OR 15(d) OF THE SECURITIES EXCHANGE ACT OF
1934
|
|
¨
|
TRANSITION
REPORT PURSUANT TO SECTION 13 OR 15(d) OF THE SECURITIES EXCHANGE ACT OF
1934
|
|
HARRIS & HARRIS GROUP, INC.®
|
|
(Exact
Name of Registrant as Specified in Its
Charter)
|
|
New York
|
13-3119827
|
|
|
(State
or Other Jurisdiction
|
(I.R.S.
Employer
|
|
|
of
Incorporation or Organization)
|
Identification
No.)
|
|
1450 Broadway, New York, New
York
|
10018
|
|
(Address
of Principal Executive Offices)
|
(Zip
Code)
|
|
Title of Each Class
|
Name of Each Exchange on Which Registered
|
|
|
Common Stock, $.01 par value
|
Nasdaq Global Market
|
|
None
|
|
(Title
of Class)
|
|
¨Yes þ
No
|
|
¨Yes þ
No
|
|
þYes ¨
No
|
|
þYes ¨
No
|
|
þ
|
|
Large
accelerated filer ¨
|
Accelerated
filer þ
|
|
Non-accelerated
filer ¨
|
Smaller
reporting company ¨
|
|
¨Yes þ
No
|
|
DOCUMENTS INCORPORATED BY
REFERENCE
|
INCORPORATED AT
|
|
|
Harris
& Harris Group, Inc. Proxy Statement for the
|
Part
III, Items 9, 10,
|
|
|
2010
Annual Meeting of Shareholders
|
11,
12 and 13
|
|
Page
|
|||
|
PART
I
|
|||
|
Item
1.
|
Business
|
1
|
|
|
Item
1A.
|
Risk
Factors
|
15
|
|
|
Item
1B.
|
Unresolved
Staff Comments
|
30
|
|
|
Item
2.
|
Properties
|
30
|
|
|
Item
3.
|
Legal
Proceedings
|
30
|
|
|
PART
II
|
|||
|
Item
4.
|
Market
For Registrant's Common Equity, Related Stockholder Matters and Issuer
Purchases of Equity Securities
|
31
|
|
|
Item
5.
|
Selected
Financial Data
|
34
|
|
|
Item
6.
|
Management's
Discussion and Analysis of Financial Condition and Results of
Operations
|
35
|
|
|
Item
6A.
|
Quantitative
and Qualitative Disclosures About Market Risk
|
68
|
|
|
Item
7.
|
Consolidated
Financial Statements and Supplementary Data
|
70
|
|
|
Item
8.
|
Changes
in and Disagreements With Accountants on Accounting and Financial
Disclosure
|
125
|
|
|
Item
8A.
|
Controls
and Procedures
|
125
|
|
|
Item
8B.
|
Other
Information
|
125
|
|
|
PART
III
|
|||
|
Item
9.
|
Directors,
Executive Officers and Corporate Governance
|
126
|
|
|
Item
10.
|
Executive
Compensation
|
126
|
|
|
Item
11.
|
Security
Ownership of Certain Beneficial Owners and Management and Related
Stockholder Matters
|
126
|
|
|
Item
12.
|
Certain
Relationships and Related Transactions, and Director
Independence
|
126
|
|
|
Item
13.
|
Principal
Accountant Fees and Services
|
126
|
|
|
PART
IV
|
|||
|
Item
14.
|
Exhibits
and Financial Statements Schedules
|
127
|
|
|
Signatures
|
130
|
||
|
Exhibit
Index
|
132
|
||
|
Item
1.
|
Business.
|
|
|
·
|
Equity,
equity-related securities (including warrants) and debt with equity
features from either private or public
issuers;
|
|
|
·
|
Venture
capital investments, whether in corporate, partnership or other form,
including development-stage or start-up
entities;
|
|
|
·
|
Intellectual
property or patents or research and development in technology or product
development that may lead to patents or other marketable
technology;
|
|
|
·
|
Debt
obligations of all types having varying terms with respect to security or
credit support, subordination, purchase price, interest payments and
maturity;
|
|
|
·
|
Foreign
securities; and
|
|
|
·
|
Miscellaneous
investments.
|
|
|
·
|
recruiting
management;
|
|
|
·
|
formulating
operating strategies;
|
|
|
·
|
formulating
intellectual property
strategies;
|
|
|
·
|
assisting
in financial planning;
|
|
|
·
|
providing
management in the initial start-up stages;
and
|
|
|
·
|
establishing
corporate goals.
|
|
|
·
|
funding
research and development in the development of a
technology;
|
|
|
·
|
obtaining
licensing rights to intellectual property or
patents;
|
|
|
·
|
acquiring
intellectual property or patents;
or
|
|
|
·
|
forming
and funding companies or joint ventures to commercialize further
intellectual property.
|
|
Item
1A.
|
Risk
Factors.
|
|
|
•
|
stock
market and capital markets
conditions;
|
|
|
•
|
internal
developments in our Company with respect to our personnel, financial
condition and compliance with all
applicable regulations;
|
|
|
•
|
announcements
regarding any of our portfolio
companies;
|
|
|
•
|
announcements
regarding developments in the nanotechnology or cleantech-related fields
in general;
|
|
|
•
|
environmental
and health concerns regarding nanotechnology, whether real or
perceptual;
|
|
|
•
|
announcements
regarding government funding and initiatives related to the development of
nanotechnology or cleantech-related
products;
|
|
|
•
|
general
economic conditions and trends;
and/or
|
|
|
•
|
departures
of key personnel.
|
|
Item
1B.
|
Unresolved
Staff Comments.
|
|
Item
2.
|
Properties.
|
|
Item
3.
|
Legal
Proceedings.
|
|
Item
4.
|
Market
for Registrant's Common Equity, Related Stockholder Matters and Issuer
Purchases of Equity Securities.
|
|
2009 Quarter Ending
|
Low
|
High
|
||||||
|
March
31
|
$ | 2.65 | $ | 4.48 | ||||
|
June
30
|
$ | 3.57 | $ | 5.99 | ||||
|
September
30
|
$ | 5.01 | $ | 6.93 | ||||
|
December
31
|
$ | 4.04 | $ | 6.31 | ||||
|
2008 Quarter Ending
|
Low
|
High
|
||||||
|
March
31
|
$ | 5.76 | $ | 8.98 | ||||
|
June
30
|
$ | 6.00 | $ | 8.73 | ||||
|
September
30
|
$ | 4.97 | $ | 8.50 | ||||
|
December
31
|
$ | 3.10 | $ | 6.58 | ||||
|
Number of securities
to be issued upon
exercise of out-
standing options,
warrants and rights
|
Weighted-average
exercise price of
outstanding options,
warrants and rights
|
Number of securities
remaining available for
future issuance under
equity compensation
plans (excluding
securities reflected in
Column (a))
|
||||||||
|
Plan
category
|
(a)
|
(b)
|
(c)
|
|||||||
|
Equity
compensation plans approved by security holders
|
4,184,503
|
$8.20
|
(1)
|
|||||||
|
|
||||||||||
|
Equity
compensation plans not approved by security holders
|
-
|
|
|
-
|
-
|
|||||
|
TOTAL
|
4,184,503
|
$8.20
|
(1)
|
|||||||
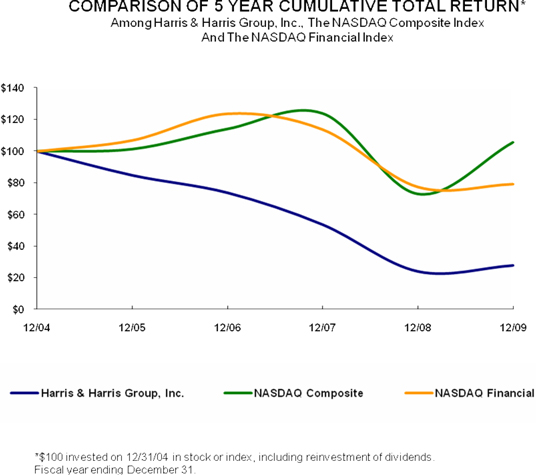
| 12/04 | 12/05 | 12/06 | 12/07 | 12/08 | 12/09 | |||||||||||||||||||
|
Harris
& Harris Group, Inc.
|
100.00 | 84.86 | 73.81 | 53.66 | 24.11 | 27.90 | ||||||||||||||||||
|
NASDAQ
Composite
|
100.00 | 101.33 | 114.01 | 123.71 | 73.11 | 105.61 | ||||||||||||||||||
|
NASDAQ
Financial
|
100.00 | 106.94 | 123.77 | 113.75 | 77.43 | 79.26 | ||||||||||||||||||
|
Item
5.
|
Selected
Financial Data.
|
|
2009
|
2008
|
2007
|
2006
|
2005
|
||||||||||||||||
|
Total
assets
|
$ | 136,109,101 | $ | 111,627,601 | $ | 142,893,332 | $ | 118,328,590 | $ | 132,938,120 | ||||||||||
|
Total
liabilities
|
$ | 1,950,843 | $ | 2,096,488 | $ | 4,529,988 | $ | 4,398,287 | $ | 14,950,378 | ||||||||||
|
Net
assets1
|
$ | 134,158,258 | $ | 109,531,113 | $ | 138,363,344 | $ | 113,930,303 | $ | 117,987,742 | ||||||||||
|
Net
asset value per outstanding share
|
$ | 4.35 | $ | 4.24 | $ | 5.93 | $ | 5.42 | $ | 5.68 | ||||||||||
|
Cash
dividends paid
|
$ | 0.00 | $ | 0.00 | $ | 0.00 | $ | 0.00 | $ | 0.00 | ||||||||||
|
Cash
dividends paid per outstanding share
|
$ | 0.00 | $ | 0.00 | $ | 0.00 | $ | 0.00 | $ | 0.00 | ||||||||||
|
Shares
outstanding, end of year1
|
30,859,593 | 25,859,573 | 23,314,573 | 21,015,017 | 20,756,345 | |||||||||||||||
|
|
2009
|
2008
|
2007
|
2006
|
2005
|
|||||||||||||||
|
Total
investment income
|
$ | 247,848 | $ | 1,987,347 | $ | 2,705,636 | $ | 3,028,761 | $ | 1,540,862 | ||||||||||
|
Total
expenses2
|
$ | 9,009,063 | $ | 12,674,498 | $ | 14,533,179 | $ | 10,641,696 | $ | 7,006,623 | ||||||||||
|
Net
operating loss
|
$ | (8,761,215 | ) | $ | (10,687,151 | ) | $ | (11,827,543 | ) | $ | (7,612,935 | ) | $ | (5,465,761 | ) | |||||
|
Total
tax (benefit) expense 3
|
$ | (753 | ) | $ | 34,121 | $ | 87,975 | $ | (227,355 | ) | $ | 8,288,778 | ||||||||
|
Net
realized (loss) income from investments
|
$ | (11,105,577 | ) | $ | (8,323,634 | ) | $ | 30,162 | $ | 258,693 | $ | 14,208,789 | ||||||||
|
Net
decrease (increase) in unrealized depreciation on
investments
|
$ | 19,718,327 | $ | (30,170,712 | ) | $ | 5,080,936 | $ | (4,418,870 | ) | $ | (2,026,652 | ) | |||||||
|
Net
(decrease) increase in net assets resulting from
operations
|
$ | (148,465 | ) | $ | (49,181,497 | ) | $ | (6,716,445 | ) | $ | (11,773,112 | ) | $ | 6,716,376 | ||||||
|
(Decrease)
increase in net assets resulting from operations per average outstanding
share
|
$ | (0.01 | ) | $ | (1.99 | ) | $ | (0.30 | ) | $ | (0.57 | ) | $ | 0.36 | ||||||
|
Item
6.
|
Management's
Discussion and Analysis of Financial Condition and Results of
Operations.
|
|
Tiny
Technology Companies in Our Active Portfolio as of December 31,
2009
|
Holding
Period (Years)
|
|
Adesto
Technologies Corporation
|
2.9
|
|
Ancora
Pharmaceuticals Inc.
|
2.7
|
|
BioVex
Group, Inc.
|
2.3
|
|
Bridgelux,
Inc.
|
4.6
|
|
Cambrios
Technologies Corporation
|
5.1
|
|
CFX
Battery, Inc.
|
2.5
|
|
Cobalt
Technologies, Inc.
|
1.2
|
|
Crystal
IS, Inc.
|
5.3
|
|
D-Wave
Systems, Inc.
|
3.7
|
|
Ensemble
Discovery Corporation
|
2.6
|
|
Enumeral
Technologies, Inc.
|
0.1
|
|
Innovalight,
Inc.
|
3.7
|
|
Kovio,
Inc.
|
4.1
|
|
Laser
Light Engines, Inc.
|
1.7
|
|
Mersana
Therapeutics, Inc.
|
7.9
|
|
Metabolon,
Inc.
|
4.0
|
|
Molecular
Imprints, Inc.
|
5.8
|
|
NanoGram
Corporation
|
6.7
|
|
Nanosys,
Inc.
|
6.7
|
|
Nantero,
Inc.
|
8.4
|
|
NeoPhotonics
Corporation
|
6.1
|
|
Nextreme
Thermal Solutions, Inc.
|
5.1
|
|
Orthovita,
Inc.
|
0.4
|
|
Polatis,
Inc.
|
7.5
|
|
PolyRemedy,
Inc.
|
1.9
|
|
Questech
Corporation
|
15.6
|
|
Siluria
Technologies, Inc.
|
2.2
|
|
SiOnyx,
Inc.
|
3.6
|
|
Solazyme,
Inc.
|
5.1
|
|
TetraVitae
Bioscience, Inc.
|
1.2
|
|
Xradia,
Inc.
|
3.0
|
|
Average
|
4.3
|
|
Median
|
3.7
|
|
2005
|
2006
|
2007
|
2008
|
2009
|
|
|
Total
Incremental Investments
|
$16,251,339
|
$24,408,187
|
$20,595,161
|
$17,779,462
|
$12,334,051
|
|
Investments
in Privately Held Companies
|
|||||
|
No.
of New Investments
|
4
|
6
|
7
|
4
|
1
|
|
No.
of Follow-On Investment Rounds
|
13
|
14
|
20
|
25
|
27
|
|
No.
of Rounds Led
|
0
|
7
|
3
|
4
|
5
|
|
Average
Dollar Amount – Initial
|
$1,575,000
|
$2,383,424
|
$1,086,441
|
$683,625
|
$250,000
|
|
Average
Dollar Amount – Follow-On
|
$765,488
|
$721,974
|
$649,504
|
$601,799
|
$436,490
|
|
Investments
in Publicly Traded Companies
|
|||||
|
No.
of New Investments
|
0
|
0
|
0
|
0
|
1
|
|
No.
of Follow-On Investment Rounds
|
0
|
0
|
0
|
0
|
2
|
|
Average
Dollar Amount – Initial
|
$0
|
$0
|
$0
|
$0
|
$99,624
|
|
Average
Dollar Amount – Follow-On
|
$0
|
$0
|
$0
|
$0
|
$99,602
|
|
|
·
|
micro-capitalization
companies listed on Nasdaq or on the over-the-counter (OTC)
markets;
|
|
|
·
|
companies
that we think have exceptional growth
potential;
|
|
|
·
|
companies
that operate in markets in which we are familiar because our privately
held venture-backed companies operate in these
markets;
|
|
|
·
|
opportunities
where our experience in emerging technology provides insight into
competitive advantages;
|
|
|
·
|
companies
with disruptive products enabled by nanotechnology that have a shorter
time to commercial launch than that of similar privately held
companies;
|
|
|
·
|
opportunities
where there is a disparity in valuation of similar publicly traded and
privately held companies;
|
|
|
·
|
companies
that have not been widely discovered or followed by the investment
community; and
|
|
|
·
|
opportunities
where the addition of capital to the investee company enables it to reach
a critical milestone, and where the capital is the main factor in
decreasing the risk of meeting that
milestone.
|
|
1)
|
We
manage the company and our investment pace and criteria such that our
projected needs for capital to make new and follow-on investments does not
exceed the total of our liquid investments. Although we use
best efforts to predict when this capital will be required for use in new
and follow-on investments, we cannot predict with certainty the timing for
these investments. We would be unable to make new or follow-on
investments in our portfolio companies without having substantial liquid
resources of capital available to
us.
|
|
2)
|
Venture
capital firms traditionally invest beside other venture capital firms in a
process called syndication. The size of the fund and the amount
of capital reserves available to syndicate partners is often an attribute
potential co-investors consider when deciding on syndicate
partners. As we do not have committed capital from limited
partners, we believe we must have adequate available liquid capital on our
balance sheet to be able to have access to high-quality deal flow and to
co-invest with top-tier venture capital
firms.
|
|
3)
|
We
rarely commit the total amount of cumulative capital intended for
investment in any portfolio company at one point in
time. Instead, our investments consist of multiple rounds of
financing of a given portfolio company, in which we typically participate
if we believe that the merits of such an investment outweigh the
risks. We also commonly have preemptive rights to invest
additional capital in our portfolio companies. These rights
have value, and sometimes are necessary to protect and potentially
increase the value of our positions in our portfolio companies as they
mature. Commonly, the terms of such financings also include
penalties for those investors that do not invest in these subsequent
rounds of financing. Without available capital at the time of
investment, our ownership in the company would be subject to these
penalties that can lead to a partial or complete loss of the capital
invested prior to that round of
financing.
|
|
4)
|
We
may have the opportunity to increase ownership in late rounds of financing
in some of our most mature companies. Many private venture
capital funds that invested in these companies are reaching the end of the
term associated with their limited partnerships. This issue may
limit the available capital to these funds for follow-on investments, and
the ability to take advantage of potentially valuable terms given to those
who have investable capital. Having permanent, liquid capital
available for investment allows us to take advantage of these
opportunities as they arise. In the fourth quarter of 2009, we
had such an opportunity in NeoPhotonics Corporation, one of our most
mature companies.
|
|
Portfolio
Company
|
Board
Member
|
Observer
|
|
Adesto
Technologies Corporation
|
X
|
|
|
Ancora
Pharmaceuticals Inc.
|
X
(2)
|
|
|
BioVex
Group, Inc.
|
X
|
|
|
Bridgelux,
Inc.
|
X
|
|
|
Cambrios
Technology Corporation
|
X
|
|
|
CFX
Battery, Inc.
|
X
|
|
|
Crystal
IS, Inc.
|
X
|
|
|
D-Wave,
Inc.
|
X
|
|
|
Ensemble
Discovery Corporation
|
X
|
|
|
Enumeral
Technologies, Inc.
|
X
(2)
|
|
|
Innovalight,
Inc.
|
X
|
|
|
Kovio,
Inc.
|
X
|
|
|
Laser
Light Engines
|
X
(2)
|
|
|
Mersana
Therapeutics, Inc.
|
X
(2)
|
|
|
Metabolon,
Inc.
|
X
|
|
|
Molecular
Imprints, Inc.
|
X
|
|
|
NanoGram
Corporation
|
X
|
|
|
NeoPhotonics
Corporation
|
X
|
|
|
Nextreme
Thermal Solutions, Inc.
|
X
|
X
|
|
PolyRemedy,
Inc.
|
X
|
|
|
Siluria
Technologies, Inc.
|
X
|
|
|
Sionyx,
Inc.
|
X
|
|
|
Solazyme,
Inc
|
X
|
|
|
Tetravitae
Bioscience, Inc.
|
X
|
|
|
Xradia,
Inc.
|
X
|
|
Q4 2009
|
2009
|
|
|
9/30/09 - 12/31/09
|
12/31/08 – 12/31/09
|
|
|
Dow Jones Industrial Avg.
|
7.4%
|
18.8%
|
|
Nasdaq Composite
|
6.9%
|
43.9%
|
|
S&P 500 Composite
|
5.5%
|
23.5%
|
|
Russell 2000
|
3.5%
|
25.2%
|
|
Harris & Harris Group
|
-26.9%
|
15.7%
|
|
2005
|
2006
|
2007
|
2008
|
2009
|
||||||||||||||||
|
Net
Asset Value, BOY
|
$ | 74,744,799 | $ | 117,987,742 | $ | 113,930,303 | $ | 138,363,344 | $ | 109,531,113 | ||||||||||
|
Gross
Write-Downs During Year
|
$ | (3,450,236 | ) | $ | (4,211,323 | ) | $ | (7,810,794 | ) | $ | (39,671,588 | ) | $ |
(12,845,574
|
)
|
|||||
|
Gross
Write-Ups During Year
|
$ | 23,485,176 | $ | 279,363 | $ | 11,694,618 | $ | 820,559 | $ |
21,631,864
|
||||||||||
|
Gross
Write-Downs as a Percentage of Net Asset Value, BOY
|
-4.62%
|
-3.57%
|
-6.86%
|
-28.67%
|
-11.7%
|
|||||||||||||||
|
Gross
Write-Ups as a Percentage of Net Asset Value,
BOY
|
31.42%
|
|
0.24%
|
10.26%
|
0.59%
|
19.7%
|
||||||||||||||
|
Net
Change as a Percentage of Net Asset Value, BOY
|
26.8%
|
-3.33%
|
3.40%
|
-28.08%
|
8.0%
|
|||||||||||||||
|
Q3
2009 to
Q4
2009
|
Q2
2009 to
Q3
2009
|
Q1
2009 to
Q2
2009
|
Q4
2008 to
Q1
2009
|
|||||||||||||
|
Value
of Private Portfolio as of Previous Quarter
|
$ | 69,876,210 | $ | 63,959,811 | $ | 58,793,688 | $ | 56,965,153 | ||||||||
|
Value
of Private Portfolio as of Current Quarter
|
$ | 77,797,086 | $ | 69,876,210 | $ | 63,959,811 | $ | 58,793,688 | ||||||||
|
Examples
of Inputs that Contribute to Changes in Value
|
||||||||||||||||
|
Total
New and Follow-On Investments
|
$ | 4,698,782 | $ | 3,884,893 | $ | 2,728,373 | $ | 723,176 | ||||||||
|
(+)
Due to Terms of New Equity Rounds of Financing
|
$ | 5,229,990 | $ | 4,725,316 | $ | 2,898,224 | $ | 5,376,988 | ||||||||
|
(-)
Due to Terms of New Equity Rounds of Financing
|
$ | 0 | $ | (1,967,156 | ) | $ | (53,846 | ) | $ | (346,319 | ) | |||||
|
(+)
Due to (+) in Values of Comparables
|
$ | 1,938,047 | $ | 2,823,833 | $ | 680,485 | $ | 0 | ||||||||
|
(-)
Due to (-) in Values of Comparables
|
$ | (6,313 | ) | $ | 0 | $ | (30,050 | ) | $ | (107,681 | ) | |||||
|
(+)
Due to (-) in Non-Performance Risk
|
$ | 500,000 | $ | 0 | $ | 1,049,480 | $ | 0 | ||||||||
|
(-)
Due to (+) in Non-Performance Risk
|
$ | (4,795,765 | ) | $ | (3,794,138 | ) | $ | (2,437,523 | ) | $ | (3,648,616 | ) | ||||
|
Other
Factors1
|
$ | 356,135 | $ | 243,6512 | $ | 330,980 | $ | (169,013 | ) | |||||||
|
Total
Change in Value of Private Portfolio from Quarter to
Quarter
|
$ | 7,920,876 | $ | 5,916,399 | $ | 5,166,123 | $ | 1,828,535 | ||||||||
|
1
|
Other
factors include changes in accrued bridge note interest, currency
fluctuations and the value of
warrants.
|
|
2
|
Includes
changes in the capital account of Exponential Business Development
Company.
|
|
Investment
|
Amount
of Write-Up
|
||
|
Adesto
Technologies Corporation
|
$1,320,000
|
||
|
BioVex
Group, Inc.
|
845,952
|
||
|
Bridgelux,
Inc.
|
987,642
|
||
|
CFX
Battery, Inc.
|
812,383
|
||
|
Ensemble
Discovery Corporation
|
500,000
|
||
|
Metabolon,
Inc.
|
196,512
|
||
|
Molecular
Imprints, Inc.
|
3,841,541
|
||
|
NeoPhotonics
Corporation
|
3,350,923
|
||
|
Nextreme
Thermal Solutions, Inc.
|
2,202,628
|
||
|
Questech
Corporation
|
297,104
|
||
|
Siluria
Technologies, Inc.
|
160,723
|
||
|
Solazyme,
Inc.
|
5,376,988
|
||
|
Xradia,
Inc.
|
1,723,215
|
|
Investment
|
Amount
of Write-Down
|
||
|
Ancora
Pharmaceuticals Inc.
|
$1,072,811
|
||
|
Cambrios
Technologies Corporation
|
257,878
|
||
|
Cobalt
Technologies, Inc.
|
187,499
|
||
|
Crystal
IS, Inc.
|
779,094
|
||
|
D-Wave
Systems, Inc.
|
826,786
|
||
|
Innovalight,
Inc.
|
1,537,713
|
||
|
Kovio,
Inc.
|
2,266,912
|
||
|
Laser
Light Engines, Inc.
|
999,999
|
||
|
Mersana
Therapeutics, Inc.
|
17,500
|
||
|
NanoGram
Corporation
|
1,471,805
|
||
|
Nanosys,
Inc.
|
2,685,059
|
||
|
Orthovita,
Inc.
|
72,432
|
||
|
PolyRemedy,
Inc.
|
136,170
|
||
|
SiOnyx,
Inc.
|
1,076,155
|
|
Investment
|
Amount
of Write-Down
|
||
|
Adesto
Technologies Corporation
|
$1,100,000
|
||
|
Ancora
Pharmaceuticals, Inc.
|
299,439
|
||
|
BioVex
Group, Inc.
|
2,439,250
|
||
|
Bridgelux,
Inc.
|
3,624,553
|
||
|
Cambrios
Technologies Corporation
|
1,297,012
|
||
|
Cobalt
Technologies, Inc.
|
187,499
|
||
|
Crystal
IS, Inc.
|
1,001,300
|
||
|
CSwitch
Corporation
|
5,177,946
|
||
|
D-Wave
Systems, Inc.
|
22,670
|
||
|
Ensemble
Discovery Corporation
|
1,000,000
|
||
|
Innovalight,
Inc.
|
1,927,946
|
||
|
Kereos,
Inc.
|
159,743
|
||
|
Kovio,
Inc.
|
761,497
|
||
|
Mersana
Therapeutics, Inc.
|
1,019,613
|
||
|
Metabolon,
Inc.
|
2,136,734
|
||
|
Molecular
Imprints, Inc.
|
2,365,417
|
||
|
NanoGram
Corporation
|
4,415,417
|
||
|
Nanomix,
Inc.
|
980,418
|
||
|
Neophotonics
Corporation
|
4,024,305
|
||
|
Nextreme
Thermal Solutions, Inc.
|
2,182,133
|
||
|
Polatis,
Inc.
|
276,526
|
||
|
PolyRemedy,
Inc.
|
122,250
|
||
|
Questech
Corporation
|
463,968
|
||
|
Siluria
Technologies, Inc.
|
160,723
|
||
|
SiOnyx,
Inc.
|
1,076,153
|
||
|
Starfire
Systems, Inc.
|
750,000
|
||
|
TetraVitae
Bioscience, Inc.
|
125,000
|
|
New Investments
|
Amount of Investment
|
|||
|
Orthovita,
Inc.
|
$ | 99,624 | ||
|
Enumeral
Technologies, Inc.
|
250,000 | |||
|
Follow-On Investments
|
Amount of Investment
|
|||
|
Adesto
Technologies Corporation
|
$550,000
|
|||
|
Adesto
Technologies Corporation
|
1,635,775
|
|||
|
Ancora
Pharmaceuticals Inc.
|
125,000
|
|||
|
Ancora
Pharmaceuticals Inc.
|
200,000
|
|||
|
Ancora
Pharmaceuticals Inc.
|
100,000
|
|||
|
Ancora
Pharmaceuticals Inc.
|
700,000
|
|||
|
BioVex
Group, Inc.
|
111,111
|
|||
|
BioVex
Group, Inc.
|
166,667
|
|||
|
BioVex
Group, Inc.
|
299,145
|
|||
|
Bridgelux,
Inc.
|
250,124
|
|||
|
Cambrios
Technologies Corporation
|
515,756
|
|||
|
CFX
Battery, Inc.
|
3,492
|
|||
|
CFX
Battery, Inc.
|
533,239
|
|||
|
CFX
Battery, Inc.
|
1,000,000
|
|||
|
CFX
Battery, Inc.
|
300,000
|
|||
|
Cobalt
Technologies, Inc.
|
374,999
|
|||
|
Crystal
IS, Inc.
|
408,573
|
|||
|
Ensemble
Discovery Corporation
|
48,883
|
|||
|
Innovalight,
Inc.
|
721,090
|
|||
|
Laser
Light Engines, Inc.
|
890,000
|
|||
|
Laser
Light Engines, Inc.
|
500,000
|
|||
|
Mersana
Therapeutics, Inc.
|
200,000
|
|||
|
Mersana
Therapeutics, Inc.
|
250,000
|
|||
|
Metabolon,
Inc.
|
1,000,000
|
|||
|
NeoPhotonics
Corporation
|
87,364
|
|||
|
NeoPhotonics
Corporation
|
692,300
|
|||
|
Orthovita,
Inc.
|
99,808
|
|||
|
Orthovita,
Inc.
|
99,395
|
|||
|
PolyRemedy,
Inc.
|
121,706
|
|||
|
|
||||
|
Total
|
$12,334,051
|
|||
|
December 31,
|
||||||||
|
2009
|
2008
|
|||||||
|
Venture
capital investments,
|
||||||||
|
at
cost
|
$ | 92,389,907 | $ | 91,090,001 | ||||
|
Net
unrealized depreciation (1)
|
14,366,426 | 34,124,848 | ||||||
|
Venture
capital investments,
|
||||||||
|
at
value
|
$ | 78,023,481 | $ | 56,965,153 | ||||
|
December 31,
|
||||||||
|
2009
|
2008
|
|||||||
|
U.S.
government obligations,
|
||||||||
|
at
cost
|
$ | 55,960,024 | $ | 52,956,288 | ||||
|
Net
unrealized (depreciation) appreciation(1)
|
(12,443 | ) | 27,652 | |||||
|
U.S.
government obligations,
|
||||||||
|
at
value
|
$ | 55,947,581 | $ | 52,983,940 | ||||
|
New Investments
|
Amount
|
|||
|
Cobalt
Technologies, Inc.
|
$240,000
|
|||
|
Laser
Light Engines, Inc.
|
$2,000,000
|
|||
|
PolyRemedy,
Inc.
|
$244,500
|
|||
|
TetraVitae
Bioscience, Inc.
|
$250,000
|
|||
|
Follow-on Investments
|
||||
|
|
||||
|
Adesto
Technologies Corporation
|
$1,052,174
|
|||
|
Ancora
Pharmaceuticals Inc.
|
$800,000
|
|||
|
BioVex
Group, Inc.
|
$200,000
|
|||
|
Bridgelux,
Inc.
|
$1,000,001
|
|||
|
Cobalt
Technologies, Inc.
|
$134,999
|
|||
|
CFX
Battery, Inc.
|
$526,736
|
|||
|
CSwitch
Corporation
|
$986,821
|
|||
|
CSwitch
Corporation
|
$250,000
|
|||
|
D-Wave
Systems, Inc.
|
$736,019
|
|||
|
D-Wave
Systems, Inc.
|
$487,804
|
|||
|
Ensemble
Discovery Corporation
|
$250,286
|
|
||
|
Kovio,
Inc.
|
$1,500,000
|
|
||
|
Mersana
Therapeutics, Inc.
|
$200,000
|
|
||
|
Metabolon,
Inc.
|
$1,000,000
|
|||
|
NeoPhotonics
Corporation
|
$200,000
|
|||
|
Nextreme
Thermal Solutions, Inc.
|
$377,580
|
|||
|
Nextreme
Thermal Solutions, Inc.
|
$200,000
|
|||
|
Nextreme
Thermal Solutions, Inc.
|
$200,000
|
|||
|
Nextreme
Thermal Solutions, Inc.
|
$800,000
|
|||
|
Nextreme
Thermal Solutions, Inc.
|
$1,050,000
|
|||
|
Phoenix
Molecular Corporation
|
$25,000
|
|||
|
Phoenix
Molecular Corporation
|
$25,000
|
|||
|
Siluria
Technologies, Inc.
|
$42,542
|
|||
|
Solazyme,
Inc.
|
$2,000,000
|
|||
|
Solazyme,
Inc.
|
$1,000,000
|
|||
|
|
||||
|
Total
|
$17,779,462
|
|||
|
·
|
Level 1:
Unadjusted quoted prices in active markets for identical assets or
liabilities.
|
|
·
|
Level 2: Quoted
prices in active markets for similar assets or liabilities, or quoted
prices for identical or similar assets or liabilities in markets that are
not active, or inputs other than quoted prices that are observable for the
asset or liability.
|
|
·
|
Level 3:
Unobservable inputs for the asset or
liability.
|
|
Page
|
|
|
Management's
Report on Internal Control Over
|
|
|
Financial
Reporting
|
71
|
|
Report
of Independent Registered Public Accounting Firm
|
72
|
|
Consolidated Financial
Statements
|
|
|
Consolidated
Statements of Assets and Liabilities
|
|
|
as
of December 31, 2009, and 2008
|
74
|
|
Consolidated
Statement of Operations for the
|
|
|
years
ended December 31, 2009, 2008, and 2007
|
75
|
|
Consolidated
Statements of Cash Flows for the
|
|
|
years
ended December 31, 2009, 2008, and 2007
|
76
|
|
Consolidated
Statements of Changes in Net Assets for the
|
|
|
years
ended December 31, 2009, 2008, and 2007
|
77
|
|
Consolidated
Schedule of Investments as of December 31, 2009
|
78-88
|
|
Consolidated
Schedule of Investments as of December 31, 2008
|
89-100
|
|
Footnote
to Consolidated Schedule of Investments
|
101-104
|
|
Notes
to Consolidated Financial Statements
|
105-123
|
|
Financial
Highlights for the years ended December 31, 2009,
|
|
|
2008,
and 2007
|
124
|
|
|
•
|
pertain
to the maintenance of records that in reasonable detail accurately and
fairly reflect the transactions and dispositions of the assets of the
Company;
|
|
|
•
|
provide
reasonable assurance that transactions are recorded as necessary to permit
preparation of financial statements in accordance with generally accepted
accounting principles, and that receipts and expenditures of the company
are being made only in accordance with authorizations of management and
directors of the Company; and
|
|
|
•
|
provide
reasonable assurance regarding prevention or timely detection of
unauthorized acquisition, use or disposition of the Company's assets that
could have a material effect on the financial
statements.
|
|
HARRIS
& HARRIS GROUP, INC.
CONSOLIDATED
STATEMENTS OF ASSETS AND
LIABILITIES
|
|
December 31, 2009
|
December 31, 2008
|
|||||||
|
ASSETS
|
||||||||
|
Investments,
in portfolio securities at value:
|
||||||||
|
Unaffiliated
privately held companies
|
||||||||
|
(cost:
$26,977,200 and $24,208,281, respectively)
|
$ | 21,656,436 | $ | 12,086,503 | ||||
|
Unaffiliated
publicly traded securities
|
||||||||
|
(cost:
$298,827 and $0, respectively)
|
226,395 | 0 | ||||||
|
Non-controlled
affiliated privately held companies
|
||||||||
|
(cost:
$54,864,948 and $60,796,720, respectively)
|
50,297,220 | 39,650,187 | ||||||
|
Controlled
affiliated privately held companies (cost: $10,248,932
|
||||||||
|
and
$6,085,000, respectively)
|
5,843,430 | 5,228,463 | ||||||
|
Total,
investments in private portfolio companies and
|
||||||||
|
public
securities at value
|
||||||||
|
(cost:
$92,389,907 and $91,090,001, respectively)
|
$ | 78,023,481 | $ | 56,965,153 | ||||
|
Investments,
in U.S. Treasury obligations at value
|
||||||||
|
(cost:
$55,960,024 and $52,956,288, respectively)
|
55,947,581 | 52,983,940 | ||||||
|
Cash
|
1,611,465 | 636,333 | ||||||
|
Restricted
funds (Note 7)
|
2,000 | 191,955 | ||||||
|
Receivable
from portfolio company
|
28,247 | 0 | ||||||
|
Interest
receivable
|
25,832 | 56 | ||||||
|
Prepaid
expenses
|
94,129 | 484,567 | ||||||
|
Other
assets
|
376,366 | 365,597 | ||||||
|
Total
assets
|
$ | 136,109,101 | $ | 111,627,601 | ||||
|
LIABILITIES & NET
ASSETS
|
||||||||
|
Post
retirement plan liabilities (Note 7)
|
$ | 1,369,843 | $ | 1,399,048 | ||||
|
Accounts
payable and accrued liabilities
|
579,162 | 689,300 | ||||||
|
Deferred
rent
|
1,838 | 8,140 | ||||||
|
Total
liabilities
|
1,950,843 | 2,096,488 | ||||||
|
Net
assets
|
$ | 134,158,258 | $ | 109,531,113 | ||||
|
Net
assets are comprised of:
|
||||||||
|
Preferred
stock, $0.10 par value,
|
||||||||
|
2,000,000
shares authorized; none issued
|
$ | 0 | $ | 0 | ||||
|
Common
stock, $0.01 par value, 45,000,000 shares authorized at
|
||||||||
|
12/31/09
and 12/31/08; 32,688,333 issued at
|
||||||||
|
12/31/09
and 27,688,313 issued at 12/31/08
|
326,884 | 276,884 | ||||||
|
Additional
paid in capital (Note 10)
|
205,977,117 | 181,251,507 | ||||||
|
Accumulated
net operating and realized loss
|
(54,361,343 | ) | (34,494,551 | ) | ||||
|
Accumulated
unrealized depreciation of investments
|
(14,378,869 | ) | (34,097,196 | ) | ||||
|
Treasury
stock, at cost (1,828,740 shares at 12/31/09 and
|
||||||||
|
12/31/08)
|
(3,405,531 | ) | (3,405,531 | ) | ||||
|
Net
assets
|
$ | 134,158,258 | $ | 109,531,113 | ||||
|
Shares
outstanding
|
30,859,593 | 25,859,573 | ||||||
|
Net
asset value per outstanding share
|
$ | 4.35 | $ | 4.24 | ||||
|
HARRIS
& HARRIS GROUP, INC.
CONSOLIDATED
STATEMENTS OF OPERATIONS
|
|
Year Ended
|
Year Ended
|
Year Ended
|
||||||||||
|
December 31, 2009
|
December 31, 2008
|
December 31, 2007
|
||||||||||
|
Investment
income:
|
||||||||||||
|
Interest
from:
|
||||||||||||
|
Fixed-income
securities and bridge notes
|
$ | 214,760 | $ | 1,971,178 | $ | 2,705,597 | ||||||
|
Miscellaneous
income
|
33,088 | 16,169 | 39 | |||||||||
|
Total
investment income
|
247,848 | 1,987,347 | 2,705,636 | |||||||||
|
Expenses:
|
||||||||||||
|
Salaries,
benefits and stock-based
|
||||||||||||
|
compensation
(Note 5)
|
6,327,467 | 10,090,658 | 11,435,329 | |||||||||
|
Administration
and operations
|
1,125,266 | 1,160,025 | 1,432,653 | |||||||||
|
Professional
fees
|
767,077 | 694,007 | 902,911 | |||||||||
|
Rent
|
316,604 | 276,023 | 235,998 | |||||||||
|
Directors'
fees and expenses
|
338,227 | 367,383 | 435,060 | |||||||||
|
Depreciation
|
50,965 | 54,795 | 63,113 | |||||||||
|
Custody
fees
|
83,457 | 31,607 | 28,115 | |||||||||
|
Total
expenses
|
9,009,063 | 12,674,498 | 14,533,179 | |||||||||
|
Net
operating loss
|
(8,761,215 | ) | (10,687,151 | ) | (11,827,543 | ) | ||||||
|
Net
realized (loss) gain from investments:
|
||||||||||||
|
Realized
(loss) gain from:
|
||||||||||||
|
Unaffiliated
companies
|
(2,264,330 | ) | 3,588 | 119,082 | ||||||||
|
Non-controlled
affiliated companies
|
(8,841,675 | ) | (6,509,404 | ) | 0 | |||||||
|
Controlled
affiliated companies
|
0 | (2,893,487 | ) | 0 | ||||||||
|
U.S.
Treasury obligations/other
|
(325 | ) | 1,109,790 | (945 | ) | |||||||
|
Realized
(loss) gain from investments
|
(11,106,330 | ) | (8,289,513 | ) | 118,137 | |||||||
|
Income
tax (benefit) expense (Note 8)
|
(753 | ) | 34,121 | 87,975 | ||||||||
|
Net
realized (loss) gain from investments
|
(11,105,577 | ) | (8,323,634 | ) | 30,162 | |||||||
|
Net
decrease (increase) in unrealized
|
||||||||||||
|
depreciation
on investments:
|
||||||||||||
|
Change
as a result of investment sales
|
11,090,579 | 8,292,072 | 0 | |||||||||
|
Change
on investments held
|
8,627,748 | (38,462,784 | ) | 5,080,936 | ||||||||
|
Net
decrease (increase) in unrealized
|
||||||||||||
|
depreciation
on investments
|
19,718,327 | (30,170,712 | ) | 5,080,936 | ||||||||
|
Net
decrease in net assets resulting
|
||||||||||||
|
from
operations
|
$ | (148,465 | ) | $ | (49,181,497 | ) | $ | (6,716,445 | ) | |||
|
Per
average basic and diluted outstanding share
|
$ | (0.01 | ) | $ | (1.99 | ) | $ | (0.30 | ) | |||
|
Average
outstanding shares
|
27,025,995 | 24,670,516 | 22,393,030 | |||||||||
|
HARRIS
& HARRIS GROUP, INC.
CONSOLIDATED
STATEMENTS OF CASH FLOWS
|
|
Year Ended
|
Year Ended
|
Year Ended
|
||||||||||
|
December 31, 2009
|
December 31, 2008
|
December 31, 2007
|
||||||||||
|
Cash
flows (used in) provided by operating activities:
|
||||||||||||
|
Net
decrease in net assets resulting from operations
|
$ | (148,465 | ) | $ | (49,181,497 | ) | $ | (6,716,445 | ) | |||
|
Adjustments
to reconcile net decrease in net assets
|
||||||||||||
|
resulting
from operations to net cash used in
|
||||||||||||
|
operating
activities:
|
||||||||||||
|
Net
realized and unrealized loss (gain) on investments
|
(8,611,997 | ) | 38,460,225 | (5,199,073 | ) | |||||||
|
Depreciation
of fixed assets, amortization of premium
|
||||||||||||
|
or
discount on U.S. government securities, and
|
||||||||||||
|
bridge
note interest
|
12,363 | (179,809 | ) | (60,009 | ) | |||||||
|
Stock-based
compensation expense
|
3,089,520 | 5,965,769 | 8,050,807 | |||||||||
|
Changes
in assets and liabilities:
|
||||||||||||
|
Restricted
funds
|
189,955 | 2,475,065 | (517,235 | ) | ||||||||
|
Receivable
from portfolio company
|
(28,247 | ) | 524 | (524 | ) | |||||||
|
Interest
receivable
|
35,365 | 621,856 | (21,965 | ) | ||||||||
|
Prepaid
expenses
|
390,438 | 4,100 | (477,722 | ) | ||||||||
|
Other
receivables
|
(7,454 | ) | 0 | 819,905 | ||||||||
|
Other
assets
|
(52,965 | ) | 88,936 | (152,012 | ) | |||||||
|
Post
retirement plan liabilities
|
(29,205 | ) | 102,210 | 124,171 | ||||||||
|
Accounts
payable and accrued liabilities
|
(110,138 | ) | (2,529,325 | ) | 275,992 | |||||||
|
Accrued
profit sharing
|
0 | 0 | (261,661 | ) | ||||||||
|
Deferred
rent
|
(6,302 | ) | (6,385 | ) | (6,801 | ) | ||||||
|
Net
cash used in operating activities
|
(5,277,132 | ) | (4,178,331 | ) | (4,142,572 | ) | ||||||
|
Cash
flows from investing activities:
|
||||||||||||
|
Purchase
of U.S. government securities
|
(208,875,156 | ) | (133,032,933 | ) | (60,744,292 | ) | ||||||
|
Sale
of U.S. government securities
|
205,769,329 | 140,831,769 | 60,508,538 | |||||||||
|
Investment
in venture capital investments
|
(12,334,051 | ) | (17,779,462 | ) | (20,595,161 | ) | ||||||
|
Proceeds
from sale of investments
|
7,365 | 136,837 | 174,669 | |||||||||
|
Purchase
of fixed assets
|
(1,313 | ) | (21,969 | ) | (41,640 | ) | ||||||
|
Net
cash used in investing activities
|
(15,433,826 | ) | (9,865,758 | ) | (20,697,886 | ) | ||||||
|
Cash
flows from financing activities:
|
||||||||||||
|
Gross
proceeds from public offering (Note 10)
|
23,215,625 | 15,651,750 | 14,027,000 | |||||||||
|
Gross
expenses for public offering (Note 10)
|
(1,951,485 | ) | (1,268,253 | ) | (1,033,832 | ) | ||||||
|
Proceeds
from stock option exercises (Note 5)
|
421,950 | 0 | 10,105,511 | |||||||||
|
Net
cash provided by financing activities
|
21,686,090 | 14,383,497 | 23,098,679 | |||||||||
|
Net
increase (decrease) in cash:
|
||||||||||||
|
Cash
at beginning of the year
|
636,333 | 296,925 | 2,038,704 | |||||||||
|
Cash
at end of the year
|
1,611,465 | 636,333 | 296,925 | |||||||||
|
Net
increase (decrease) in cash
|
$ | 975,132 | $ | 339,408 | $ | (1,741,779 | ) | |||||
|
Supplemental
disclosures of cash flow information:
|
||||||||||||
|
Income
taxes paid
|
$ | 2,179 | $ | 45,765 | $ | 80,236 | ||||||
|
HARRIS
& HARRIS GROUP, INC.
CONSOLIDATED
STATEMENTS OF CHANGES IN NET
ASSETS
|
|
Year Ended
|
Year Ended
|
Year Ended
|
||||||||||
|
December 31, 2009
|
December 31, 2008
|
December 31, 2007
|
||||||||||
|
Changes
in net assets from operations:
|
||||||||||||
|
Net
operating loss
|
$ | (8,761,215 | ) | $ | (10,687,151 | ) | $ | (11,827,543 | ) | |||
|
Net
realized (loss) gain on investments
|
(11,105,577 | ) | (8,323,634 | ) | 30,162 | |||||||
|
Net
decrease in unrealized depreciation
|
||||||||||||
|
on
investments as a result of sales
|
11,090,579 | 8,292,072 | 0 | |||||||||
|
Net
decrease (increase) in unrealized
|
||||||||||||
|
depreciation
on investments held
|
8,627,748 | (38,462,784 | ) | 5,080,936 | ||||||||
|
Net
decrease in net assets resulting
|
||||||||||||
|
from
operations
|
(148,465 | ) | (49,181,497 | ) | (6,716,445 | ) | ||||||
|
Changes
in net assets from
|
||||||||||||
|
capital
stock transactions:
|
||||||||||||
|
Issuance
of common stock upon the
|
||||||||||||
|
exercise
of stock options
|
1,125 | 0 | 9,996 | |||||||||
|
Issuance
of common stock on offering
|
48,875 | 25,450 | 13,000 | |||||||||
|
Additional
paid in capital on common
|
||||||||||||
|
stock
issued
|
21,636,090 | 14,358,047 | 23,075,683 | |||||||||
|
Stock-based
compensation expense
|
3,089,520 | 5,965,769 | 8,050,807 | |||||||||
|
Net
increase in net assets resulting
|
||||||||||||
|
from
capital stock transactions
|
24,775,610 | 20,349,266 | 31,149,486 | |||||||||
|
Net
increase (decrease) in net assets
|
24,627,145 | (28,832,231 | ) | 24,433,041 | ||||||||
|
Net
Assets:
|
||||||||||||
|
Beginning
of the year
|
109,531,113 | 138,363,344 | 113,930,303 | |||||||||
|
End
of the year
|
$ | 134,158,258 | $ | 109,531,113 | $ | 138,363,344 | ||||||
|
HARRIS
& HARRIS GROUP, INC.
CONSOLIDATED
SCHEDULE OF INVESTMENTS AS OF DECEMBER 31,
2009
|
|
Method
of
|
Shares/
|
||||||||
|
Valuation (1)
|
Principal
|
Value
|
|||||||
|
Investments
in Unaffiliated Companies (2)(3)(4) – 16.3% of
|
|||||||||
|
net
assets at value
|
|||||||||
|
Private
Placement Portfolio (Illiquid) – 16.1% of net assets
|
|||||||||
|
at
value
|
|||||||||
|
BioVex
Group, Inc. (5)(6)(7)(8) — Developing novel biologics
|
|||||||||
|
for
treatment of cancer and infectious disease
|
|||||||||
|
Series
E Convertible Preferred Stock
|
(M)
|
2,799,552 | $ | 1,042,862 | |||||
|
Series
G Convertible Preferred Stock
|
(M)
|
3,738,004 | 627,985 | ||||||
|
Warrants
at $0.21 expiring 11/5/16
|
( I
)
|
285,427 | 20,836 | ||||||
| 1,691,683 | |||||||||
|
Cobalt
Technologies, Inc. (5)(6)(7)(9) — Developing processes for
|
|||||||||
|
making
biobutanol through biomass fermentation
|
|||||||||
|
Series
C Convertible Preferred Stock
|
(M)
|
352,112 | 375,000 | ||||||
|
D-Wave
Systems, Inc. (5)(6)(7)(10) — Developing high-
|
|||||||||
|
performance
quantum computing systems
|
|||||||||
|
Series
B Convertible Preferred Stock
|
(M)
|
1,144,869 | 907,612 | ||||||
|
Series
C Convertible Preferred Stock
|
(M)
|
450,450 | 357,101 | ||||||
|
Series
D Convertible Preferred Stock
|
(M)
|
1,533,395 | 1,215,622 | ||||||
| 2,480,335 | |||||||||
|
Molecular
Imprints, Inc. (5)(6) — Manufacturing nanoimprint
|
|||||||||
|
lithography
capital equipment
|
|||||||||
|
Series
B Convertible Preferred Stock
|
(M)
|
1,333,333 | 2,999,999 | ||||||
|
Series
C Convertible Preferred Stock
|
(M)
|
1,250,000 | 2,812,500 | ||||||
|
Warrants
at $2.00 expiring 12/31/11
|
( I
)
|
125,000 | 163,625 | ||||||
| 5,976,124 | |||||||||
|
Nanosys,
Inc. (5)(6) — Developing zero and one-dimensional
|
|||||||||
|
inorganic
nanometer-scale materials and devices
|
|||||||||
|
Series
C Convertible Preferred Stock
|
(M)
|
803,428 | 1,185,056 | ||||||
|
Series
D Convertible Preferred Stock
|
(M)
|
1,016,950 | 1,500,001 | ||||||
| 2,685,057 | |||||||||
|
HARRIS
& HARRIS GROUP, INC.
CONSOLIDATED SCHEDULE OF
INVESTMENTS AS OF DECEMBER 31,
2009
|
|
Method
of
|
Shares/
|
||||||||
|
Valuation (1)
|
Principal
|
Value
|
|||||||
|
Investments
in Unaffiliated Companies (2)(3)(4) – 16.3% of
|
|||||||||
|
net
assets at value (Cont.)
|
|||||||||
|
Private
Placement Portfolio (Illiquid) – 16.1% of net assets
|
|||||||||
|
at
value (Cont.)
|
|||||||||
|
Nantero,
Inc. (5)(6)(7) — Developing a high-density, nonvolatile,
|
|||||||||
|
random
access memory chip, enabled by carbon nanotubes
|
|||||||||
|
Series
A Convertible Preferred Stock
|
(M)
|
345,070 | $ | 1,046,908 | |||||
|
Series
B Convertible Preferred Stock
|
(M)
|
207,051 | 628,172 | ||||||
|
Series
C Convertible Preferred Stock
|
(M)
|
188,315 | 571,329 | ||||||
| 2,246,409 | |||||||||
|
NeoPhotonics
Corporation (5)(6)(11) — Developing and manufacturing
|
|||||||||
|
optical
devices and components
|
|||||||||
|
Common
Stock
|
(M)
|
1,100,013 | 739,209 | ||||||
|
Series
1 Convertible Preferred Stock
|
(M)
|
1,831,256 | 1,230,604 | ||||||
|
Series
2 Convertible Preferred Stock
|
(M)
|
741,898 | 498,555 | ||||||
|
Series
3 Convertible Preferred Stock
|
(M)
|
2,750,000 | 1,848,000 | ||||||
|
Series
X Convertible Preferred Stock
|
(M)
|
8,923 | 1,427,680 | ||||||
|
Warrants
at $0.15 expiring 01/26/10
|
( I
)
|
16,364 | 11,291 | ||||||
|
Warrants
at $0.15 expiring 12/05/10
|
( I
)
|
14,063 | 9,703 | ||||||
| 5,765,042 | |||||||||
|
Polatis,
Inc. (5)(6)(7) — Developing MEMS-based optical
|
|||||||||
|
networking
components
|
|||||||||
|
Series
A-1 Convertible Preferred Stock
|
(M)
|
16,775 | 0 | ||||||
|
Series
A-2 Convertible Preferred Stock
|
(M)
|
71,611 | 0 | ||||||
|
Series
A-4 Convertible Preferred Stock
|
(M)
|
4,774 | 0 | ||||||
|
Series
A-5 Convertible Preferred Stock
|
(M)
|
16,438 | 0 | ||||||
| 0 | |||||||||
|
PolyRemedy,
Inc. (5)(6)(7) — Developing a robotic
|
|||||||||
|
manufacturing
platform for wound treatment patches
|
|||||||||
|
Series
B-1 Convertible Preferred Stock
|
(M)
|
287,647 | 46,933 | ||||||
|
Series
B-2 Convertible Preferred Stock
|
(M)
|
676,147 | 60,853 | ||||||
| 107,786 | |||||||||
|
HARRIS
& HARRIS GROUP, INC.
CONSOLIDATED SCHEDULE OF
INVESTMENTS AS OF DECEMBER 31,
2009
|
|
Method
of
|
Shares/
|
||||||||
|
Valuation (1)
|
Principal
|
Value
|
|||||||
|
Investments
in Unaffiliated Companies (2)(3)(4) – 16.3% of
|
|||||||||
|
net
assets at value (Cont.)
|
|||||||||
|
Private
Placement Portfolio (Illiquid) – 16.1% of net assets
|
|||||||||
|
at
value (Cont.)
|
|||||||||
|
Siluria
Technologies, Inc. (5)(6)(7) — Developing next-generation
|
|||||||||
|
nanomaterials
|
|||||||||
|
Series
S-2 Convertible Preferred Stock
|
(M)
|
612,061 | $ | 204,000 | |||||
|
TetraVitae
Bioscience, Inc. (5)(6)(7)(12) — Developing methods
|
|||||||||
|
of
producing alternative chemicals and fuels through biomass
|
|||||||||
|
fermentation
|
|||||||||
|
Series
B Convertible Preferred Stock
|
(M)
|
118,804 | 125,000 | ||||||
|
Total
Unaffiliated Private Placement Portfolio (cost:
$26,977,200)
|
$ | 21,656,436 | |||||||
|
Publicly
Traded Portfolio (Liquid) – 0.2% of net assets
|
|||||||||
|
at
value
|
|||||||||
|
Orthovita,
Inc. (6)(13) — Developing materials and devices
|
|||||||||
|
for
orthopedic medical implant applications
|
|||||||||
|
Common
Stock
|
(M)
|
64,500 | 226,395 | ||||||
|
Total
Unaffiliated Publicly Traded Portfolio (cost: $298,827)
|
$ | 226,395 | |||||||
|
Total
Investments in Unaffiliated Companies (cost: $27,276,027)
|
$ | 21,882,831 | |||||||
|
HARRIS
& HARRIS GROUP, INC.
CONSOLIDATED
SCHEDULE OF INVESTMENTS AS OF DECEMBER 31,
2009
|
|
Method
of
|
Shares/
|
||||||||
|
Valuation (1)
|
Principal
|
Value
|
|||||||
|
Investments
in Non-Controlled Affiliated Companies (2)(14) –
|
|||||||||
|
37.5%
of net assets at value
|
|||||||||
|
Private Placement
Portfolio (Illiquid) – 37.5% of net
assets
|
|||||||||
|
at
value
|
|||||||||
|
Adesto
Technologies Corporation (5)(6)(7) — Developing low-power,
|
|||||||||
|
high-performance
memory devices
|
|||||||||
|
Series
A Convertible Preferred Stock
|
(M)
|
6,547,619 | $ | 2,420,000 | |||||
|
Series
B Convertible Preferred Stock
|
(M)
|
5,952,381 | 2,200,000 | ||||||
| 4,620,000 | |||||||||
|
BridgeLux,
Inc. (5)(6) — Manufacturing high-power light
|
|||||||||
|
emitting
diodes (LEDs) and arrays
|
|||||||||
|
Series
B Convertible Preferred Stock
|
(M)
|
1,861,504 | 1,804,914 | ||||||
|
Series
C Convertible Preferred Stock
|
(M)
|
2,130,699 | 2,065,926 | ||||||
|
Series
D Convertible Preferred Stock
|
(M)
|
833,333 | 807,999 | ||||||
|
Warrants
at $0.7136 expiring 12/31/14
|
( I
)
|
163,900 | 98,995 | ||||||
|
Warrants
at $1.50 expiring 8/26/14
|
( I
)
|
124,999 | 55,375 | ||||||
| 4,833,209 | |||||||||
|
Cambrios
Technologies Corporation (5)(6)(7) — Developing
|
|||||||||
|
nanowire-enabled
electronic materials for the display industry
|
|||||||||
|
Series
B Convertible Preferred Stock
|
(M)
|
1,294,025 | 647,013 | ||||||
|
Series
C Convertible Preferred Stock
|
(M)
|
1,300,000 | 650,000 | ||||||
|
Series
D Convertible Preferred Stock
|
(M)
|
515,756 | 257,878 | ||||||
| 1,554,891 | |||||||||
|
CFX
Battery, Inc. (5)(6)(7)(15) — Developing batteries using
|
|||||||||
|
nanostructured
materials
|
|||||||||
|
Series
A Convertible Preferred Stock
|
(M)
|
2,565,798 | 2,822,378 | ||||||
|
Series
B Convertible Preferred Stock
|
(M)
|
812,500 | 1,300,000 | ||||||
| 4,122,378 | |||||||||
|
Crystal
IS, Inc. (5)(6) — Developing single-crystal
|
|||||||||
|
aluminum
nitride substrates for light-emitting diodes
|
|||||||||
|
Common
Stock
|
(M)
|
2,585,657 | 0 | ||||||
|
Warrants
at $0.78 expiring 05/05/13
|
( I
)
|
15,231 | 0 | ||||||
|
Warrants
at $0.78 expiring 05/12/13
|
( I
)
|
2,350 | 0 | ||||||
|
Warrants
at $0.78 expiring 08/08/13
|
( I
)
|
4,396 | 0 | ||||||
| 0 | |||||||||
|
HARRIS
& HARRIS GROUP, INC.
CONSOLIDATED
SCHEDULE OF INVESTMENTS AS OF DECEMBER 31,
2009
|
|
Method
of
|
Shares/
|
||||||||
|
Valuation (1)
|
Principal
|
Value
|
|||||||
|
Investments
in Non-Controlled Affiliated Companies (2)(14) –
|
|||||||||
|
37.5%
of net assets at value (Cont.)
|
|||||||||
|
Private Placement
Portfolio (Illiquid) – 37.5% of net
assets
|
|||||||||
|
at
value (Cont.)
|
|||||||||
|
Ensemble
Discovery Corporation (5)(6)(16) — Developing DNA-
|
|||||||||
|
Programmed
ChemistryTM
for the discovery of new classes of
|
|||||||||
|
therapeutics
and bioassays
|
|||||||||
|
Series
B Convertible Preferred Stock
|
(M)
|
1,449,275 | $ | 1,500,000 | |||||
|
Unsecured
Convertible Bridge Note (including interest)
|
(M)
|
$ | 299,169 | 325,506 | |||||
| 1,825,506 | |||||||||
|
Enumeral
Technologies, Inc. (5)(6)(7)(13) — Developing high-value
|
|||||||||
|
opportunities
in immunology including therapeutic discovery,
|
|||||||||
|
immune
profiling and personalized medicine
|
|||||||||
|
Unsecured
Convertible Bridge Note (including interest)
|
(M)
|
$ | 250,000 | 250,438 | |||||
|
Innovalight,
Inc. (5)(6)(7) — Developing solar power
|
|||||||||
|
products
enabled by silicon-based nanomaterials
|
|||||||||
|
Series
B Convertible Preferred Stock
|
(M)
|
16,666,666 | 2,969,667 | ||||||
|
Series
C Convertible Preferred Stock
|
(M)
|
5,810,577 | 1,276,457 | ||||||
|
Series
D Convertible Preferred Stock
|
(M)
|
4,046,974 | 721,090 | ||||||
| 4,967,214 | |||||||||
|
Kovio,
Inc. (5)(6) — Developing semiconductor products
|
|||||||||
|
using
printed electronics and thin-film technologies
|
|||||||||
|
Series
C Convertible Preferred Stock
|
(M)
|
2,500,000 | 609,943 | ||||||
|
Series
D Convertible Preferred Stock
|
(M)
|
800,000 | 195,182 | ||||||
|
Series
E Convertible Preferred Stock
|
(M)
|
1,200,000 | 1,500,000 | ||||||
|
Warrants
at $1.25 expiring 12/31/12
|
( I
)
|
355,880 | 291,466 | ||||||
| 2,596,591 | |||||||||
|
Mersana
Therapeutics, Inc. (5)(6)(7) — Developing treatments for
|
|||||||||
|
cancer
based on novel drug delivery polymers
|
|||||||||
|
Series
A Convertible Preferred Stock
|
(M)
|
68,451 | 68,451 | ||||||
|
Series
B Convertible Preferred Stock
|
(M)
|
866,500 | 866,500 | ||||||
|
Unsecured
Convertible Bridge Note (including interest)
|
(M)
|
$ | 650,000 | 708,165 | |||||
|
Warrants
at $2.00 expiring 10/21/10
|
( I
)
|
91,625 | 16,218 | ||||||
| 1,659,334 | |||||||||
|
HARRIS
& HARRIS GROUP, INC.
CONSOLIDATED
SCHEDULE OF INVESTMENTS AS OF DECEMBER 31,
2009
|
|
Method
of
|
Shares/
|
||||||||
|
Valuation (1)
|
Principal
|
Value
|
|||||||
|
Investments
in Non-Controlled Affiliated Companies (2)(14) –
|
|||||||||
|
37.5%
of net assets at value (Cont.)
|
|||||||||
|
Private Placement
Portfolio (Illiquid) – 37.5% of net
assets
|
|||||||||
|
at
value (Cont.)
|
|||||||||
|
Metabolon,
Inc. (5)(6) — Developing service and diagnostic products
|
|||||||||
|
through
the use of a metabolomics, or biochemical, profiling
platform
|
|||||||||
|
Series
B Convertible Preferred Stock
|
(M)
|
371,739 | $ | 1,034,061 | |||||
|
Series
B-1 Convertible Preferred Stock
|
(M)
|
148,696 | 413,625 | ||||||
|
Series
C Convertible Preferred Stock
|
(M)
|
1,000,000 | 1,000,000 | ||||||
|
Warrants
at $1.15 expiring 3/25/15
|
( I
)
|
74,348 | 112,092 | ||||||
| 2,559,778 | |||||||||
|
NanoGram
Corporation (5)(6) — Developing solar power products
|
|||||||||
|
enabled
by silicon-based nanomaterials
|
|||||||||
|
Series
I Convertible Preferred Stock
|
(M)
|
63,210 | 0 | ||||||
|
Series
II Convertible Preferred Stock
|
(M)
|
1,250,904 | 0 | ||||||
|
Series
III Convertible Preferred Stock
|
(M)
|
1,242,144 | 0 | ||||||
|
Series
IV Convertible Preferred Stock
|
(M)
|
432,179 | 0 | ||||||
| 0 | |||||||||
|
Nextreme
Thermal Solutions, Inc. (5)(6) — Developing thin-film
|
|||||||||
|
thermoelectric
devices for cooling and energy conversion
|
|||||||||
|
Series
A Convertible Preferred Stock
|
(M)
|
17,500 | 1,750,000 | ||||||
|
Series
B Convertible Preferred Stock
|
(M)
|
4,870,244 | 2,655,257 | ||||||
| 4,405,257 | |||||||||
|
Questech
Corporation (5)(6) — Manufacturing and marketing
|
|||||||||
|
proprietary
metal and stone decorative tiles
|
|||||||||
|
Common
Stock
|
(M)
|
655,454 | 425,390 | ||||||
|
Solazyme,
Inc. (5)(6)(7) — Developing algal biodiesel, industrial
|
|||||||||
|
chemicals
and special ingredients based on synthetic biology
|
|||||||||
|
Series
A Convertible Preferred Stock
|
(M)
|
988,204 | 4,978,157 | ||||||
|
Series
B Convertible Preferred Stock
|
(M)
|
495,246 | 2,494,841 | ||||||
|
Series
C Convertible Preferred Stock
|
(M)
|
651,309 | 3,281,021 | ||||||
| 10,754,019 | |||||||||
|
HARRIS
& HARRIS GROUP, INC.
CONSOLIDATED
SCHEDULE OF INVESTMENTS AS OF DECEMBER 31,
2009
|
|
Method
of
|
Shares/
|
||||||||
|
Valuation (1)
|
Principal
|
Value
|
|||||||
|
Investments
in Non-Controlled Affiliated Companies (2)(14) –
|
|||||||||
|
37.5%
of net assets at value (Cont.)
|
|||||||||
|
Private Placement
Portfolio (Illiquid) – 37.5% of net
assets
|
|||||||||
|
at
value (Cont.)
|
|||||||||
|
Xradia,
Inc. (5)(6) — Designing, manufacturing and selling
ultra-high
|
|||||||||
|
resolution
3D x-ray microscopes and fluorescence imaging systems
|
|||||||||
|
Series
D Convertible Preferred Stock
|
(M)
|
3,121,099 | $ | 5,723,215 | |||||
|
Total
Non-Controlled Private Placement Portfolio (cost:
$54,864,948)
|
$ | 50,297,220 | |||||||
|
Total
Investments in Non-Controlled Affiliated Companies (cost:
$54,864,948)
|
$ | 50,297,220 | |||||||
|
HARRIS
& HARRIS GROUP, INC.
CONSOLIDATED
SCHEDULE OF INVESTMENTS AS OF DECEMBER 31,
2009
|
|
Method
of
|
Shares/
|
||||||||
|
Valuation (1)
|
Principal
|
Value
|
|||||||
|
Investments
in Controlled Affiliated Companies (2)(17) –
|
|||||||||
|
4.40%
of net assets at value
|
|||||||||
|
Private Placement
Portfolio (Illiquid) – 4.40%
of
|
|||||||||
|
net
assets at value
|
|||||||||
|
Ancora
Pharmaceuticals Inc. (5)(6)(7) — Developing synthetic
|
|||||||||
|
carbohydrates
for pharmaceutical applications
|
|||||||||
|
Series
B Convertible Preferred Stock
|
(M)
|
1,663,808 | $ | 17,374 | |||||
|
Series
C Convertible Preferred Stock
|
(M)
|
2,066,051 | 1,239,632 | ||||||
| 1,257,006 | |||||||||
|
Laser
Light Engines, Inc. (5)(6)(7) — Manufacturing solid-state
light
|
|||||||||
|
sources
for digital cinema and large-venue projection displays
|
|||||||||
|
Series
A Convertible Preferred Stock
|
(M)
|
7,499,062 | 1,000,000 | ||||||
|
Secured
Convertible Bridge Note (including interest)
|
(M)
|
$ | 1,390,000 | 1,434,116 | |||||
| 2,434,116 | |||||||||
|
SiOnyx,
Inc. (5)(6)(7) — Developing silicon-based optoelectronic
|
|||||||||
|
products
enabled by its proprietary "Black Silicon"
|
|||||||||
|
Series
A Convertible Preferred Stock
|
(M)
|
233,499 | 67,843 | ||||||
|
Series
A-1 Convertible Preferred Stock
|
(M)
|
2,966,667 | 861,965 | ||||||
|
Series
A-2 Convertible Preferred Stock
|
(M)
|
4,207,537 | 1,222,500 | ||||||
| 2,152,308 | |||||||||
|
Total
Controlled Private Placement Portfolio (cost: $10,248,932)
|
$ | 5,843,430 | |||||||
|
Total
Investments in Controlled Affiliated Companies (cost:
$10,248,932)
|
$ | 5,843,430 | |||||||
|
Total
Private Placement and Publicly Traded Portfolio (cost:
$92,389,907)
|
$ | 78,023,481 | |||||||
|
HARRIS
& HARRIS GROUP, INC.
CONSOLIDATED
SCHEDULE OF INVESTMENTS AS OF DECEMBER 31,
2009
|
|
Method
of
|
Shares/
|
|||||||||
|
Valuation (1)
|
Principal
|
Value
|
||||||||
|
U.S.
Government Securities (18) – 41.7% of net assets at value
|
||||||||||
|
U.S.
Treasury Bill
|
—
due date 04/22/10
|
(M)
|
$ | 10,000,000 | $ | 9,997,600 | ||||
|
U.S.
Treasury Bill
|
—
due date 06/17/10
|
(M)
|
42,175,000 | 42,139,151 | ||||||
|
U.S.
Treasury Notes
|
—
due date 02/28/10, coupon 2.000%
|
(M)
|
3,800,000 | 3,810,830 | ||||||
|
Total
Investments in U.S. Government Securities (cost:
$55,960,024)
|
$ | 55,947,581 | ||||||||
|
Total
Investments (cost: $148,349,931)
|
$ | 133,971,062 | ||||||||
|
HARRIS
& HARRIS GROUP, INC.
CONSOLIDATED
SCHEDULE OF INVESTMENTS AS OF DECEMBER 31,
2009
|
|
(1)
|
See
Footnote to Consolidated Schedule of Investments on page 101 for a
description of the Valuation
Procedures.
|
|
(2)
|
Investments
in unaffiliated companies consist of investments in which we own less than
five percent of the voting shares of the portfolio company or less than
five percent of the common shares of the publicly traded
company. Investments in non-controlled affiliated companies
consist of investments in which we own five percent or more, but less than
25 percent, of the voting shares of the portfolio company, or where we
hold one or more seats on the portfolio company’s Board of Directors but
do not control the company. Investments in controlled
affiliated companies consist of investments in which we own 25 percent or
more of the voting shares of the portfolio company or otherwise control
the company.
|
|
(3)
|
The
aggregate cost for federal income tax purposes of investments in
unaffiliated private companies is $26,977,200. The gross
unrealized appreciation based on the tax cost for these securities is
$2,338,205. The gross unrealized depreciation based on the tax cost for
these securities is $7,658,969.
|
|
(4)
|
The
aggregate cost for federal income tax purposes of investments in
unaffiliated publicly traded companies is $298,827. The gross
unrealized appreciation based on the tax cost for these securities is
$0. The gross unrealized depreciation based on the tax cost for
these securities is $72,432.
|
|
(5)
|
Legal
restrictions on sale of investment.
|
|
(6)
|
Represents
a non-income producing security. Equity investments that have
not paid dividends within the last 12 months are considered to be
non-income producing.
|
|
(7)
|
These
investments are development-stage companies. A
development-stage company is defined as a company that is devoting
substantially all of its efforts to establishing a new business, and
either it has not yet commenced its planned principal operations, or it
has commenced such operations but has not realized significant revenue
from them.
|
|
(8)
|
With
our purchase of Series E Convertible Preferred Stock of BioVex, we
received a warrant to purchase a number of shares of common stock of
BioVex as determined by dividing 624,999.99 by the price per share at
which the common stock is offered and sold to the public in connection
with the IPO. The ability to exercise this warrant is therefore
contingent on BioVex completing successfully an IPO before the expiration
date of the warrant on September 27, 2012. The exercise price
of this warrant shall be 110 percent of the IPO
price.
|
|
(9)
|
Cobalt
Technologies, Inc., does business as Cobalt
Biofuels.
|
|
HARRIS
& HARRIS GROUP, INC.
CONSOLIDATED
SCHEDULE OF INVESTMENTS AS OF DECEMBER 31,
2009
|
|
(10)
|
D-Wave
Systems, Inc., is located and is doing business primarily in
Canada. We invested in D-Wave Systems, Inc., through
D-Wave USA, a Delaware company. Our investment is denominated
in Canadian dollars and is subject to foreign currency
translation. See "Note 2. Summary of Significant Accounting
Policies."
|
|
(11)
|
We
exercised NeoPhotonics Corporation warrants in January and February
2010. See "Note 12. "Subsequent
Events."
|
|
(12)
|
With
our purchase of the Series B Convertible Preferred Stock of TetraVitae
Bioscience, Inc., we received the right to purchase, at a price of
$2.63038528 per share, a number of shares in the Series C financing equal
to the number of shares of Series B Preferred Stock purchased. The
ability to exercise this right is contingent on TetraVitae Bioscience
completing successfully a subsequent round of
financing.
|
|
(13)
|
Initial
investment was made during 2009.
|
|
(14)
|
The
aggregate cost for federal income tax purposes of investments in
non-controlled affiliated companies is $54,864,948. The gross
unrealized appreciation based on the tax cost for these securities is
$10,648,525. The gross unrealized depreciation based on the tax
cost for these securities is
$15,216,253.
|
|
(15)
|
On February 28, 2008,
Lifco, Inc., merged with CFX Battery, Inc. The surviving entity
is CFX Battery,
Inc.
|
|
(16)
|
With
our investment in a convertible bridge note issued by Ensemble Discovery,
we received a warrant to purchase a number of shares of the class of stock
sold in the next financing of Ensemble Discovery equal to $149,539.57
divided by the price per share of the class of stock sold in the next
financing of Ensemble Discovery. The ability to exercise this
warrant is, therefore, contingent on Ensemble Discovery completing
successfully a subsequent round of financing. This warrant
shall expire and no longer be exercisable on September 10,
2015. The cost basis of this warrant is
$89.86.
|
|
(17)
|
The
aggregate cost for federal income tax purposes of investments in
controlled affiliated companies is $10,248,932. The gross
unrealized appreciation based on the tax cost for these securities is
$0. The gross unrealized depreciation based on the tax cost for
these securities is $4,405,502.
|
|
(18)
|
The
aggregate cost for federal income tax purposes of our U.S. government
securities is $55,960,024. The gross unrealized appreciation on the tax
cost for these securities is $0. The gross unrealized depreciation on the
tax cost of these securities is
$12,443.
|
|
HARRIS
& HARRIS GROUP, INC.
CONSOLIDATED
SCHEDULE OF INVESTMENTS AS OF DECEMBER 31,
2008
|
|
Method of
|
Shares/
|
||||||||
|
Valuation (1)
|
Principal
|
Value
|
|||||||
|
Investments
in Unaffiliated Companies (2)(3) – 11.0% of net assets at
value
|
|||||||||
|
Private
Placement Portfolio (Illiquid) – 11.0% of net assets at
value
|
|||||||||
|
BioVex
Group, Inc. (4)(5)(6)(7)(8) — Developing novel biologics for treatment of
cancer and infectious disease
|
|||||||||
|
Series
E Convertible Preferred Stock
|
(M)
|
2,799,552 | $ | 60,750 | |||||
|
Unsecured
Convertible Bridge Note (including interest)
|
(M)
|
$ | 200,000 | 203,222 | |||||
| 263,972 | |||||||||
|
Cobalt
Technologies, Inc. (4)(5)(6)(9)(10) — Developing biobutanol through
biomass fermentation
|
|||||||||
|
Series
C Convertible Preferred Stock
|
(M)
|
176,056 | 187,500 | ||||||
|
Exponential
Business Development Company (4)(5) — Venture capital partnership focused
on early-stage companies
|
|||||||||
|
Limited
Partnership Interest
|
(M)
|
1 | 2,219 | ||||||
|
Kereos,
Inc. (4)(5)(6) — Developing emulsion-based imaging
agents and targeted therapeutics to image and treat cancer and
cardiovascular disease
|
|||||||||
|
Common
Stock
|
(M)
|
545,456 | 0 | ||||||
|
Molecular
Imprints, Inc. (4)(5) — Manufacturing nanoimprint lithography capital
equipment
|
|||||||||
|
Series
B Convertible Preferred Stock
|
(M)
|
1,333,333 | 1,083,333 | ||||||
|
Series
C Convertible Preferred Stock
|
(M)
|
1,250,000 | 1,015,625 | ||||||
|
Warrants
at $2.00 expiring 12/31/11
|
( I
)
|
125,000 | 35,625 | ||||||
| 2,134,583 | |||||||||
|
Nanosys,
Inc. (4)(5) — Developing zero and one-dimensional inorganic
nanometer-scale materials and devices
|
|||||||||
|
Series
C Convertible Preferred Stock
|
(M)
|
803,428 | 2,370,113 | ||||||
|
Series
D Convertible Preferred Stock
|
(M)
|
1,016,950 | 3,000,003 | ||||||
| 5,370,116 | |||||||||
|
HARRIS
& HARRIS GROUP, INC.
CONSOLIDATED
SCHEDULE OF INVESTMENTS AS OF DECEMBER 31,
2008
|
|
Method of
|
Shares/
|
||||||||
|
Valuation (1)
|
Principal
|
Value
|
|||||||
|
Investments
in Unaffiliated Companies (2)(3) – 11.0% of net assets at value
(cont.)
|
|||||||||
|
Private
Placement Portfolio (Illiquid) – 11.0% of net assets at value
(cont.)
|
|||||||||
|
Nantero,
Inc. (4)(5)(6) — Developing a high-density, nonvolatile, random
access memory chip, enabled by carbon nanotubes
|
|||||||||
|
Series
A Convertible Preferred Stock
|
(M)
|
345,070 | $ | 1,046,908 | |||||
|
Series
B Convertible Preferred Stock
|
(M)
|
207,051 | 628,172 | ||||||
|
Series
C Convertible Preferred Stock
|
(M)
|
188,315 | 571,329 | ||||||
| 2,246,409 | |||||||||
|
NeoPhotonics
Corporation (4)(5) — Developing and manufacturing optical devices and
components
|
|||||||||
|
Common
Stock
|
(M)
|
716,195 | 181,262 | ||||||
|
Series
1 Convertible Preferred Stock
|
(M)
|
1,831,256 | 463,472 | ||||||
|
Series
2 Convertible Preferred Stock
|
(M)
|
741,898 | 187,767 | ||||||
|
Series
3 Convertible Preferred Stock
|
(M)
|
2,750,000 | 695,995 | ||||||
|
Series
X Convertible Preferred Stock
|
(M)
|
2,000 | 101,236 | ||||||
|
Warrants
at $0.15 expiring 01/26/10
|
( I
)
|
16,364 | 2,373 | ||||||
|
Warrants
at $0.15 expiring 12/05/10
|
( I
)
|
14,063 | 2,349 | ||||||
| 1,634,454 | |||||||||
|
Polatis,
Inc. (4)(5)(6)(11) — Developing MEMS-based optical networking
components
|
|||||||||
|
Series
A-1 Convertible Preferred Stock
|
(M)
|
16,775 | 0 | ||||||
|
Series
A-2 Convertible Preferred Stock
|
(M)
|
71,611 | 0 | ||||||
|
Series
A-4 Convertible Preferred Stock
|
(M)
|
4,774 | 0 | ||||||
|
Series
A-5 Convertible Preferred Stock
|
(M)
|
16,438 | 0 | ||||||
| 0 | |||||||||
|
PolyRemedy,
Inc. (4)(5)(6)(9) —Developing a robotic manufacturing platform for wound
treatment patches
|
|||||||||
|
Series
B-1 Convertible Preferred Stock
|
(M)
|
287,647 | 122,250 | ||||||
|
Starfire
Systems, Inc. (4)(5) — Producing ceramic-forming polymers
|
|||||||||
|
Common
Stock
|
(M)
|
375,000 | 0 | ||||||
|
Series
A-1 Convertible Preferred Stock
|
(M)
|
600,000 | 0 | ||||||
| 0 | |||||||||
|
HARRIS
& HARRIS GROUP, INC.
CONSOLIDATED
SCHEDULE OF INVESTMENTS AS OF DECEMBER 31,
2008
|
|
Method of
|
Shares/
|
||||||||
|
Valuation (1)
|
Principal
|
Value
|
|||||||
|
Investments
in Unaffiliated Companies (2)(3) – 11.0% of net assets at value
(cont.)
|
|||||||||
|
Private
Placement Portfolio (Illiquid) – 11.0% of net assets at value
(cont.)
|
|||||||||
|
TetraVitae
Bioscience, Inc. (4)(5)(6)(9)(12) — Developing alternative fuels through
biomass fermentation
|
|||||||||
|
Series
B Convertible Preferred Stock
|
(M)
|
118,804 | $ | 125,000 | |||||
|
Total
Unaffiliated Private Placement Portfolio (cost:
$24,208,281)
|
$ | 12,086,503 | |||||||
|
Total
Investments in Unaffiliated Companies (cost: $24,208,281)
|
$ | 12,086,503 | |||||||
|
HARRIS
& HARRIS GROUP, INC.
CONSOLIDATED
SCHEDULE OF INVESTMENTS AS OF DECEMBER 31,
2008
|
|
Method of
|
Shares/
|
||||||||
|
Valuation (1)
|
Principal
|
Value
|
|||||||
|
Investments
in Non-Controlled Affiliated Companies (2)(13) – 36.2% of net assets at
value
|
|||||||||
|
Private Placement
Portfolio (Illiquid) – 36.2% of net
assets at
value
|
|||||||||
|
Adesto
Technologies Corporation (4)(5)(6) — Developing semiconductor-related
products enabled at the nanoscale
|
|||||||||
|
Series
A Convertible Preferred Stock
|
(M)
|
6,547,619 | $ | 1,100,000 | |||||
|
Ancora
Pharmaceuticals, Inc. (4)(5)(6) — Developing synthetic carbohydrates for
pharmaceutical applications
|
|||||||||
|
Series
B Convertible Preferred Stock
|
(M)
|
1,663,808 | 1,200,000 | ||||||
|
Bridgelux,
Inc. (4)(5)(14) — Manufacturing high-power light emitting
diodes
|
|||||||||
|
Series
B Convertible Preferred Stock
|
(M)
|
1,861,504 | 1,396,128 | ||||||
|
Series
C Convertible Preferred Stock
|
(M)
|
2,130,699 | 1,598,025 | ||||||
|
Series
D Convertible Preferred Stock
|
(M)
|
666,667 | 500,000 | ||||||
|
Warrants
at $0.7136 expiring 12/31/14
|
( I
)
|
98,340 | 60,774 | ||||||
|
Warrants
at $0.7136 expiring 12/31/14
|
( I
)
|
65,560 | 40,516 | ||||||
| 3,595,443 | |||||||||
|
Cambrios
Technologies Corporation (4)(5)(6) — Developing nanowire-enabled
electronic materials for the display industry
|
|||||||||
|
Series
B Convertible Preferred Stock
|
(M)
|
1,294,025 | 647,013 | ||||||
|
Series
C Convertible Preferred Stock
|
(M)
|
1,300,000 | 650,000 | ||||||
| 1,297,013 | |||||||||
|
CFX
Battery, Inc. (4)(5)(6)(15) — Developing batteries
using nanostructured materials
|
|||||||||
|
Series
A Convertible Preferred Stock
|
(M)
|
1,880,651 | 1,473,264 | ||||||
|
HARRIS
& HARRIS GROUP, INC.
CONSOLIDATED
SCHEDULE OF INVESTMENTS AS OF DECEMBER 31,
2008
|
|
Method of
|
Shares/
|
||||||||
|
Valuation (1)
|
Principal
|
Value
|
|||||||
|
Investments
in Non-Controlled Affiliated Companies (2)(13) – 36.2% of net assets at
value (cont.)
|
|||||||||
|
Private Placement
Portfolio (Illiquid) – 36.2% of net
assets at value (cont.)
|
|||||||||
|
Crystal
IS, Inc. (4)(5) — Developing single-crystal aluminum nitride substrates
for optoelectronic devices
|
|||||||||
|
Series
A Convertible Preferred Stock
|
(M)
|
391,571 | $ | 76,357 | |||||
|
Series
A-1 Convertible Preferred Stock
|
(M)
|
1,300,376 | 253,574 | ||||||
|
Warrants
at $0.78 expiring 05/05/13
|
( I
)
|
15,231 | 1,584 | ||||||
|
Warrants
at $0.78 expiring 05/12/13
|
( I
)
|
2,350 | 244 | ||||||
|
Warrants
at $0.78 expiring 08/08/13
|
( I
)
|
4,396 | 479 | ||||||
| 332,238 | |||||||||
|
CSwitch
Corporation (4)(5)(6)(16) — Developing next-generation, system-on-a-chip
solutions for communications-based platforms
|
|||||||||
|
Series
A-1 Convertible Preferred Stock
|
(M)
|
6,863,118 | 0 | ||||||
|
Unsecured
Convertible Bridge Note (including interest)
|
(M)
|
$ | 1,766,673 | 118,624 | |||||
| 118,624 | |||||||||
|
D-Wave
Systems, Inc. (4)(5)(6)(17) — Developing high-performance quantum
computing systems
|
|||||||||
|
Series
B Convertible Preferred Stock
|
(M)
|
1,144,869 | 1,038,238 | ||||||
|
Series
C Convertible Preferred Stock
|
(M)
|
450,450 | 408,496 | ||||||
|
Series
D Convertible Preferred Stock
|
(M)
|
1,533,395 | 1,390,578 | ||||||
| 2,837,312 | |||||||||
|
Ensemble
Discovery Corporation (4)(5)(6)(18) — Developing DNA Programmed
Chemistry for the discovery of new classes of therapeutics and
bioassays
|
|||||||||
|
Series
B Convertible Preferred Stock
|
(M)
|
1,449,275 | 1,000,000 | ||||||
|
Unsecured
Convertible Bridge Note (including interest)
|
(M)
|
$ | 250,286 | 256,375 | |||||
| 1,256,375 | |||||||||
|
Innovalight,
Inc. (4)(5)(6) — Developing solar power products enabled by silicon-based
nanomaterials
|
|||||||||
|
Series
B Convertible Preferred Stock
|
(M)
|
16,666,666 | 4,288,662 | ||||||
|
Series
C Convertible Preferred Stock
|
(M)
|
5,810,577 | 1,495,176 | ||||||
| 5,783,838 | |||||||||
|
HARRIS
& HARRIS GROUP, INC.
CONSOLIDATED
SCHEDULE OF INVESTMENTS AS OF DECEMBER 31,
2008
|
|
Method of
|
Shares/
|
||||||||
|
Valuation (1)
|
Principal
|
Value
|
|||||||
|
Investments
in Non-Controlled Affiliated Companies (2)(13) – 36.2% of net assets at
value (cont.)
|
|||||||||
|
Private Placement
Portfolio (Illiquid) – 36.2% of net
assets at value (cont.)
|
|||||||||
|
Kovio,
Inc. (4)(5)(6) — Developing semiconductor products
using printed electronics and thin-film technologies
|
|||||||||
|
Series
C Convertible Preferred Stock
|
(M)
|
2,500,000 | $ | 2,561,354 | |||||
|
Series
D Convertible Preferred Stock
|
(M)
|
800,000 | 819,633 | ||||||
|
Series
E Convertible Preferred Stock
|
(M)
|
1,200,000 | 1,229,450 | ||||||
|
Warrants
at $1.25 expiring 12/31/12
|
( I
)
|
355,880 | 253,066 | ||||||
| 4,863,503 | |||||||||
|
Mersana
Therapeutics, Inc. (4)(5)(6)(19) — Developing advanced polymers for drug
delivery
|
|||||||||
|
Series
A Convertible Preferred Stock
|
(M)
|
68,451 | 68,451 | ||||||
|
Series
B Convertible Preferred Stock
|
(M)
|
866,500 | 866,500 | ||||||
|
Warrants
at $2.00 expiring 10/21/10
|
( I
)
|
91,625 | 33,718 | ||||||
|
Unsecured
Convertible Bridge Note (including interest)
|
(M)
|
$ | 200,000 | 208,110 | |||||
| 1,176,779 | |||||||||
|
Metabolon,
Inc. (4)(5) — Discovering biomarkers through the use of
metabolomics
|
|||||||||
|
Series
B Convertible Preferred Stock
|
(M)
|
2,173,913 | 882,768 | ||||||
|
Series
B-1 Convertible Preferred Stock
|
(M)
|
869,565 | 353,107 | ||||||
|
Warrants
at $1.15 expiring 3/25/15
|
( I
)
|
434,783 | 127,391 | ||||||
| 1,363,266 | |||||||||
|
|
|||||||||
|
NanoGram
Corporation (4)(5) — Developing solar power products enabled by
silicon-based nanomaterials
|
|||||||||
|
Series
I Convertible Preferred Stock
|
(M)
|
63,210 | 31,131 | ||||||
|
Series
II Convertible Preferred Stock
|
(M)
|
1,250,904 | 616,070 | ||||||
|
Series
III Convertible Preferred Stock
|
(M)
|
1,242,144 | 611,756 | ||||||
|
Series
IV Convertible Preferred Stock
|
(M)
|
432,179 | 212,848 | ||||||
| 1,471,805 | |||||||||
|
Nanomix,
Inc. (4)(5) — Producing nanoelectronic sensors that integrate carbon
nanotube electronics with silicon microstructures
|
|||||||||
|
Series
C Convertible Preferred Stock
|
(M)
|
977,917 | 23,622 | ||||||
|
Series
D Convertible Preferred Stock
|
(M)
|
6,802,397 | 6,428 | ||||||
| 30,050 | |||||||||
|
HARRIS
& HARRIS GROUP, INC.
CONSOLIDATED
SCHEDULE OF INVESTMENTS AS OF DECEMBER 31,
2008
|
|
Method of
|
Shares/
|
||||||||
|
Valuation (1)
|
Principal
|
Value
|
|||||||
|
Investments
in Non-Controlled Affiliated Companies (2)(13) – 36.2% of net assets at
value (cont.)
|
|||||||||
|
Private Placement
Portfolio (Illiquid) – 36.2% of net
assets at value (cont.)
|
|||||||||
|
Nextreme
Thermal Solutions, Inc. (4)(5) — Developing thin-film thermoelectric
devices for cooling and energy conversion
|
|||||||||
|
Series
A Convertible Preferred Stock
|
(M)
|
17,500 | $ | 875,000 | |||||
|
Series
B Convertible Preferred Stock
|
(M)
|
4,870,244 | 1,327,629 | ||||||
| 2,202,629 | |||||||||
|
Questech
Corporation (4)(5) — Manufacturing and marketing proprietary metal and
stone decorative tiles
|
|||||||||
|
Common
Stock
|
(M)
|
655,454 | 128,266 | ||||||
|
Warrants
at $1.50 expiring 11/19/09
|
( I
)
|
5,000 | 20 | ||||||
| 128,286 | |||||||||
|
Siluria
Technologies, Inc. (4)(5)(6) — Developing next-generation
nanomaterials
|
|||||||||
|
Series
S-2 Convertible Preferred Stock
|
(M)
|
482,218 | 0 | ||||||
|
Unsecured
Bridge Note (including interest)
|
(M)
|
$ | 42,542 | 42,731 | |||||
| 42,731 | |||||||||
|
Solazyme,
Inc. (4)(5)(6) — Developing algal biodiesel, industrial chemicals and
special ingredients based on synthetic biology
|
|||||||||
|
Series
A Convertible Preferred Stock
|
(M)
|
988,204 | 2,489,088 | ||||||
|
Series
B Convertible Preferred Stock
|
(M)
|
495,246 | 1,247,426 | ||||||
|
Series
C Convertible Preferred Stock
|
(M)
|
651,309 | 1,640,517 | ||||||
| 5,377,031 | |||||||||
|
Xradia,
Inc. (4)(5) — Designing, manufacturing and selling ultra-high resolution
3D x-ray microscopes and fluorescence imaging systems
|
|||||||||
|
Series
D Convertible Preferred Stock
|
(M)
|
3,121,099 | 4,000,000 | ||||||
|
Total
Non-Controlled Private Placement Portfolio (cost:
$60,796,720)
|
$ | 39,650,187 | |||||||
|
Total
Investments in Non-Controlled Affiliated Companies (cost:
$60,796,720)
|
$ | 39,650,187 | |||||||
|
HARRIS
& HARRIS GROUP, INC.
CONSOLIDATED
SCHEDULE OF INVESTMENTS AS OF DECEMBER 31,
2008
|
|
Method of
|
Shares/
|
||||||||
|
Valuation (1)
|
Principal
|
Value
|
|||||||
|
Investments
in Controlled Affiliated Companies (2)(20) – 4.8% of net assets at
value
|
|||||||||
|
Private Placement
Portfolio (Illiquid) – 4.8% of
net assets at
value
|
|||||||||
|
Laser
Light Engines, Inc. (4)(5)(6)(9) — Manufacturing solid-state light sources
for digital cinema and large-venue projection displays
|
|||||||||
|
Series
A Convertible Preferred Stock
|
(M)
|
7,499,062 | $ | 2,000,000 | |||||
|
SiOnyx,
Inc. (4)(5)(6) — Developing silicon-based optoelectronic products enabled
by its proprietary "Black Silicon"
|
|||||||||
|
Series
A Convertible Preferred Stock
|
(M)
|
233,499 | 101,765 | ||||||
|
Series
A-1 Convertible Preferred Stock
|
(M)
|
2,966,667 | 1,292,948 | ||||||
|
Series
A-2 Convertible Preferred Stock
|
(M)
|
4,207,537 | 1,833,750 | ||||||
| 3,228,463 | |||||||||
|
Total
Controlled Private Placement Portfolio (cost: $6,085,000)
|
$ | 5,228,463 | |||||||
|
Total
Investments in Controlled Affiliated Companies (cost:
$6,085,000)
|
$ | 5,228,463 | |||||||
|
Total
Private Placement Portfolio (cost: $91,090,001)
|
$ | 56,965,153 | |||||||
|
HARRIS
& HARRIS GROUP, INC.
CONSOLIDATED
SCHEDULE OF INVESTMENTS AS OF DECEMBER 31,
2008
|
|
Method of
|
Shares/
|
||||||||
|
Valuation (1)
|
Principal
|
Value
|
|||||||
|
U.S.
Government Securities (21) – 48.4% of net assets at value
|
|||||||||
|
U.S.
Treasury Bill — due date 01/29/09
|
(M)
|
$ | 52,985,000 | $ | 52,983,940 | ||||
|
Total
Investments in U.S. Government Securities (cost:
$52,956,288)
|
|
$ | 52,983,940 | ||||||
|
Total
Investments (cost: $144,046,289)
|
|
$ | 109,949,093 | ||||||
|
HARRIS
& HARRIS GROUP, INC.
CONSOLIDATED
SCHEDULE OF INVESTMENTS AS OF DECEMBER 31,
2008
|
|
(1)
|
See
Footnote to Consolidated Schedule of Investments on page 101 for a
description of the Valuation
Procedures.
|
|
(2)
|
Investments
in unaffiliated companies consist of investments in which we own less than
five percent of the voting shares of the portfolio
company. Investments in non-controlled affiliated companies
consist of investments in which we own five percent or more, but less than
25 percent, of the voting shares of the portfolio company, or where we
hold one or more seats on the portfolio company’s Board of Directors but
do not control the company. Investments in controlled
affiliated companies consist of investments in which we own 25 percent or
more of the voting shares of the portfolio company or otherwise control
the company.
|
|
(3)
|
The
aggregate cost for federal income tax purposes of investments in
unaffiliated companies is $24,208,281. The gross unrealized
appreciation based on the tax cost for these securities is
$1,732,194. The gross unrealized depreciation based on the tax
cost for these securities is
$13,853,972.
|
|
(4)
|
Legal
restrictions on sale of investment.
|
|
(5)
|
Represents
a non-income producing security. Equity investments that have
not paid dividends within the last 12 months are considered to be
non-income producing.
|
|
(6)
|
These
investments are development-stage companies. A
development-stage company is defined as a company that is devoting
substantially all of its efforts to establishing a new business, and
either it has not yet commenced its planned principal operations, or it
has commenced such operations but has not realized significant revenue
from them.
|
|
(7)
|
With
our purchase of Series E Convertible Preferred Stock of BioVex, we
received a warrant to purchase a number of shares of common stock of
BioVex as determined by dividing 624,999.99 by the price per share at
which the common stock is offered and sold to the public in connection
with the IPO. The ability to exercise this warrant is therefore
contingent on BioVex completing successfully an IPO before the expiration
date of the warrant on September 27, 2012. The exercise price
of this warrant shall be 110 percent of the IPO
price.
|
|
HARRIS
& HARRIS GROUP, INC.
CONSOLIDATED
SCHEDULE OF INVESTMENTS AS OF DECEMBER 31,
2008
|
|
(8)
|
With
our investment in a convertible bridge note issued by BioVex Group, Inc.,
we received a warrant to purchase a number of shares of the class of stock
sold in the next financing of BioVex equal to $60,000 divided by the price
per share of the class of stock sold in the next financing of
BioVex. The ability to exercise this warrant is, therefore,
contingent on BioVex completing successfully a subsequent round of
financing. This warrant shall expire and no longer be
exercisable on November 13, 2015. The cost basis of this
warrant is $200.
|
|
(9)
|
Initial
investment was made during 2008.
|
|
(10)
|
Cobalt
Technologies, Inc., does business as Cobalt
Biofuels.
|
|
(11)
|
Continuum
Photonics, Inc., merged with Polatis, Ltd., to form Polatis,
Inc.
|
|
(12)
|
With
our purchase of the Series B Convertible Preferred Stock of TetraVitae
Bioscience, Inc., we received the right to purchase, at a price of
$2.63038528 per share, a number of shares in the Series C financing equal
to the number of shares of Series B Preferred Stock purchased. The
ability to exercise this right is contingent on TetraVitae Bioscience
completing successfully a subsequent round of
financing.
|
|
(13)
|
The
aggregate cost for federal income tax purposes of investments in
non-controlled affiliated companies is $60,796,720. The gross
unrealized appreciation based on the tax cost for these securities is
$2,798,072. The gross unrealized depreciation based on the tax
cost for these securities is
$23,944,605.
|
|
(14)
|
Bridgelux,
Inc., was previously named eLite Optoelectronics,
Inc.
|
|
(15)
|
On February 28, 2008, Lifco,
Inc., merged with CFX Battery, Inc. The surviving entity is CFX
Battery, Inc.
|
|
(16)
|
With
our investments in secured convertible bridge notes issued by CSwitch, we
received three warrants to purchase a number of shares of the class of
stock sold in the next financing of CSwitch equal to $529,322, $985,835
and $249,750, respectively, the principal of the notes, divided by the
lowest price per share of the class of stock sold in the next financing of
CSwitch. The ability to exercise these warrants is, therefore,
contingent on CSwitch completing successfully a subsequent round of
financing. The warrants will expire five years from the date of the
close of the next round of financing. The cost basis of these
warrants is $529, $986 and $250,
respectively.
|
|
HARRIS
& HARRIS GROUP, INC.
CONSOLIDATED
SCHEDULE OF INVESTMENTS AS OF DECEMBER 31,
2008
|
|
(17)
|
D-Wave
Systems, Inc., is located and is doing business primarily in
Canada. We invested in D-Wave Systems, Inc., through
D-Wave USA, a Delaware company. Our investment is denominated
in Canadian dollars and is subject to foreign currency
translation. See "Note 2. Summary of Significant Accounting
Policies."
|
|
(18)
|
With
our investment in a convertible bridge note issued by Ensemble Discovery,
we received a warrant to purchase a number of shares of the class of stock
sold in the next financing of Ensemble Discovery equal to $125,105.40
divided by the price per share of the class of stock sold in the next
financing of Ensemble Discovery. The ability to exercise this
warrant is, therefore, contingent on Ensemble Discovery completing
successfully a subsequent round of financing. This warrant
shall expire and no longer be exercisable on September 10,
2015. The cost basis of this warrant is
$75.20.
|
|
(19)
|
Mersana
Therapeutics, Inc., was previously named Nanopharma
Corp.
|
|
(20)
|
The
aggregate cost for federal income tax purposes of investments in
controlled affiliated companies is $6,085,000. The gross
unrealized appreciation based on the tax cost for these securities is
$0. The gross unrealized depreciation based on the tax cost for
these securities is $856,537.
|
|
(21)
|
The
aggregate cost for federal income tax purposes of our U.S. government
securities is $52,956,288. The gross unrealized appreciation on
the tax cost for these securities is $27,652. The gross
unrealized depreciation on the tax cost of these securities is
$0.
|
|
HARRIS
& HARRIS GROUP, INC.
FOOTNOTE
TO CONSOLIDATED SCHEDULE OF
INVESTMENTS
|
|
·
|
Market
Approach: The market approach uses prices and other relevant
information generated by market transactions involving identical or
comparable assets or liabilities. For example, the market approach often
uses market multiples derived from a set of comparables. Multiples might
lie in ranges with a different multiple for each comparable. The selection
of where within the range each appropriate multiple falls requires
judgment considering factors specific to the measurement (qualitative and
quantitative).
|
|
·
|
Income
Approach: The income approach uses valuation techniques to convert
future amounts (for example, cash flows or earnings) to a single present
value amount (discounted). The measurement is based on the value indicated
by current market expectations about those future amounts. Those valuation
techniques include present value techniques; option-pricing models, such
as the Black-Scholes-Merton formula (a closed-form model) and a binomial
model (a lattice model), which incorporate present value techniques; and
the multi-period excess earnings method, which is used to measure the fair
value of certain
assets.
|
|
|
·
|
Level 1:
Unadjusted quoted prices in active markets for identical assets or
liabilities.
|
|
|
|
|
|
·
|
Level 2: Quoted
prices in active markets for similar assets or liabilities, or quoted
prices for identical or similar assets or liabilities in markets that are
not active, or inputs other than quoted prices that are observable for the
asset or liability.
|
|
|
|
|
·
|
Level 3:
Unobservable inputs for the asset or
liability.
|
|
|
·
|
Equity-related
securities;
|
|
|
·
|
Long-term
fixed-income securities;
|
|
|
·
|
Short-term
fixed-income securities;
|
|
|
·
|
Investments
in intellectual property, patents, research and development in technology
or product development;
and
|
|
|
·
|
All
other securities.
|
|
|
A.
|
EQUITY-RELATED
SECURITIES
|
|
|
§
|
Readily
available public market quotations;
|
|
|
§
|
The
cost of the Company’s investment;
|
|
|
§
|
Transactions
in a company's securities or unconditional firm offers by responsible
parties as a factor in determining
valuation;
|
|
|
§
|
The
financial condition and operating results of the
company;
|
|
|
§
|
The
company's progress towards
milestones.
|
|
|
§
|
The
long-term potential of the business and technology of the
company;
|
|
|
§
|
The
values of similar securities issued by companies in similar
businesses;
|
|
|
§
|
Multiples
to revenue, net income or EBITDA that similar securities issued by
companies in similar businesses
receive;
|
|
|
§
|
The
proportion of the company's securities we own and the nature of any rights
to require the company to register restricted securities under applicable
securities laws; and
|
|
|
§
|
The
rights and preferences of the class of securities we own as compared to
other classes of securities the portfolio company has
issued.
|
|
|
B.
|
LONG-TERM
FIXED-INCOME SECURITIES
|
|
|
1.
|
Readily
Marketable: Long-term fixed-income securities for which
market quotations are readily available are valued using the most recent
bid quotations when available
|
|
2.
|
Not
Readily Marketable: Long-term fixed-income securities
for which market quotations are not readily available are fair valued
using the market approach. The factors that may be considered
when valuing these types of securities by the market approach
include:
|
|
|
·
|
Credit
quality;
|
|
|
·
|
Interest
rate analysis;
|
|
|
·
|
Quotations
from broker-dealers;
|
|
|
·
|
Prices
from independent pricing services that the Board believes are reasonably
reliable; and
|
|
|
·
|
Reasonable
price discovery procedures and data from other
sources.
|
|
|
·
|
The
cost of the Company’s investment;
|
|
|
·
|
Investments
in the same or substantially similar intellectual property or patents or
research and development in technology or product development or offers by
responsible third parties;
|
|
|
·
|
The
results of research and
development;
|
|
|
·
|
Product
development and milestone progress;
|
|
|
·
|
Commercial
prospects;
|
|
|
·
|
Term
of patent;
|
|
|
·
|
Projected
markets; and
|
|
|
·
|
Other
subjective factors.
|
|
NOTES
TO CONSOLIDATED FINANCIAL
STATEMENTS
|
|
Fair Value Measurement at Reporting Date
Using:
|
||||||||||||||||
|
Description
|
December 31,
2009
|
Quoted
Prices in Active
Markets
for Identical
Assets (Level 1)
|
Significant
Other
Observable
Inputs
(Level 2)
|
Significant
Unobservable
Inputs
(Level 3)
|
||||||||||||
|
U.S.
Government Securities
|
$ | 55,947,581 | $ | 52,136,751 | $ | 3,810,830 | $ | 0 | ||||||||
|
Private
Portfolio Companies:
|
||||||||||||||||
|
Preferred
Stock
|
$ | 73,134,661 | $ | 0 | $ | 0 | $ | 73,134,661 | ||||||||
|
Bridge
Notes
|
$ | 2,718,225 | $ | 0 | $ | 0 | $ | 2,718,225 | ||||||||
|
Common
Stock
|
$ | 1,164,599 | $ | 0 | $ | 0 | $ | 1,164,599 | ||||||||
|
Warrants
|
$ | 779,601 | $ | 0 | $ | 0 | $ | 779,601 | ||||||||
| $ | 77,797,086 | |||||||||||||||
|
Publicly
Traded
|
||||||||||||||||
|
Portfolio
Companies
|
$ | 226,395 | $ | 226,395 | $ | 0 | $ | 0 | ||||||||
|
Total
|
$ | 133,971,062 | $ | 52,363,146 | $ | 3,810,830 | $ | 77,797,086 | ||||||||
|
Fair Value
Measurements
Using Significant
|
||||
|
Unobservable
Inputs (Level 3)
|
||||
|
Portfolio
Companies
|
||||
|
Beginning
Balance, January 1, 2009
|
$56,965,153
|
|||
|
Total
realized losses included in change in net assets
|
(11,106,005)
|
|||
|
Total
unrealized gains included in change in net assets
|
19,830,852
|
|||
|
Investments
in private placements and interest on bridge notes
|
12,212,789
|
|||
|
Disposals
and write-offs of bridge note interest
|
(105,703)
|
|||
|
Ending
Balance, December 31, 2009
|
$77,797,086
|
|||
|
The
amount of total gains for the period included in changes in net assets
attributable to the change in unrealized gains or losses
relating to assets still held at the reporting
date
|
$8,786,290
|
|||
|
Grant Date
|
No. of Options
Granted
|
Option Type
|
Vesting Period
|
Exercise Price1
|
|||||
|
November
11, 2009
|
200,000
|
NQSO
|
11/10
to 11/12
|
$4.49
|
|||||
|
May
13, 2009
|
200,000
|
NQSO
|
11/09
to 05/13
|
$4.46
|
|||||
|
March
18, 2009
|
329,999
|
NQSO
|
03/10
to 03/13
|
$3.75
|
|||||
|
August
13, 2008
|
1,163,724
|
|
NQSO
|
12/08
to 08/12
|
$6.92
|
||||
|
March
19, 2008
|
348,032
|
|
NQSO
|
03/09
to 03/12
|
$6.18
|
|
|||
|
June
27, 2007
|
1,700,609
|
NQSO
|
12/07
to 06/14
|
$11.11
|
|
Number
|
Expected
|
Expected
|
Expected
|
Risk-free
|
Fair
|
|||||||||||||||
|
of Options
|
Term
|
Volatility
|
Dividend
|
Interest
|
Value
|
|||||||||||||||
|
Type of Award
|
Term
|
Granted
|
in Yrs
|
Factor
|
Yield
|
Rates
|
Per Share
|
|||||||||||||
|
Non-qualified
stock options
|
1.5
Years
|
380,000
|
1
|
42.6%
|
0%
|
4.93%
|
$2.11
|
|||||||||||||
|
|
||||||||||||||||||||
|
Non-qualified
stock options
|
2.5
Years
|
600,540
|
2
|
40.1%
|
0%
|
4.91%
|
|
$2.92
|
||||||||||||
|
Non-qualified
stock options
|
3.5
Years
|
338,403
|
3
|
44.7%
|
0%
|
4.93%
|
$3.94
|
|||||||||||||
|
Non-qualified
stock options
|
9
Years
|
381,666
|
Ranging
From 4.75-
6.28
|
Ranging From
57.8%
to
59.9%
|
0%
|
Ranging
From 4.97%
to 5.01%
|
Ranging
From $5.92
to $6.85
|
|||||||||||||
|
Total
|
1,700,609
|
|
Weighted
|
|||||||||||||||||||||
|
Average
|
|||||||||||||||||||||
|
Number
|
Expected
|
Expected
|
Expected
|
Risk-free
|
Fair
|
||||||||||||||||
|
of Options
|
Term
|
Volatility
|
Dividend
|
Interest
|
Value
|
||||||||||||||||
|
Type of Award
|
Term
|
Granted
|
in Yrs
|
Factor
|
Yield
|
Rates
|
Per Share
|
||||||||||||||
|
Non-qualified
stock options
|
9.78
Years
|
348,032
|
6.14
|
57.1%
|
0%
|
2.62%
|
$3.45
|
||||||||||||||
|
Non-qualified
stock options
|
9.38
Years
|
1,163,724
|
Ranging
From
4.88
to
5.94
|
Ranging
From
50.6%
to
55.1%
|
0%
|
Ranging
From
3.24%
to
3.40%
|
Ranging
From
$3.25
to
$3.79
|
||||||||||||||
|
|
|||||||||||||||||||||
|
Total
|
1,511,756
|
|
|||||||||||||||||||
|
Number
|
Expected
|
Expected
|
Expected
|
Risk-free
|
Fair
|
||||||||||||||||
|
Contractual
|
of Options
|
Term
|
Volatility
|
Dividend
|
Interest
|
Value
|
|||||||||||||||
|
Type of Award
|
Term
|
Granted
|
in Yrs
|
Factor
|
Yield
|
Rate
|
Per Share
|
||||||||||||||
|
Non-qualified
stock options
|
2
Years
|
394,570
|
Ranging
from
1.375
to
1.5
|
Ranging
from
71.7%
to
105.5%
|
0%
|
Ranging
from
0.52%
to
0.71%
|
Ranging
from
$1.29
to
$2.08
|
|
|||||||||||||
|
|
|||||||||||||||||||||
|
Non-qualified
stock options
|
5
Years
|
200,000
|
3.5
|
64.6%
|
0%
|
1.64%
|
$2.11
|
||||||||||||||
|
|
|||||||||||||||||||||
|
Non-qualified
stock options
|
10
Years
|
51,200
|
6.25
|
60.6%
|
0%
|
2.35%
|
$2.60
|
||||||||||||||
|
Total
|
645,770
|
||||||||||||||||||||
|
Number
|
Expected
|
Expected
|
Risk-free
|
Fair
|
||||||||||||||||
|
Contractual
|
of Options
|
Suboptimal
|
Volatility
|
Dividend
|
Interest
|
Value
|
||||||||||||||
|
Type of Award
|
Term
|
Granted
|
Factor
|
Factor
|
Yield
|
Rate
|
Per Share
|
|||||||||||||
|
Non-qualified
stock options
|
10
Years
|
84,229
|
|
2
|
73.1%
|
0%
|
2.59%
|
$1.97
|
|
Weighted
|
||||||||||||||||||||
|
Weighted
|
Weighted
|
Average
|
||||||||||||||||||
|
Average
|
Average
|
Remaining
|
Aggregate
|
|||||||||||||||||
|
Exercise
|
Grant Date
|
Contractual
|
Intrinsic
|
|||||||||||||||||
|
Shares
|
Price
|
Fair Value
|
Term (Yrs)
|
Value
|
||||||||||||||||
|
Options
Outstanding at January 1, 2009
|
4,638,213 | $ | 9.30 | $ | 4.83 |
6.03
|
$ | 0 | ||||||||||||
|
Granted
|
729,999 | $ | 4.15 | $ | 1.85 |
3.74
|
||||||||||||||
|
Exercised
|
(112,520 | ) | $ | 3.75 | $ | 1.32 | ||||||||||||||
|
Forfeited
or Expired
|
(1,071,189 | ) | $ | 10.66 | $ | 3.32 | ||||||||||||||
|
Options
Outstanding at December 31, 2009
|
4,184,503 | $ | 8.20 | $ | 4.79 |
6.24
|
$ | 216,333 | ||||||||||||
|
Options
Exercisable at December 31, 2009
|
2,442,349 | $ | 8.94 | $ | 5.13 |
5.54
|
$ | 186,517 | ||||||||||||
|
Options
Exercisable and Expected to be Exercisable at December 31,
2009
|
4,125,952 | $ | 8.17 | $ | 4.75 |
6.24
|
$ | 216,333 | ||||||||||||
|
2009
|
2008
|
|||||||
|
Accumulated
Postretirement Benefit Obligation at Beginning of Year
|
$ | 853,679 | $ | 628,745 | ||||
|
Service
Cost
|
113,450 | 86,497 | ||||||
|
Interest
Cost
|
47,629 | 39,972 | ||||||
|
Actuarial
(Gain)/Loss
|
7,285 | 109,312 | ||||||
|
Benefits
Paid
|
(28,402 | ) | (10,847 | ) | ||||
|
Accumulated
Postretirement Benefit Obligation at End of Year
|
$ | 993,641 | $ | 853,679 | ||||
|
1% Decrease
|
Assumed
|
1% Increase
|
||||||||||
|
in Rates
|
Rates
|
in Rates
|
||||||||||
|
Aggregated
Service and Interest Cost
|
$ | 123,514 | $ | 161,079 | $ | 212,783 | ||||||
|
Accumulated
Postretirement Benefit Obligation
|
$ | 816,630 | $ | 993,641 | $ | 1,225,828 | ||||||
|
2009
|
2008
|
2007
|
||||||||||
|
Service
Cost
|
$ | 113,450 | $ | 86,497 | $ | 102,676 | ||||||
|
Interest
Cost on Accumulated Postretirement Benefit Obligation
|
47,629 | 39,972 | 33,935 | |||||||||
|
Amortization
of Transition Obligation
|
0 | 0 | 0 | |||||||||
|
Amortization
of Net (Gain)/Loss
|
(4,103 | ) | (11,215 | ) | (6,234 | ) | ||||||
|
Net
Periodic Post Retirement Benefit Cost
|
$ | 156,976 | $ | 115,254 | $ | 130,377 | ||||||
|
2010
|
$ | 20,120 | |
|
2011
|
$ | 22,025 | |
|
2012
|
$ | 23,985 | |
|
2013
|
$ | 25,969 | |
|
2014
|
$ | 27,951 | |
|
2015
through 2019
|
$ | 181,669 |
|
2009
|
2008
|
2007
|
||||||||||
|
Current
|
$ | (753 | ) | $ | 34,121 | $ | 87,975 | |||||
|
Total
income tax (benefit) expense
|
$ | (753 | ) | $ | 34,121 | $ | 87,975 | |||||
|
2009
|
2008
|
2007
|
||||||||||
|
Numerator
for decrease in net assets per share
|
$ | (148,465 | ) | $ | (49,181,497 | ) | $ | (6,716,445 | ) | |||
|
Denominator
for basic and diluted weighted average shares
|
27,025,995 | 24,670,516 | 22,393,030 | |||||||||
|
Basic
and diluted net decrease in net assets per share resulting from
operations
|
(0.01 | ) | (1.99 | ) | $ | (0.30 | ) | |||||
|
2009
|
||||||||||||||||
|
1st Quarter
|
2nd Quarter
|
3rd Quarter
|
4th Quarter
|
|||||||||||||
|
Total
investment (loss) income
|
$ | (23,561 | ) | $ | 83,834 | $ | 105,677 | $ | 81,898 | |||||||
|
Net
operating loss
|
$ | (2,098,879 | ) | $ | (1,998,271 | ) | $ | (2,242,953 | ) | $ | (2,421,112 | ) | ||||
|
Net
(decrease) increase in net assets resulting from
operations
|
$ | (951,424 | ) | $ | 421,367 | $ | (296,319 | ) | $ | 677,911 | ||||||
|
Net
(decrease) increase in net assets resulting from operations per average
outstanding share
|
$ | (0.04 | ) | $ | 0.02 | $ | (0.01 | ) | $ | 0.02 | ||||||
|
2008
|
||||||||||||||||
|
1st Quarter
|
2nd Quarter
|
3rd Quarter
|
4th Quarter
|
|||||||||||||
|
Total
investment income
|
$ | 576,302 | $ | 467,625 | $ | 587,918 | $ | 355,502 | ||||||||
|
Net
operating loss
|
$ | (2,480,618 | ) | $ | (2,638,283 | ) | $ | (2,196,739 | ) | $ | (3,371,511 | ) | ||||
|
Net
(decrease) increase in net assets resulting from
operations
|
$ | (3,289,035 | ) | $ | 1,354,709 | $ | (34,032,747 | ) | $ | (13,214,424 | ) | |||||
|
Net
(decrease) increase in net assets resulting from operations per average
outstanding share
|
$ | (0.14 | ) | $ | 0.06 | $ | (1.32 | ) | $ | (0.51 | ) | |||||
|
HARRIS
& HARRIS GROUP, INC.
FINANCIAL
HIGHLIGHTS
|
|
Year Ended
|
Year Ended
|
Year Ended
|
||||||||||
|
December 31, 2009
|
December 31, 2008
|
December 31, 2007
|
||||||||||
|
Per
Share Operating Performance
|
||||||||||||
|
Net
asset value per share, beginning of year
|
$ | 4.24 | $ | 5.93 | $ | 5.42 | ||||||
|
Net
operating loss*
|
(0.32 | ) | (0.43 | ) | (0.53 | ) | ||||||
|
Net
realized (loss) income on investments*
|
(0.42 | ) | (0.34 | ) | 0.00 | |||||||
|
Net
decrease in unrealized depreciation as a result of sales*
|
0.41 | 0.34 | 0.00 | |||||||||
|
Net
decrease (increase) in unrealized depreciation on
investments held*(1)
|
0.32 | (1.49 | ) | 0.23 | ||||||||
|
Total
from investment operations*
|
(0.01 | ) | (1.92 | ) | (0.30 | ) | ||||||
|
Net
increase as a result of stock- based compensation expense*
|
0.11 | 0.24 | 0.36 | |||||||||
|
Net
increase as a result of proceeds from exercise of options
|
0.00 | 0.00 | 0.19 | |||||||||
|
Net
increase (decrease) as a result of stock offering, net of offering
expenses
|
0.01 | (0.01 | ) | 0.26 | ||||||||
|
Total
increase from capital stock transactions
|
0.12 | 0.23 | 0.81 | |||||||||
|
Net
asset value per share, end of year
|
$ | 4.35 | $ | 4.24 | $ | 5.93 | ||||||
|
Stock
price per share, end of year
|
$ | 4.57 | $ | 3.95 | $ | 8.79 | ||||||
|
Total
return based on stock price
|
15.7 | % | (55.06 | )% | (27.3 | )% | ||||||
|
Supplemental
Data:
|
||||||||||||
|
Net
assets, end of year
|
$ | 134,158,258 | $ | 109,531,113 | $ | 138,363,344 | ||||||
|
Ratio
of expenses to average net assets
|
7.8 | % | 9.6 | % | 11.6 | % | ||||||
|
Ratio
of net operating loss to average net assets
|
(7.6 | )% | (8.1 | )% | (9.5 | )% | ||||||
|
Cash
dividends paid per share
|
$ | 0.00 | $ | 0.00 | $ | 0.00 | ||||||
|
Taxes
payable on behalf of shareholders on the deemed dividend per
share
|
$ | 0.00 | $ | 0.00 | $ | 0.00 | ||||||
|
Number
of shares outstanding, end of year
|
30,859,593 | 25,859,573 | 23,314,573 | |||||||||
|
Item
11.
|
Security
Ownership of Certain Beneficial Owners and Management and Related
Stockholder Matters.
|
|
(a)
|
The
following documents are filed as a part of this
report:
|
|
(1)
|
Listed
below are the financial statements which are filed as part of this
report:
|
|
·
|
Consolidated
Statements of Assets and Liabilities as of December 31, 2009, and
2008;
|
|
·
|
Consolidated
Statement of Operations for the years ended December 31, 2009, 2008, and
2007;
|
|
·
|
Consolidated
Statements of Cash Flows for the years ended December 31, 2009, 2008, and
2007;
|
|
·
|
Consolidated
Statements of Changes in Net Assets for the years ended December 31, 2009,
2008, and 2007;
|
|
·
|
Consolidated
Schedule of Investments as of December 31,
2009;
|
|
·
|
Consolidated
Schedule of Investments as of December 31,
2008;
|
|
·
|
Footnote
to Consolidated Schedule of
Investments;
|
|
·
|
Notes
to Consolidated Financial Statements;
and
|
|
·
|
Financial
Highlights for the years ended December 31, 2009, 2008, and
2007.
|
|
(2)
|
No
financial statement schedules are required to be filed herewith because
(i) such schedules are not required or (ii) the information has been
presented in the above financial
statements.
|
|
(3)
|
The
following exhibits are filed with this report or are incorporated herein
by reference to a prior filing, in accordance with Rule 12b-32 under the
Exchange Act.
|
|
3.1(a)
|
Restated
Certificate of Incorporation of Harris & Harris Group, Inc., dated
September 23, 2005, incorporated by reference as Exhibit 99 to Form 8-K
(File No. 814-00176) filed on September 27,
2005.
|
|
3.1(b)
|
Certificate
of Amendment of the Certificate of Incorporation of Harris & Harris
Group, Inc., dated May 19, 2006, incorporated by reference as Exhibit 3.1
to the Company's Form 10-Q (File No. 814-00176) filed on August 9,
2006.
|
|
3.2
|
Restated
By-laws, incorporated by reference as Exhibit 3.2 to the Company's Annual
Report on Form 10-K for the year ended December 31, 2008 (File No.
814-00176) filed on March 16,
2009.
|
|
|
4
|
Form
of Specimen Certificate of Common Stock, incorporated by reference as
Exhibit 4 to the Company's Annual Report on Form 10-K for the year ended
December 31, 2008 (File No. 814-00176) filed on March 16,
2009.
|
|
|
10.1
|
Harris
& Harris Group, Inc. Form of Custody Agreement with The Bank of New
York Mellon, incorporated by reference as Exhibit 10.1 to the Company's
Annual Report on Form 10-K for the year ended December 31, 2008 (File No.
814-00176) filed on March 16, 2009.
|
|
|
10.2
|
Form
of Indemnification Agreement which has been established with all directors
and executive officers of the Company, incorporated by reference as
Exhibit 10.2 to the Company's Annual Report on Form 10-K for the year
ended December 31, 2008 (File No. 814-00176) filed on March 16,
2009.
|
|
|
10.3
|
Harris
& Harris Group, Inc. Amended and Restated Employee Profit-Sharing
Plan, incorporated by reference as Exhibit 10.8 to the Company's Form 10-K
for the year ended December 31, 2007 (File No. 814-00176) filed on March
13, 2008.
|
|
|
10.4
|
Harris
& Harris Group, Inc. 2006 Equity Incentive Plan, incorporated by
reference as Appendix B to the Company's Proxy Statement for the 2006
Annual Meeting of Shareholders filed on April 3,
2006.
|
|
|
10.5
|
Form
of Incentive Stock Option Agreement incorporated by reference as Exhibit
10.1 to the Company's Form 8-K (File No. 814-00176) filed on June 26,
2006.
|
|
|
10.6
|
Form
of Non-Qualified Stock Option Agreement, incorporated by reference as
Exhibit 10.11 to the Company's Annual Report on Form 10-K for the year
ended December 31, 2008 (File No. 814-00176) filed on March 16,
2009.
|
|
|
10.7
|
Amended
and Restated Harris & Harris Group, Inc. Executive Mandatory
Retirement Benefit Plan, dated November 5, 2009, incorporated by reference
as Exhibit 10.1 to the Company’s Form 8-K (File No. 814-00176) filed on
November 12, 2009.
|
|
|
10.8
|
Agreement
of Sub-Sublease, dated April 18, 2003, by and between Prominent USA, Inc.
and Harris & Harris Group, Inc., incorporated by reference as Exhibit
10.17 to the Company's Form 10-K for the year ended December 31, 2007
(File No. 814-00176) filed on March 13,
2008.
|
|
|
10.9
|
Amendment
to Agreement of Sub-Sublease, dated May 9, 2003, by and between Prominent
USA, Inc., and Harris & Harris Group, Inc., incorporated by reference
as Exhibit 10.18 to the Company's Form 10-K for the year ended December
31, 2007 (File No. 814-00176) filed on March 13,
2008.
|
|
|
10.10
|
Assignment
and Assumption, Modification and Extension of Sublease Agreement, dated
December 17, 2004, by and among the Economist Newspaper Group, Inc.,
National Academy of Television Arts & Sciences, and Harris &
Harris Group, Inc., incorporated by reference as Exhibit 10.19 to the
Company's Form 10-K for the year ended December 31, 2007 (File No.
814-00176) filed on March 13, 2008.
|
|
10.11
|
Lease
dated July 1, 2008 by and between Jack Rominger, Tommie Plemons and Dale
Denson as Lessor and Harris & Harris Group, Inc., a New York
corporation, as Lessee, incorporated by reference as
Exhibit 10.1 to the Company's Form 10-Q (File No. 814-00176)
filed on November 7, 2008.
|
|
|
10.12
|
Lease
Agreement, dated September 24, 2009, between Rosh 1450 Properties LLC and
Harris & Harris Group, Inc., incorporated by reference as Exhibit 10.1
to the Company’s Form 8-K (File No. 814-00176) filed on September 24,
2009.
|
|
10.13
|
Nonsolicitation
and Noncompetition Agreement between the Company and Charles E. Harris,
dated July 31, 2008, incorporated by reference as Exhibit 10 to the
Company's Form 8-K (File No. 814-00176) filed on August 1,
2008.
|
|
10.14*
|
Harris
& Harris Group, Inc. Employee Stock Purchase
Plan.
|
|
|
14.1*
|
Code
of Conduct for Directors and Employees of Harris & Harris Group,
Inc.
|
|
|
14.2*
|
Code
of Ethics Pursuant to Rule 17j-1.
|
|
31.01*
|
Certification
of CEO pursuant to Section 302 of the Sarbanes-Oxley Act of
2002.
|
|
31.02*
|
Certification
of CFO pursuant to Section 302 of the Sarbanes-Oxley Act of
2002.
|
|
32.01*
|
Certification
of CEO and CFO pursuant to 18 U.S.C. Section 1350, as adopted pursuant to
Section 906 of the Sarbanes-Oxley Act of
2002.
|
|
HARRIS
& HARRIS GROUP, INC.
|
||
|
Date:
March 15, 2010
|
By:
|
/s/ Douglas W. Jamison
|
|
Douglas
W. Jamison
|
||
|
Chairman
of the Board and
|
||
|
Chief
Executive Officer
|
||
|
Signatures
|
Title
|
Date
|
||
|
/s/ Douglas W. Jamison
|
Chairman
of the Board
|
March
15, 2010
|
||
|
Douglas
W. Jamison
|
and
Chief Executive Officer
|
|||
|
/s/ Daniel B. Wolfe
|
Chief
Financial Officer
|
March
15, 2010
|
||
|
Daniel
B. Wolfe
|
||||
|
/s/ Patricia N. Egan
|
Chief
Accounting Officer
|
March
15, 2010
|
||
|
Patricia
N. Egan
|
and
Senior Controller
|
|||
|
/s/ W. Dillaway Ayres, Jr.
|
Director
|
March
15, 2010
|
||
|
W.
Dillaway Ayres, Jr.
|
||||
|
/s/ C. Wayne Bardin
|
Director
|
March
15, 2010
|
||
|
C.
Wayne Bardin
|
|
/s/ Phillip A. Bauman
|
Director
|
March
15, 2010
|
||
|
Phillip
A. Bauman
|
||||
|
/s/ G. Morgan Browne
|
Director
|
March
15, 2010
|
||
|
G.
Morgan Browne
|
||||
|
/s/ Dugald A. Fletcher
|
Director
|
March
15, 2010
|
||
|
Dugald
A. Fletcher
|
||||
|
/s/ Lori D. Pressman
|
Director
|
March
15, 2010
|
||
|
Lori
D. Pressman
|
||||
|
/s/ Charles E. Ramsey
|
Director
|
March
15, 2010
|
||
|
Charles
E. Ramsey
|
||||
|
/s/ James E. Roberts
|
Director
|
March
15, 2010
|
||
|
James
E. Roberts
|
||||
|
/s/ Richard P. Shanley
|
Director
|
March
15, 2010
|
||
|
Richard
P. Shanley
|
|
Exhibit No.
|
Description
|
|
|
10.14
|
Harris
& Harris Group, Inc. Employee Stock Purchase Plan
|
|
|
14.1
|
Code
of Conduct for Directors and Employees of Harris & Harris Group,
Inc.
|
|
|
14.2
|
Code
of Ethics Pursuant to Rule 17j-1.
|
|
|
31.01
|
Certification
of CEO pursuant to Section 302 of the Sarbanes-Oxley Act of
2002.
|
|
|
31.02
|
Certification
of CFO pursuant to Section 302 of the Sarbanes-Oxley Act of
2002.
|
|
|
32.01
|
|
Certification
of CEO and CFO pursuant to 18 U.S.C. Section 1350, as adopted pursuant to
Section 906 of the Sarbanes-Oxley Act of
2002.
|