|
HARRIS & HARRIS GROUP,
INC.
|
|
(Exact
Name of Registrant as Specified in Its
Charter)
|
|
New York
|
13-3119827
|
|
(State
or Other Jurisdiction of
|
(I.R.S.
Employer Identification No.)
|
|
Incorporation
or Organization)
|
|
1450 Broadway, New York, New
York
|
10018
|
|
|
(Address
of Principal Executive Offices)
|
(Zip
Code)
|
|
(212) 582-0900
|
|
(Registrant's
Telephone Number, Including Area
Code)
|
|
Large
accelerated filer o
|
Accelerated
filer x
|
|
Non-accelerated
filer o
|
Smaller
reporting company ¨
|
|
Class
|
Outstanding at August 6,
2010
|
|
|
Common
Stock, $0.01 par value per share
|
30,864,899
shares
|
|
Page
Number
|
||
|
PART
I. FINANCIAL INFORMATION
|
||
|
Item
1. Consolidated Financial Statements
|
1
|
|
|
Consolidated
Statements of Assets and Liabilities
|
2
|
|
|
Consolidated
Statements of Operations
|
3
|
|
|
Consolidated
Statements of Cash Flows
|
4
|
|
|
Consolidated
Statements of Changes in Net Assets
|
5
|
|
|
Consolidated
Schedule of Investments
|
6
|
|
|
Notes
to Consolidated Financial Statements
|
32
|
|
|
Financial
Highlights
|
42
|
|
|
Item
2. Management's Discussion and Analysis of Financial Condition
and
Results of Operations
|
43
|
|
|
Background
and Overview
|
43
|
|
|
Investment
Strategy
|
44
|
|
|
Historical
Investments
|
45
|
|
|
Investment
Pace
|
45
|
|
|
Importance
of Availability of Liquid Capital
|
46
|
|
|
Involvement
with Portfolio Companies
|
47
|
|
|
Commercialization
of Nanotechnology by Our Portfolio Companies
|
47
|
|
|
Maturity
of Current Venture Capital Portfolio
|
50
|
|
|
Current
Business Environment
|
52
|
|
|
Valuation
of Investments
|
53
|
|
|
Investment
Objective
|
57
|
|
|
Results
of Operations
|
57
|
|
|
Financial
Condition
|
65
|
|
|
Liquidity
|
67
|
|
|
Capital
Resources
|
68
|
|
|
Critical
Accounting Policies
|
68
|
|
|
Recent
Developments – Portfolio Companies
|
71
|
|
|
Recent
Developments – Other
|
71
|
|
|
Forward-Looking
Statements
|
71
|
|
|
Item
3. Quantitative and Qualitative Disclosures About Market
Risk
|
72
|
|
|
Item
4. Controls and Procedures
|
73
|
|
|
PART
II. OTHER INFORMATION
|
||
|
Item
1A. Risk Factors
|
74
|
|
|
Item
5. Exhibits
|
75
|
|
|
Signatures
|
76
|
|
|
Exhibit
Index
|
77
|
|
HARRIS
& HARRIS GROUP, INC.
CONSOLIDATED
STATEMENTS OF ASSETS AND
LIABILITIES
|
|
June 30, 2010
|
December 31, 2009
|
|||||||
|
(Unaudited)
|
||||||||
|
ASSETS
|
||||||||
|
Investments,
in portfolio securities at value:
|
||||||||
|
Unaffiliated
privately held companies
|
||||||||
|
(cost:
$30,719,854 and $26,977,200, respectively)
|
$ | 24,677,744 | $ | 21,656,436 | ||||
|
Unaffiliated
publicly traded securities
|
||||||||
|
(cost:
$0 and $298,827, respectively)
|
0 | 226,395 | ||||||
|
Non-controlled
affiliated privately held companies
|
||||||||
|
(cost:
$59,493,753 and $54,864,948, respectively)
|
61,463,821 | 50,297,220 | ||||||
|
Controlled
affiliated privately held companies
|
||||||||
|
(cost:
$7,871,243 and $10,248,932, respectively)
|
5,898,432 | 5,843,430 | ||||||
|
Total,
investments in privately held and publicly
|
||||||||
|
traded
securities at value
|
||||||||
|
(cost:
$98,084,850 and $92,389,907, respectively)
|
$ | 92,039,997 | $ | 78,023,481 | ||||
|
Investments,
in U.S. Treasury obligations at value
|
||||||||
|
(cost:
$45,948,517 and $55,960,024, respectively)
|
45,930,735 | 55,947,581 | ||||||
|
Cash
|
2,553,490 | 1,611,465 | ||||||
|
Restricted
funds
|
2,000 | 2,000 | ||||||
|
Receivable
from portfolio company
|
0 | 28,247 | ||||||
|
Interest
receivable
|
4 | 25,832 | ||||||
|
Prepaid
expenses
|
241,485 | 94,129 | ||||||
|
Other
assets
|
691,725 | 376,366 | ||||||
|
Total
assets
|
$ | 141,459,436 | $ | 136,109,101 | ||||
|
LIABILITIES & NET
ASSETS
|
||||||||
|
Post
retirement plan liabilities
|
$ | 1,437,413 | $ | 1,369,843 | ||||
|
Accounts
payable and accrued liabilities
|
488,544 | 579,162 | ||||||
|
Deferred
rent
|
350,631 | 1,838 | ||||||
|
Total
liabilities
|
2,276,588 | 1,950,843 | ||||||
|
Net
assets
|
$ | 139,182,848 | $ | 134,158,258 | ||||
|
Net
assets are comprised of:
|
||||||||
|
Preferred
stock, $0.10 par value,
|
||||||||
|
2,000,000
shares authorized; none issued
|
$ | 0 | $ | 0 | ||||
|
Common
stock, $0.01 par value, 45,000,000 shares authorized at
|
||||||||
|
06/30/10
and 12/31/09; 32,693,639 issued at 06/30/10
|
||||||||
|
and
32,688,333 issued at 12/31/09
|
326,937 | 326,884 | ||||||
|
Additional
paid in capital (Note 8)
|
207,162,971 | 205,977,117 | ||||||
|
Accumulated
net operating and realized loss
|
(58,838,894 | ) | (54,361,343 | ) | ||||
|
Accumulated
unrealized depreciation of investments
|
(6,062,635 | ) | (14,378,869 | ) | ||||
|
Treasury
stock, at cost (1,828,740 shares at 06/30/10 and 12/31/09)
|
(3,405,531 | ) | (3,405,531 | ) | ||||
|
Net
assets
|
$ | 139,182,848 | $ | 134,158,258 | ||||
|
Shares
outstanding
|
30,864,899 | 30,859,593 | ||||||
|
Net
asset value per outstanding share
|
$ | 4.51 | $ | 4.35 | ||||
|
HARRIS
& HARRIS GROUP, INC.
CONSOLIDATED
STATEMENTS OF OPERATIONS
(Unaudited)
|
|
Three Months Ended June 30,
|
Six Months Ended June 30,
|
|||||||||||||||
|
2010
|
2009
|
2010
|
2009
|
|||||||||||||
|
Investment
income:
|
||||||||||||||||
|
Interest
from:
|
||||||||||||||||
|
Fixed-income
securities and bridge notes (Note 3)
|
$ | 123,208 | $ | 75,084 | $ | 196,281 | $ | 39,185 | ||||||||
|
Miscellaneous
income
|
6,000 | 8,750 | 12,000 | 21,088 | ||||||||||||
|
Total
investment income
|
129,208 | 83,834 | 208,281 | 60,273 | ||||||||||||
|
Expenses:
|
||||||||||||||||
|
Salaries,
benefits and stock-based compensation (Note 6)
|
1,465,520 | 1,506,597 | 2,854,797 | 2,893,937 | ||||||||||||
|
Administration
and operations
|
228,246 | 231,161 | 510,768 | 521,596 | ||||||||||||
|
Professional
fees
|
176,866 | 152,291 | 420,235 | 367,541 | ||||||||||||
|
Rent
(Note 3)
|
89,145 | 78,998 | 166,360 | 157,061 | ||||||||||||
|
Directors’
fees and expenses
|
85,560 | 89,100 | 180,921 | 173,609 | ||||||||||||
|
Custody
fees
|
24,000 | 11,080 | 48,000 | 17,942 | ||||||||||||
|
Depreciation
|
13,820 | 12,878 | 25,789 | 25,737 | ||||||||||||
|
Lease
termination costs (Note 3)
|
0 | 0 | 68,038 | 0 | ||||||||||||
|
Total
expenses
|
2,083,157 | 2,082,105 | 4,274,908 | 4,157,423 | ||||||||||||
|
Net
operating loss
|
(1,953,949 | ) | (1,998,271 | ) | (4,066,627 | ) | (4,097,150 | ) | ||||||||
|
Net
realized gain (loss):
|
||||||||||||||||
|
Realized
gain (loss) from investments:
|
||||||||||||||||
|
Unaffiliated
companies
|
13,218 | (1,511,042 | ) | 13,218 | (1,514,330 | ) | ||||||||||
|
Non-Controlled
affiliated companies
|
(257,007 | ) | 0 | (257,007 | ) | 0 | ||||||||||
|
Publicly
traded companies
|
(152,980 | ) | 0 | (152,980 | ) | 0 | ||||||||||
|
U.S.
Treasury obligations/other
|
0 | 0 | (11,523 | ) | (325 | ) | ||||||||||
|
Realized
loss from investments
|
(396,769 | ) | (1,511,042 | ) | (408,292 | ) | (1,514,655 | ) | ||||||||
|
Income
tax expense (Note 7)
|
0 | 1,729 | 2,632 | 2,109 | ||||||||||||
|
Net
realized loss
|
(396,769 | ) | (1,512,771 | ) | (410,924 | ) | (1,516,764 | ) | ||||||||
|
Net
decrease in unrealized depreciation on investments:
|
||||||||||||||||
|
Change
as a result of investment sales
|
222,319 | 1,511,042 | 222,319 | 1,511,042 | ||||||||||||
|
Change
on investments held
|
4,279,351 | 2,421,367 | 8,093,915 | 3,572,815 | ||||||||||||
|
Net
decrease in unrealized depreciation on investments
|
4,501,670 | 3,932,409 | 8,316,234 | 5,083,857 | ||||||||||||
|
Net
increase (decrease) in net assets resulting from
operations
|
$ | 2,150,952 | $ | 421,367 | $ | 3,838,683 | $ | (530,057 | ) | |||||||
|
Per
average basic and diluted outstanding share
|
$ | 0.07 | $ | 0.02 | $ | 0.12 | $ | (0.02 | ) | |||||||
|
Average
outstanding shares
|
30,864,491 | 25,859,573 | 30,862,202 | 25,859,573 | ||||||||||||
|
HARRIS
& HARRIS GROUP, INC.
CONSOLIDATED
STATEMENTS OF CASH FLOWS
(Unaudited)
|
|
Six Months Ended
|
Six Months Ended
|
|||||||
|
June 30, 2010
|
June 30, 2009
|
|||||||
|
Cash
flows used in operating activities:
|
||||||||
|
Net
increase (decrease) in net assets resulting from
operations
|
$ | 3,838,683 | $ | (530,057 | ) | |||
|
Adjustments
to reconcile net increase (decrease) in net assets resulting from
operations to net cash used in operating activities:
|
||||||||
|
Net
realized and unrealized gain on investments
|
(7,907,942 | ) | (3,569,202 | ) | ||||
|
Depreciation
of fixed assets, amortization of premium or discount on U.S. government
securities, and bridge note interest
|
(142,420 | ) | 73,663 | |||||
|
Stock-based
compensation expense
|
1,214,938 | 1,411,917 | ||||||
|
Changes
in assets and liabilities:
|
||||||||
|
Restricted
funds
|
0 | 2,586 | ||||||
|
Receivable
from portfolio company
|
28,247 | 0 | ||||||
|
Interest
receivable
|
26,234 | 4,317 | ||||||
|
Prepaid
expenses
|
(147,356 | ) | 252,454 | |||||
|
Other
assets
|
(264,374 | ) | 3,312 | |||||
|
Post
retirement plan liabilities
|
67,570 | 60,514 | ||||||
|
Accounts
payable and accrued liabilities
|
(90,618 | ) | (210,977 | ) | ||||
|
Deferred
rent
|
348,793 | (3,151 | ) | |||||
|
Net
cash used in operating activities
|
(3,028,245 | ) | (2,504,624 | ) | ||||
|
Cash
flows from investing activities:
|
||||||||
|
Purchase
of U.S. government securities
|
(58,644,919 | ) | (103,318,117 | ) | ||||
|
Sale
of U.S. government securities
|
68,646,697 | 109,851,434 | ||||||
|
Investments
in affiliated portfolio companies
|
(5,469,691 | ) | (3,052,065 | ) | ||||
|
Investments
in unaffiliated portfolio companies
|
(857,473 | ) | (399,484 | ) | ||||
|
Proceeds
from conversion of bridge note
|
1,356 | 0 | ||||||
|
Proceeds
from sale of investments
|
407,543 | 3,250 | ||||||
|
Purchase
of fixed assets
|
(84,212 | ) | (1,313 | ) | ||||
|
Net
cash provided by investing activities
|
3,999,301 | 3,083,705 | ||||||
|
Cash
flows from financing activities:
|
||||||||
|
Proceeds
from stock option exercises
|
19,897 | 0 | ||||||
|
Payment
of offering costs
|
(48,928 | ) | 0 | |||||
|
Net
cash used in financing activities
|
(29,031 | ) | 0 | |||||
|
Net
decrease in cash:
|
||||||||
|
Cash
at beginning of the period
|
1,611,465 | 692,309 | ||||||
|
Cash
at end of the period.
|
2,553,490 | 1,271,390 | ||||||
|
Net
increase in cash
|
$ | 942,025 | $ | 579,081 | ||||
|
Supplemental
disclosures of cash flow information:
|
||||||||
|
Income
taxes paid
|
$ | 2,632 | $ | 2,109 | ||||
|
HARRIS
& HARRIS GROUP, INC.
CONSOLIDATED
STATEMENTS OF CHANGES IN NET
ASSETS
|
|
Six Months Ended
|
Year Ended
|
|||||||
|
June 30, 2010
|
December 31, 2009
|
|||||||
|
(Unaudited)
|
||||||||
|
Changes
in net assets from operations:
|
||||||||
|
Net
operating loss
|
$ | (4,066,627 | ) | $ | (8,761,215 | ) | ||
|
Net
realized loss on investments
|
(410,924 | ) | (11,105,577 | ) | ||||
|
Net
decrease in unrealized depreciation on investments as a result of
sales
|
222,319 | 11,090,579 | ||||||
|
Net
decrease in unrealized depreciation on investments held
|
8,093,915 | 8,627,748 | ||||||
|
Net
increase (decrease) in net assets resulting from
operations
|
3,838,683 | (148,465 | ) | |||||
|
Changes
in net assets from capital stock transactions:
|
||||||||
|
Issuance
of common stock upon the exercise of stock options
|
53 | 1,125 | ||||||
|
Issuance
of common stock on offering
|
0 | 48,875 | ||||||
|
Additional
paid-in capital on common stock issued and options
exercised
|
(29,084 | ) | 21,636,090 | |||||
|
Stock-based
compensation expense
|
1,214,938 | 3,089,520 | ||||||
|
Net
increase in net assets resulting from capital stock
transactions
|
1,185,907 | 24,775,610 | ||||||
|
Net
increase in net assets
|
5,024,590 | 24,627,145 | ||||||
|
Net
assets:
|
||||||||
|
Beginning
of the period
|
134,158,258 | 109,531,113 | ||||||
|
End
of the period
|
$ | 139,182,848 | $ | 134,158,258 | ||||
|
HARRIS
& HARRIS GROUP, INC.
CONSOLIDATED
SCHEDULE OF INVESTMENTS AS OF JUNE 30, 2010
(Unaudited)
|
|
Method of
|
Shares/
|
|||||||||
|
Valuation (1)
|
Principal
|
Value
|
||||||||
|
Investments
in Unaffiliated Companies (2)(3) – 17.7% of net assets at
value
|
||||||||||
|
Private
Placement Portfolio (Illiquid) – 17.7% of net assets at
value
|
||||||||||
|
BioVex
Group, Inc. (4)(5)(6)(7) — Developing novel biologics for treatment of
cancer and infectious disease
|
||||||||||
|
Series
E Convertible Preferred Stock
|
(M)
|
2,799,552 | $ | 1,303,577 | ||||||
|
Series
G Convertible Preferred Stock
|
(M)
|
5,425,574 | 1,139,371 | |||||||
|
Warrants
at $0.21 expiring 11/5/16
|
(I)
|
285,427 | 24,547 | |||||||
| 2,467,495 | ||||||||||
|
Bridgelux,
Inc. (4)(5) — Manufacturing high-power light emitting diodes (LEDs) and
arrays
|
||||||||||
|
Series
B Convertible Preferred Stock
|
(M)
|
1,861,504 | 1,759,121 | |||||||
|
Series
C Convertible Preferred Stock
|
(M)
|
2,130,699 | 2,013,511 | |||||||
|
Series
D Convertible Preferred Stock
|
(M)
|
999,999 | 944,998 | |||||||
|
Warrants
at $0.7136 expiring 12/31/14
|
( I
)
|
163,900 | 86,867 | |||||||
|
Warrants
at $1.50 expiring 8/26/14
|
( I
)
|
166,665 | 58,500 | |||||||
| 4,862,997 | ||||||||||
|
Cobalt
Technologies, Inc. (4)(5)(6)(8) — Developing processes for making
biobutanol through biomass fermentation
|
||||||||||
|
Series
C Convertible Preferred Stock
|
(M)
|
352,112 | 375,000 | |||||||
|
Ensemble
Therapeutics Corporation (4)(5)(9) — Developing DNA- Programmed
ChemistryTM
for the discovery of new classes of therapeutics
|
||||||||||
|
Series
B Convertible Preferred Stock
|
(M)
|
1,449,275 | 2,000,000 | |||||||
|
Unsecured
Convertible Bridge Note (including interest)
|
(M)
|
$ | 299,169 | 337,440 | ||||||
| 2,337,440 | ||||||||||
|
Molecular
Imprints, Inc. (4)(5) — Manufacturing nanoimprint lithography capital
equipment
|
||||||||||
|
Series
B Convertible Preferred Stock
|
(M)
|
1,333,333 | 2,000,000 | |||||||
|
Series
C Convertible Preferred Stock
|
(M)
|
1,250,000 | 1,875,000 | |||||||
|
Warrants
at $2.00 expiring 12/31/11
|
( I
)
|
125,000 | 78,000 | |||||||
| 3,953,000 | ||||||||||
|
HARRIS
& HARRIS GROUP, INC.
CONSOLIDATED SCHEDULE OF
INVESTMENTS AS OF JUNE 30,
2010
(Unaudited)
|
|
Method of
|
Shares/
|
|||||||||
|
Valuation (1)
|
Principal
|
Value
|
||||||||
|
Investments
in Unaffiliated Companies (2)(3) – 17.7% of net assets at value
(Cont.)
|
||||||||||
|
Private
Placement Portfolio (Illiquid) – 17.7% of net assets at value
(Cont.)
|
||||||||||
|
Nanosys,
Inc. (4)(5) — Developing inorganic materials and devices based on
nanowires and quantum dots
|
||||||||||
|
Series
C Convertible Preferred Stock
|
(M)
|
803,428 | $ | 1,021,835 | ||||||
|
Series
D Convertible Preferred Stock
|
(M)
|
1,016,950 | 1,382,573 | |||||||
| 2,404,408 | ||||||||||
|
Nantero,
Inc. (4)(5)(6) — Developing a high-density, nonvolatile, random access
memory chip, enabled by carbon nanotubes
|
||||||||||
|
Series
A Convertible Preferred Stock
|
(M)
|
345,070 | 1,046,908 | |||||||
|
Series
B Convertible Preferred Stock
|
(M)
|
207,051 | 628,172 | |||||||
|
Series
C Convertible Preferred Stock
|
(M)
|
188,315 | 571,329 | |||||||
| 2,246,409 | ||||||||||
|
NeoPhotonics
Corporation (4)(5) — Developing and manufacturing optical devices and
components
|
||||||||||
|
Common
Stock
|
(M)
|
1,130,440 | 759,656 | |||||||
|
Series
1 Convertible Preferred Stock
|
(M)
|
1,831,256 | 1,230,604 | |||||||
|
Series
2 Convertible Preferred Stock
|
(M)
|
741,898 | 498,555 | |||||||
|
Series
3 Convertible Preferred Stock
|
(M)
|
2,750,000 | 1,848,000 | |||||||
|
Series
X Convertible Preferred Stock
|
(M)
|
8,923 | 1,427,680 | |||||||
| 5,764,495 | ||||||||||
|
Polatis,
Inc. (4)(5)(6) — Developing MEMS-based optical networking
components
|
||||||||||
|
Common
Stock
|
(M)
|
16,438 | 0 | |||||||
|
Series
A-1 Convertible Preferred Stock
|
(M)
|
16,775 | 0 | |||||||
|
Series
A-2 Convertible Preferred Stock
|
(M)
|
71,611 | 0 | |||||||
|
Series
A-4 Convertible Preferred Stock
|
(M)
|
4,774 | 0 | |||||||
| 0 | ||||||||||
|
PolyRemedy,
Inc. (4)(5)(6) — Developing a platform for producing and tracking the use
of wound treatment patches
|
||||||||||
|
Series
B-1 Convertible Preferred Stock
|
(M)
|
287,647 | 0 | |||||||
|
Series
B-2 Convertible Preferred Stock
|
(M)
|
676,147 | 0 | |||||||
| 0 | ||||||||||
|
HARRIS
& HARRIS GROUP, INC.
CONSOLIDATED SCHEDULE OF
INVESTMENTS AS OF JUNE 30,
2010
(Unaudited)
|
|
Method of
|
Shares/
|
|||||||||
|
Valuation (1)
|
Principal
|
Value
|
||||||||
|
Investments
in Unaffiliated Companies (2)(3) – 17.7% of net assets at value
(Cont.)
|
||||||||||
|
Private
Placement Portfolio (Illiquid) – 17.7% of net assets at value
(Cont.)
|
||||||||||
|
Siluria
Technologies, Inc. (4)(5)(6) — Developing nanomaterials for manufacturing
of chemicals
|
||||||||||
|
Series
S-2 Convertible Preferred Stock
|
(M)
|
612,061 | $ | 204,000 | ||||||
|
TetraVitae
Bioscience, Inc. (4)(5)(6)(10) — Developing methods of producing
alternative chemicals and fuels through biomass
fermentation
|
||||||||||
|
Series
B Convertible Preferred Stock
|
(M)
|
118,804 | 62,500 | |||||||
|
Total
Unaffiliated Private Placement Portfolio (cost:
$30,719,854)
|
$ | 24,677,744 | ||||||||
|
Total
Investments in Unaffiliated Companies (cost: $30,719,854)
|
$ | 24,677,744 | ||||||||
|
HARRIS
& HARRIS GROUP, INC.
CONSOLIDATED
SCHEDULE OF INVESTMENTS AS OF JUNE 30, 2010
(Unaudited)
|
|
Method of
|
Shares/
|
|||||||||
|
Valuation (1)
|
Principal
|
Value
|
||||||||
|
Investments
in Non-Controlled Affiliated Companies (2)(11) – 44.2% of net assets at
value
|
||||||||||
|
Private Placement
Portfolio (Illiquid) – 44.2% of net
assets at
value
|
||||||||||
|
ABS
Materials, Inc. (4)(5)(6)(12) — Developing nano-structured absorbent
materials for environmental remediation and for the petroleum
industry
|
||||||||||
|
Series
A Convertible Preferred Stock
|
(M)
|
375,000 | $ | 375,000 | ||||||
|
Adesto
Technologies Corporation (4)(5)(6) — Developing
low-power, high-performance memory devices
|
||||||||||
|
Series
A Convertible Preferred Stock
|
(M)
|
6,547,619 | 2,420,000 | |||||||
|
Series
B Convertible Preferred Stock
|
(M)
|
5,952,381 | 2,200,000 | |||||||
| 4,620,000 | ||||||||||
|
Cambrios
Technologies Corporation (4)(5)(6) — Developing nanowire-enabled
electronic materials for the display industry
|
||||||||||
|
Series
B Convertible Preferred Stock
|
(M)
|
1,294,025 | 647,013 | |||||||
|
Series
C Convertible Preferred Stock
|
(M)
|
1,300,000 | 650,000 | |||||||
|
Series
D Convertible Preferred Stock
|
(M)
|
515,756 | 257,878 | |||||||
| 1,554,891 | ||||||||||
|
Contour
Energy Systems, Inc. (4)(5)(6)(13) — Developing batteries
using nanostructured materials
|
||||||||||
|
Series
A Convertible Preferred Stock
|
(M)
|
2,565,798 | 2,822,378 | |||||||
|
Series
B Convertible Preferred Stock
|
(M)
|
812,500 | 1,300,000 | |||||||
| 4,122,378 | ||||||||||
|
Crystal
IS, Inc. (4)(5) — Developing single-crystal aluminum nitride substrates
for light-emitting diodes
|
||||||||||
|
Common
Stock
|
(M)
|
3,994,468 | 0 | |||||||
|
Warrants
at $0.78 expiring 05/05/13
|
( I
)
|
15,231 | 0 | |||||||
|
Warrants
at $0.78 expiring 05/12/13
|
( I
)
|
2,350 | 0 | |||||||
|
Warrants
at $0.78 expiring 08/08/13
|
( I
)
|
4,396 | 0 | |||||||
| 0 | ||||||||||
|
HARRIS
& HARRIS GROUP, INC.
CONSOLIDATED
SCHEDULE OF INVESTMENTS AS OF JUNE 30, 2010
(Unaudited)
|
|
Method of
|
Shares/
|
|||||||||
|
Valuation (1)
|
Principal
|
Value
|
||||||||
|
Investments
in Non-Controlled Affiliated Companies (2)(11) – 44.2% of net assets at
value (Cont.)
|
||||||||||
|
Private Placement
Portfolio (Illiquid) – 44.2% of net
assets at value (Cont.)
|
||||||||||
|
D-Wave
Systems, Inc. (4)(5)(6)(14) — Developing high- performance quantum
computing systems
|
||||||||||
|
Series
B Convertible Preferred Stock
|
(M)
|
1,144,869 | $ | 1,209,783 | ||||||
|
Series
C Convertible Preferred Stock
|
(M)
|
450,450 | 475,991 | |||||||
|
Series
D Convertible Preferred Stock
|
(M)
|
1,533,395 | 1,620,339 | |||||||
| 3,306,113 | ||||||||||
|
Enumeral
Technologies, Inc. (4)(5)(6) — Developing therapeutics and diagnostics
through functional assaying of single cells
|
||||||||||
|
Unsecured
Convertible Bridge Note (including interest)
|
(M)
|
$ | 250,000 | 260,411 | ||||||
|
Innovalight,
Inc. (4)(5)(6) — Developing silicon-based nanomaterials for use in the
solar energy industry
|
||||||||||
|
Series
B Convertible Preferred Stock
|
(M)
|
16,666,666 | 2,969,667 | |||||||
|
Series
C Convertible Preferred Stock
|
(M)
|
5,810,577 | 1,276,457 | |||||||
|
Series
D Convertible Preferred Stock
|
(M)
|
4,046,974 | 721,090 | |||||||
| 4,967,214 | ||||||||||
|
Kovio,
Inc. (4)(5) — Developing semiconductor products using printed electronics
and thin-film technologies
|
||||||||||
|
Series
A' Convertible Preferred Stock
|
(M)
|
2,686,225 | 1,343,113 | |||||||
|
Mersana
Therapeutics, Inc. (4)(5)(6) — Developing treatments for cancer based on
novel drug delivery polymers
|
||||||||||
|
Series
A Convertible Preferred Stock
|
(M)
|
68,451 | 136,902 | |||||||
|
Series
B Convertible Preferred Stock
|
(M)
|
866,500 | 1,733,000 | |||||||
|
Unsecured
Convertible Bridge Note (including interest)
|
(M)
|
$ | 821,975 | 919,514 | ||||||
|
Warrants
at $2.00 expiring 10/21/10
|
( I
)
|
91,625 | 42,972 | |||||||
| 2,832,388 | ||||||||||
|
HARRIS
& HARRIS GROUP, INC.
CONSOLIDATED
SCHEDULE OF INVESTMENTS AS OF JUNE 30, 2010
(Unaudited)
|
|
Method of
|
Shares/
|
|||||||||
|
Valuation (1)
|
Principal
|
Value
|
||||||||
|
Investments
in Non-Controlled Affiliated Companies (2)(11) – 44.2% of net assets at
value (Cont.)
|
||||||||||
|
Private Placement
Portfolio (Illiquid) – 44.2% of net
assets at value (Cont.)
|
||||||||||
|
Metabolon,
Inc. (4)(5) — Developing service and diagnostic products through the use
of a metabolomics, or biochemical, profiling platform
|
||||||||||
|
Series
B Convertible Preferred Stock
|
(M)
|
371,739 | $ | 1,087,870 | ||||||
|
Series
B-1 Convertible Preferred Stock
|
(M)
|
148,696 | 435,149 | |||||||
|
Series
C Convertible Preferred Stock
|
(M)
|
1,000,000 | 1,000,000 | |||||||
|
Warrants
at $1.15 expiring 3/25/15
|
( I
)
|
74,348 | 106,394 | |||||||
| 2,629,413 | ||||||||||
|
NanoGram
Corporation (4)(5)(15) — Developed solar power products enabled by
silicon-based nanomaterials
|
||||||||||
|
Common
Stock
|
(M)
|
2,988,437 | 0 | |||||||
| 0 | ||||||||||
|
Nextreme
Thermal Solutions, Inc. (4)(5) — Developing thin-film thermoelectric
devices for cooling and energy conversion
|
||||||||||
|
Series
A Convertible Preferred Stock
|
(M)
|
17,500 | 437,500 | |||||||
|
Series
B Convertible Preferred Stock
|
(M)
|
4,870,244 | 663,814 | |||||||
| 1,101,314 | ||||||||||
|
Questech
Corporation (4)(5) — Manufacturing and marketing proprietary metal and
stone products for home decoration
|
||||||||||
|
Common
Stock
|
(M)
|
655,454 | 363,121 | |||||||
|
SiOnyx,
Inc. (4)(5)(6) — Developing silicon-based optoelectronic products enabled
by its proprietary "Black Silicon"
|
||||||||||
|
Series
A Convertible Preferred Stock
|
(M)
|
233,499 | 160,367 | |||||||
|
Series
A-1 Convertible Preferred Stock
|
(M)
|
2,966,667 | 2,037,507 | |||||||
|
Series
A-2 Convertible Preferred Stock
|
(M)
|
4,207,537 | 2,889,736 | |||||||
|
Series
B-1 Convertible Preferred Stock
|
(M)
|
1,892,836 | 1,300,000 | |||||||
|
Warrants
at $0.6868 expiring 2/23/17
|
( I
)
|
247,350 | 143,463 | |||||||
| 6,531,073 | ||||||||||
|
HARRIS
& HARRIS GROUP, INC.
CONSOLIDATED
SCHEDULE OF INVESTMENTS AS OF JUNE 30, 2010
(Unaudited)
|
|
Method of
|
Shares/
|
|||||||||
|
Valuation (1)
|
Principal
|
Value
|
||||||||
|
Investments
in Non-Controlled Affiliated Companies (2)(11) – 44.2% of net assets at
value (Cont.)
|
||||||||||
|
Private Placement
Portfolio (Illiquid) – 44.2% of net
assets at value (Cont.)
|
||||||||||
|
Solazyme,
Inc. (4)(5)(6) — Developing algal biodiesel, industrial chemicals and
specialty ingredients using synthetic biology
|
||||||||||
|
Series
A Convertible Preferred Stock
|
(M)
|
988,204 | $ | 8,750,744 | ||||||
|
Series
B Convertible Preferred Stock
|
(M)
|
495,246 | 4,385,502 | |||||||
|
Series
C Convertible Preferred Stock
|
(M)
|
651,309 | 5,767,471 | |||||||
|
Series
D Convertible Preferred Stock
|
(M)
|
169,390 | 1,499,991 | |||||||
| 20,403,708 | ||||||||||
|
Xradia,
Inc. (4)(5) — Designing, manufacturing and selling ultra-high resolution
3D x-ray microscopes and fluorescence imaging systems
|
||||||||||
|
Series
D Convertible Preferred Stock
|
(M)
|
3,121,099 | 7,053,684 | |||||||
|
Total
Non-Controlled Private Placement Portfolio (cost:
$59,493,753)
|
$ | 61,463,821 | ||||||||
|
Total
Investments in Non-Controlled Affiliated Companies (cost:
$59,493,753)
|
$ | 61,463,821 | ||||||||
|
HARRIS
& HARRIS GROUP, INC.
CONSOLIDATED
SCHEDULE OF INVESTMENTS AS OF JUNE 30, 2010
(Unaudited)
|
|
Method of
|
Shares/
|
|||||||||
|
Valuation (1)
|
Principal
|
Value
|
||||||||
|
Investments
in Controlled Affiliated Companies (2)(16) – 4.2% of net assets at
value
|
||||||||||
|
Private Placement
Portfolio (Illiquid) – 4.2% of
net assets at
value
|
||||||||||
|
Ancora
Pharmaceuticals Inc. (4)(5)(6) — Developing synthetic carbohydrates
for pharmaceutical applications
|
||||||||||
|
Series
B Convertible Preferred Stock
|
(M)
|
1,663,808 | $ | 17,374 | ||||||
|
Series
C Convertible Preferred Stock
|
(M)
|
2,066,051 | 1,239,632 | |||||||
|
Secured
Convertible Bridge Note (including interest)
|
(M)
|
$ | 1,100,000 | 1,126,630 | ||||||
| 2,383,636 | ||||||||||
|
Laser
Light Engines, Inc. (4)(5)(6) — Manufacturing solid-state light sources
for digital cinema and large-venue projection displays
|
||||||||||
|
Series
A Convertible Preferred Stock
|
(M)
|
7,499,062 | 1,500,000 | |||||||
|
Secured
Convertible Bridge Note (including interest)
|
(M)
|
$ | 1,890,000 | 2,014,796 | ||||||
| 3,514,796 | ||||||||||
|
Total
Controlled Private Placement Portfolio (cost: $7,871,243)
|
$ | 5,898,432 | ||||||||
|
Total
Investments in Controlled Affiliated Companies (cost:
$7,871,243)
|
$ | 5,898,432 | ||||||||
|
Total
Private Placement Portfolio (cost: $98,084,850)
|
$ | 92,039,997 | ||||||||
|
HARRIS
& HARRIS GROUP, INC.
CONSOLIDATED
SCHEDULE OF INVESTMENTS AS OF JUNE 30, 2010
(Unaudited)
|
|
Method
of
|
Shares/
|
|||||||||
|
Valuation (1)
|
Principal
|
Value
|
||||||||
|
U.S.
Government Securities (17) – 33.0% of net assets at value
|
||||||||||
|
U.S.
Treasury Bill — due date 10/07/10
|
(M)
|
$ | 7,700,000 | $ | 7,696,689 | |||||
|
U.S.
Treasury Bill — due date 01/13/11
|
(M)
|
38,275,000 | 38,234,046 | |||||||
|
Total
Investments in U.S. Government Securities (cost:
$45,948,517)
|
$ | 45,930,735 | ||||||||
|
Total
Investments (cost: $144,033,367)
|
$ | 137,970,732 | ||||||||
|
HARRIS
& HARRIS GROUP, INC.
CONSOLIDATED
SCHEDULE OF INVESTMENTS AS OF JUNE 30, 2010
(Unaudited)
|
|
(1)
|
See
Footnote to Consolidated Schedule of Investments on page 28 for a
description of the Valuation
Procedures.
|
|
(2)
|
Investments
in unaffiliated companies consist of investments in which we own less than
five percent of the voting shares of the portfolio
company. Investments in non-controlled affiliated companies
consist of investments in which we own five percent or more, but less than
25 percent, of the voting shares of the portfolio company, or where we
hold one or more seats on the portfolio company’s Board of Directors but
do not control the company. Investments in controlled
affiliated companies consist of investments in which we own 25 percent or
more of the voting shares of the portfolio company or otherwise control
the company.
|
|
(3)
|
The
aggregate cost for federal income tax purposes of investments in
unaffiliated privately held companies is $30,719,854. The gross
unrealized appreciation based on the tax cost for these securities is
$1,704,447. The gross unrealized depreciation based on the tax cost for
these securities is $7,746,557.
|
|
(4)
|
We
are subject to legal restrictions on the sale of this
investment.
|
|
(5)
|
Represents
a non-income producing security. Equity investments that have
not paid dividends within the last 12 months are considered to be
non-income producing.
|
|
(6)
|
These
investments are development-stage companies. A
development-stage company is defined as a company that is devoting
substantially all of its efforts to establishing a new business, and
either it has not yet commenced its planned principal operations, or it
has commenced such operations but has not realized significant revenue
from them.
|
|
(7)
|
With
our purchase of Series E Convertible Preferred Stock of BioVex, we
received a warrant to purchase a number of shares of common stock of
BioVex as determined by dividing 624,999.99 by the price per share at
which the common stock is offered and sold to the public in connection
with the initial public offering ("IPO"). The ability to exercise
this warrant is therefore contingent on BioVex completing successfully an
IPO before the expiration date of the warrant on September 27,
2012. The exercise price of this warrant shall be 110 percent
of the IPO price.
|
|
(8)
|
Cobalt
Technologies, Inc., also does business as Cobalt
Biofuels.
|
|
(9)
|
On
June 9, 2010, Ensemble Discovery Corporation changed its name to Ensemble
Therapeutics Corporation. With our investment in a convertible
bridge note issued by Ensemble Therapeutics, we received a warrant to
purchase a number of shares of the class of stock sold in the next
financing of Ensemble Therapeutics equal to $149,539.57 divided by the
price per share of the class of stock sold in the next financing of
Ensemble Therapeutics. The ability to exercise this warrant is,
therefore, contingent on Ensemble Therapeutics completing successfully a
subsequent round of financing. This warrant shall expire and no
longer be exercisable on September 10, 2015. The cost basis of
this warrant is $89.86.
|
|
HARRIS
& HARRIS GROUP, INC.
CONSOLIDATED
SCHEDULE OF INVESTMENTS AS OF JUNE 30, 2010
(Unaudited)
|
|
(10)
|
With
our purchase of the Series B Convertible Preferred Stock of TetraVitae
Bioscience, Inc., we received the right to purchase, at a price of
$2.63038528 per share, a number of shares in the Series C financing equal
to the number of shares of Series B Preferred Stock purchased. The
ability to exercise this right is contingent on TetraVitae Bioscience
completing successfully a subsequent round of
financing.
|
|
(11)
|
The
aggregate cost for federal income tax purposes of investments in
non-controlled affiliated companies is $59,493,753. The gross
unrealized appreciation based on the tax cost for these securities is
$20,523,394. The gross unrealized depreciation based on the tax
cost for these securities is
$18,553,326.
|
|
(12)
|
Initial
investment was made during 2010.
|
|
(13)
|
On
February 28, 2008, Lifco, Inc., merged with CFX Battery,
Inc. The surviving entity was CFX Battery, Inc. On
February 24, 2010, CFX Battery, Inc., changed its name to Contour Energy
Systems, Inc.
|
|
(14)
|
D-Wave
Systems, Inc., is located and is doing business primarily in
Canada. We invested in D-Wave Systems, Inc., through
D-Wave USA, a Delaware company. Our investment is denominated
in Canadian dollars and is subject to foreign currency
translation. See "Note 3. Summary of Significant Accounting
Policies."
|
|
(15)
|
On
July 11, 2010, NanoGram was acquired for an undisclosed
amount. Holders of common stock did not receive any proceeds
from this transaction.
|
|
(16)
|
The
aggregate cost for federal income tax purposes of investments in
controlled affiliated companies is $7,871,243. The gross
unrealized appreciation based on the tax cost for these securities is
$0. The gross unrealized depreciation based on the tax cost for
these securities is $1,972,811.
|
|
(17)
|
The
aggregate cost for federal income tax purposes of our U.S. government
securities is $45,948,517. The gross unrealized appreciation on the tax
cost for these securities is $0. The gross unrealized
depreciation on the tax cost of these securities is
$17,782.
|
|
HARRIS
& HARRIS GROUP, INC.
CONSOLIDATED
SCHEDULE OF INVESTMENTS AS OF DECEMBER 31,
2009
|
|
Method of
|
Shares/
|
|||||||||
|
Valuation (1)
|
Principal
|
Value
|
||||||||
|
Investments
in Unaffiliated Companies (2)(3)(4) – 16.3% of net assets at
value
|
||||||||||
|
Private
Placement Portfolio (Illiquid) – 16.1% of net assets at
value
|
||||||||||
|
BioVex
Group, Inc. (5)(6)(7)(8) — Developing novel biologics for treatment of
cancer and infectious disease
|
||||||||||
|
Series
E Convertible Preferred Stock
|
(M)
|
2,799,552 | $ | 1,042,862 | ||||||
|
Series
G Convertible Preferred Stock
|
(M)
|
3,738,004 | 627,985 | |||||||
|
Warrants
at $0.21 expiring 11/5/16
|
( I
)
|
285,427 | 20,836 | |||||||
| 1,691,683 | ||||||||||
|
Cobalt
Technologies, Inc. (5)(6)(7)(9) — Developing processes for making
biobutanol through biomass fermentation
|
||||||||||
|
Series
C Convertible Preferred Stock
|
(M)
|
352,112 | 375,000 | |||||||
|
D-Wave
Systems, Inc. (5)(6)(7)(10) — Developing high- performance quantum
computing systems
|
||||||||||
|
Series
B Convertible Preferred Stock
|
(M)
|
1,144,869 | 907,612 | |||||||
|
Series
C Convertible Preferred Stock
|
(M)
|
450,450 | 357,101 | |||||||
|
Series
D Convertible Preferred Stock
|
(M)
|
1,533,395 | 1,215,622 | |||||||
| 2,480,335 | ||||||||||
|
Molecular
Imprints, Inc. (5)(6) — Manufacturing nanoimprint lithography capital
equipment
|
||||||||||
|
Series
B Convertible Preferred Stock
|
(M)
|
1,333,333 | 2,999,999 | |||||||
|
Series
C Convertible Preferred Stock
|
(M)
|
1,250,000 | 2,812,500 | |||||||
|
Warrants
at $2.00 expiring 12/31/11
|
( I
)
|
125,000 | 163,625 | |||||||
| 5,976,124 | ||||||||||
|
Nanosys,
Inc. (5)(6) — Developing zero and one-dimensional inorganic
nanometer-scale materials and devices
|
||||||||||
|
Series
C Convertible Preferred Stock
|
(M)
|
803,428 | 1,185,056 | |||||||
|
Series
D Convertible Preferred Stock
|
(M)
|
1,016,950 | 1,500,001 | |||||||
| 2,685,057 | ||||||||||
|
HARRIS
& HARRIS GROUP, INC.
CONSOLIDATED SCHEDULE OF
INVESTMENTS AS OF DECEMBER 31,
2009
|
|
Method of
|
Shares/
|
|||||||||
|
Valuation (1)
|
Principal
|
Value
|
||||||||
|
Investments
in Unaffiliated Companies (2)(3)(4) – 16.3% of net assets at value
(Cont.)
|
||||||||||
|
Private
Placement Portfolio (Illiquid) – 16.1% of net assets at value
(Cont.)
|
||||||||||
|
Nantero,
Inc. (5)(6)(7) — Developing a high-density, nonvolatile, random access
memory chip, enabled by carbon nanotubes
|
||||||||||
|
Series
A Convertible Preferred Stock
|
(M)
|
345,070 | $ | 1,046,908 | ||||||
|
Series
B Convertible Preferred Stock
|
(M)
|
207,051 | 628,172 | |||||||
|
Series
C Convertible Preferred Stock
|
(M)
|
188,315 | 571,329 | |||||||
| 2,246,409 | ||||||||||
|
NeoPhotonics
Corporation (5)(6)(11) — Developing and manufacturing optical devices and
components
|
||||||||||
|
Common
Stock
|
(M)
|
1,100,013 | 739,209 | |||||||
|
Series
1 Convertible Preferred Stock
|
(M)
|
1,831,256 | 1,230,604 | |||||||
|
Series
2 Convertible Preferred Stock
|
(M)
|
741,898 | 498,555 | |||||||
|
Series
3 Convertible Preferred Stock
|
(M)
|
2,750,000 | 1,848,000 | |||||||
|
Series
X Convertible Preferred Stock
|
(M)
|
8,923 | 1,427,680 | |||||||
|
Warrants
at $0.15 expiring 01/26/10
|
( I
)
|
16,364 | 11,291 | |||||||
|
Warrants
at $0.15 expiring 12/05/10
|
( I
)
|
14,063 | 9,703 | |||||||
| 5,765,042 | ||||||||||
|
Polatis,
Inc. (5)(6)(7) — Developing MEMS-based optical networking
components
|
||||||||||
|
Series
A-1 Convertible Preferred Stock
|
(M)
|
16,775 | 0 | |||||||
|
Series
A-2 Convertible Preferred Stock
|
(M)
|
71,611 | 0 | |||||||
|
Series
A-4 Convertible Preferred Stock
|
(M)
|
4,774 | 0 | |||||||
|
Series
A-5 Convertible Preferred Stock
|
(M)
|
16,438 | 0 | |||||||
| 0 | ||||||||||
|
PolyRemedy,
Inc. (5)(6)(7) — Developing a robotic manufacturing platform for wound
treatment patches
|
||||||||||
|
Series
B-1 Convertible Preferred Stock
|
(M)
|
287,647 | 46,933 | |||||||
|
Series
B-2 Convertible Preferred Stock
|
(M)
|
676,147 | 60,853 | |||||||
| 107,786 | ||||||||||
|
HARRIS
& HARRIS GROUP, INC.
CONSOLIDATED SCHEDULE OF
INVESTMENTS AS OF DECEMBER 31,
2009
|
|
Method of
|
Shares/
|
|||||||||
|
Valuation (1)
|
Principal
|
Value
|
||||||||
|
Investments
in Unaffiliated Companies (2)(3)(4) – 16.3% of net assets at value
(Cont.)
|
||||||||||
|
Private
Placement Portfolio (Illiquid) – 16.1% of net assets at value
(Cont.)
|
||||||||||
|
Siluria
Technologies, Inc. (5)(6)(7) — Developing next-generation
nanomaterials
|
||||||||||
|
Series
S-2 Convertible Preferred Stock
|
(M)
|
612,061 | $ | 204,000 | ||||||
|
TetraVitae
Bioscience, Inc. (5)(6)(7)(12) — Developing methods of producing
alternative chemicals and fuels through biomass
fermentation
|
||||||||||
|
Series
B Convertible Preferred Stock
|
(M)
|
118,804 | 125,000 | |||||||
|
Total
Unaffiliated Private Placement Portfolio (cost:
$26,977,200)
|
$ | 21,656,436 | ||||||||
|
Publicly
Traded Portfolio (Liquid) – 0.2% of net assets at value
|
||||||||||
|
Orthovita, Inc. (6)(13) —
Developing materials and devices for orthopedic medical implant
applications
|
||||||||||
|
Common
Stock
|
(M)
|
64,500 | 226,395 | |||||||
|
Total
Unaffiliated Publicly Traded Portfolio (cost: $298,827)
|
$ | 226,395 | ||||||||
|
Total
Investments in Unaffiliated Companies (cost: $27,276,027)
|
$ | 21,882,831 | ||||||||
|
HARRIS
& HARRIS GROUP, INC.
CONSOLIDATED
SCHEDULE OF INVESTMENTS AS OF DECEMBER 31,
2009
|
|
Method of
|
Shares/
|
|||||||||
|
Valuation (1)
|
Principal
|
Value
|
||||||||
|
Investments
in Non-Controlled Affiliated Companies (2)(14) – 37.5% of net assets at
value
|
||||||||||
|
Private Placement
Portfolio (Illiquid) – 37.5% of net
assets at
value
|
||||||||||
|
Adesto
Technologies Corporation (5)(6)(7) — Developing
low-power, high-performance memory devices
|
||||||||||
|
Series
A Convertible Preferred Stock
|
(M)
|
6,547,619 | $ | 2,420,000 | ||||||
|
Series
B Convertible Preferred Stock
|
(M)
|
5,952,381 | 2,200,000 | |||||||
| 4,620,000 | ||||||||||
|
Bridgelux,
Inc. (5)(6) — Manufacturing high-power light emitting diodes (LEDs) and
arrays
|
||||||||||
|
Series
B Convertible Preferred Stock
|
(M)
|
1,861,504 | 1,804,914 | |||||||
|
Series
C Convertible Preferred Stock
|
(M)
|
2,130,699 | 2,065,926 | |||||||
|
Series
D Convertible Preferred Stock
|
(M)
|
833,333 | 807,999 | |||||||
|
Warrants
at $0.7136 expiring 12/31/14
|
( I
)
|
163,900 | 98,995 | |||||||
|
Warrants
at $1.50 expiring 8/26/14
|
( I
)
|
124,999 | 55,375 | |||||||
| 4,833,209 | ||||||||||
|
Cambrios
Technologies Corporation (5)(6)(7) — Developing nanowire-enabled
electronic materials for the display industry
|
||||||||||
|
Series
B Convertible Preferred Stock
|
(M)
|
1,294,025 | 647,013 | |||||||
|
Series
C Convertible Preferred Stock
|
(M)
|
1,300,000 | 650,000 | |||||||
|
Series
D Convertible Preferred Stock
|
(M)
|
515,756 | 257,878 | |||||||
| 1,554,891 | ||||||||||
|
CFX
Battery, Inc. (5)(6)(7)(15) — Developing batteries
using nanostructured materials
|
||||||||||
|
Series
A Convertible Preferred Stock
|
(M)
|
2,565,798 | 2,822,378 | |||||||
|
Series
B Convertible Preferred Stock
|
(M)
|
812,500 | 1,300,000 | |||||||
| 4,122,378 | ||||||||||
|
Crystal
IS, Inc. (5)(6) — Developing single-crystal aluminum nitride substrates
for light-emitting diodes
|
||||||||||
|
Common
Stock
|
(M)
|
2,585,657 | 0 | |||||||
|
Warrants
at $0.78 expiring 05/05/13
|
( I
)
|
15,231 | 0 | |||||||
|
Warrants
at $0.78 expiring 05/12/13
|
( I
)
|
2,350 | 0 | |||||||
|
Warrants
at $0.78 expiring 08/08/13
|
( I
)
|
4,396 | 0 | |||||||
| 0 | ||||||||||
|
HARRIS
& HARRIS GROUP, INC.
CONSOLIDATED
SCHEDULE OF INVESTMENTS AS OF DECEMBER 31,
2009
|
|
Method
of
|
Shares/
|
|||||||||
|
Valuation (1)
|
Principal
|
Value
|
||||||||
|
Investments
in Non-Controlled Affiliated Companies (2)(14) – 37.5% of net assets at
value (Cont.)
|
||||||||||
|
Private Placement
Portfolio (Illiquid) – 37.5% of net
assets at value (Cont.)
|
||||||||||
|
Ensemble
Discovery Corporation (5)(6)(16) — Developing DNA- Programmed
ChemistryTM
for the discovery of new classes of therapeutics and
bioassays
|
||||||||||
|
Series
B Convertible Preferred Stock
|
(M)
|
1,449,275 | $ | 1,500,000 | ||||||
|
Unsecured
Convertible Bridge Note (including interest)
|
(M)
|
$ | 299,169 | 325,506 | ||||||
| 1,825,506 | ||||||||||
|
Enumeral
Technologies, Inc. (5)(6)(7)(13) — Developing high-value opportunities in
immunology including therapeutic discovery, immune profiling and
personalized medicine
|
||||||||||
|
Unsecured
Convertible Bridge Note (including interest)
|
(M)
|
$ | 250,000 | 250,438 | ||||||
|
Innovalight,
Inc. (5)(6)(7) — Developing solar power products enabled by silicon-based
nanomaterials
|
||||||||||
|
Series
B Convertible Preferred Stock
|
(M)
|
16,666,666 | 2,969,667 | |||||||
|
Series
C Convertible Preferred Stock
|
(M)
|
5,810,577 | 1,276,457 | |||||||
|
Series
D Convertible Preferred Stock
|
(M)
|
4,046,974 | 721,090 | |||||||
| 4,967,214 | ||||||||||
|
Kovio,
Inc. (5)(6) — Developing semiconductor products using printed electronics
and thin-film technologies
|
||||||||||
|
Series
C Convertible Preferred Stock
|
(M)
|
2,500,000 | 609,943 | |||||||
|
Series
D Convertible Preferred Stock
|
(M)
|
800,000 | 195,182 | |||||||
|
Series
E Convertible Preferred Stock
|
(M)
|
1,200,000 | 1,500,000 | |||||||
|
Warrants
at $1.25 expiring 12/31/12
|
( I
)
|
355,880 | 291,466 | |||||||
| 2,596,591 | ||||||||||
|
Mersana
Therapeutics, Inc. (5)(6)(7) — Developing treatments for cancer based on
novel drug delivery polymers
|
||||||||||
|
Series
A Convertible Preferred Stock
|
(M)
|
68,451 | 68,451 | |||||||
|
Series
B Convertible Preferred Stock
|
(M)
|
866,500 | 866,500 | |||||||
|
Unsecured
Convertible Bridge Note (including interest)
|
(M)
|
$ | 650,000 | 708,165 | ||||||
|
Warrants
at $2.00 expiring 10/21/10
|
( I
)
|
91,625 | 16,218 | |||||||
| 1,659,334 | ||||||||||
|
HARRIS
& HARRIS GROUP, INC.
CONSOLIDATED
SCHEDULE OF INVESTMENTS AS OF DECEMBER 31,
2009
|
|
Method
of
|
Shares/
|
|||||||||
|
Valuation (1)
|
Principal
|
Value
|
||||||||
|
Investments
in Non-Controlled Affiliated Companies (2)(14) – 37.5% of net assets at
value (Cont.)
|
||||||||||
|
Private Placement
Portfolio (Illiquid) – 37.5% of net
assets at value (Cont.)
|
||||||||||
|
Metabolon,
Inc. (5)(6) — Developing service and diagnostic products through the use
of a metabolomics, or biochemical, profiling platform
|
||||||||||
|
Series
B Convertible Preferred Stock
|
(M)
|
371,739 | $ | 1,034,061 | ||||||
|
Series
B-1 Convertible Preferred Stock
|
(M)
|
148,696 | 413,625 | |||||||
|
Series
C Convertible Preferred Stock
|
(M)
|
1,000,000 | 1,000,000 | |||||||
|
Warrants
at $1.15 expiring 3/25/15
|
( I
)
|
74,348 | 112,092 | |||||||
| 2,559,778 | ||||||||||
|
NanoGram
Corporation (5)(6) — Developing solar power products enabled by
silicon-based nanomaterials
|
||||||||||
|
Series
I Convertible Preferred Stock
|
(M)
|
63,210 | 0 | |||||||
|
Series
II Convertible Preferred Stock
|
(M)
|
1,250,904 | 0 | |||||||
|
Series
III Convertible Preferred Stock
|
(M)
|
1,242,144 | 0 | |||||||
|
Series
IV Convertible Preferred Stock
|
(M)
|
432,179 | 0 | |||||||
| 0 | ||||||||||
|
Nextreme
Thermal Solutions, Inc. (5)(6) — Developing thin-film thermoelectric
devices for cooling and energy conversion
|
||||||||||
|
Series
A Convertible Preferred Stock
|
(M)
|
17,500 | 1,750,000 | |||||||
|
Series
B Convertible Preferred Stock
|
(M)
|
4,870,244 | 2,655,257 | |||||||
| 4,405,257 | ||||||||||
|
Questech
Corporation (5)(6) — Manufacturing and marketing proprietary metal and
stone decorative tiles
|
||||||||||
|
Common
Stock
|
(M)
|
655,454 | 425,390 | |||||||
|
Solazyme,
Inc. (5)(6)(7) — Developing algal biodiesel, industrial chemicals and
special ingredients based on synthetic biology
|
||||||||||
|
Series
A Convertible Preferred Stock
|
(M)
|
988,204 | 4,978,157 | |||||||
|
Series
B Convertible Preferred Stock
|
(M)
|
495,246 | 2,494,841 | |||||||
|
Series
C Convertible Preferred Stock
|
(M)
|
651,309 | 3,281,021 | |||||||
| 10,754,019 | ||||||||||
|
HARRIS
& HARRIS GROUP, INC.
CONSOLIDATED
SCHEDULE OF INVESTMENTS AS OF DECEMBER 31,
2009
|
|
Method of
|
Shares/
|
|||||||||
|
Valuation (1)
|
Principal
|
Value
|
||||||||
|
Investments
in Non-Controlled Affiliated Companies (2)(14) – 37.5% of net assets at
value (Cont.)
|
||||||||||
|
Private Placement
Portfolio (Illiquid) – 37.5% of net
assets at value (Cont.)
|
||||||||||
|
Xradia,
Inc. (5)(6) — Designing, manufacturing and selling ultra-high resolution
3D x-ray microscopes and fluorescence imaging systems
|
||||||||||
|
Series
D Convertible Preferred Stock
|
(M)
|
3,121,099 | $ | 5,723,215 | ||||||
|
Total
Non-Controlled Private Placement Portfolio (cost:
$54,864,948)
|
$ | 50,297,220 | ||||||||
|
Total
Investments in Non-Controlled Affiliated Companies (cost:
$54,864,948)
|
$ | 50,297,220 | ||||||||
|
HARRIS
& HARRIS GROUP, INC.
CONSOLIDATED
SCHEDULE OF INVESTMENTS AS OF DECEMBER 31,
2009
|
|
Method
of
|
Shares/
|
|||||||||
|
Valuation (1)
|
Principal
|
Value
|
||||||||
|
Investments
in Controlled Affiliated Companies (2)(17) – 4.40% of net assets at
value
|
||||||||||
|
Private Placement
Portfolio (Illiquid) – 4.40% of
net assets at
value
|
||||||||||
|
Ancora
Pharmaceuticals Inc. (5)(6)(7) — Developing synthetic carbohydrates
for pharmaceutical applications
|
||||||||||
|
Series
B Convertible Preferred Stock
|
(M)
|
1,663,808 | $ | 17,374 | ||||||
|
Series
C Convertible Preferred Stock
|
(M)
|
2,066,051 | 1,239,632 | |||||||
| 1,257,006 | ||||||||||
|
Laser
Light Engines, Inc. (5)(6)(7) — Manufacturing solid-state light sources
for digital cinema and large-venue projection displays
|
||||||||||
|
Series
A Convertible Preferred Stock
|
(M)
|
7,499,062 | 1,000,000 | |||||||
|
Secured
Convertible Bridge Note (including interest)
|
(M)
|
$ | 1,390,000 | 1,434,116 | ||||||
| 2,434,116 | ||||||||||
|
SiOnyx,
Inc. (5)(6)(7) — Developing silicon-based optoelectronic products enabled
by its proprietary "Black Silicon"
|
||||||||||
|
Series
A Convertible Preferred Stock
|
(M)
|
233,499 | 67,843 | |||||||
|
Series
A-1 Convertible Preferred Stock
|
(M)
|
2,966,667 | 861,965 | |||||||
|
Series
A-2 Convertible Preferred Stock
|
(M)
|
4,207,537 | 1,222,500 | |||||||
| 2,152,308 | ||||||||||
|
Total
Controlled Private Placement Portfolio (cost: $10,248,932)
|
$ | 5,843,430 | ||||||||
|
Total
Investments in Controlled Affiliated Companies (cost:
$10,248,932)
|
$ | 5,843,430 | ||||||||
|
Total
Private Placement and Publicly Traded Portfolio (cost:
$92,389,907)
|
$ | 78,023,481 | ||||||||
|
HARRIS & HARRIS GROUP,
INC.
CONSOLIDATED SCHEDULE OF
INVESTMENTS AS OF DECEMBER 31,
2009
|
|
Method of
|
Shares/
|
|||||||||
|
Valuation (1)
|
Principal
|
Value
|
||||||||
|
U.S.
Government Securities (18) – 41.7% of net assets at value
|
||||||||||
|
U.S.
Treasury Bill — due date
04/22/10
|
(M)
|
$ | 10,000,000 | $ | 9,997,600 | |||||
|
U.S.
Treasury Bill — due date
06/17/10
|
(M)
|
42,175,000 | 42,139,151 | |||||||
|
U.S.
Treasury Notes — due date 02/28/10, coupon
2.000%
|
(M)
|
3,800,000 | 3,810,830 | |||||||
|
Total
Investments in U.S. Government Securities (cost:
$55,960,024)
|
$ | 55,947,581 | ||||||||
|
Total
Investments (cost: $148,349,931)
|
$ | 133,971,062 | ||||||||
|
HARRIS & HARRIS GROUP,
INC.
CONSOLIDATED SCHEDULE OF
INVESTMENTS AS OF DECEMBER 31,
2009
|
|
(1)
|
See
Footnote to Consolidated Schedule of Investments on page 28 for a
description of the Valuation
Procedures.
|
|
(2)
|
Investments
in unaffiliated companies consist of investments in which we own less than
five percent of the voting shares of the portfolio company or less than
five percent of the common shares of the publicly traded company.
Investments in non-controlled affiliated companies consist of investments
in which we own five percent or more, but less than 25 percent, of the
voting shares of the portfolio company, or where we hold one or more seats
on the portfolio company’s Board of Directors but do not control the
company. Investments in controlled affiliated companies consist of
investments in which we own 25 percent or more of the voting shares of the
portfolio company or otherwise control the
company.
|
|
(3)
|
The
aggregate cost for federal income tax purposes of investments in
unaffiliated privately held companies is $26,977,200. The gross
unrealized appreciation based on the tax cost for these securities is
$2,338,205. The gross unrealized depreciation based on the tax cost for
these securities is $7,658,969.
|
|
(4)
|
The
aggregate cost for federal income tax purposes of investments in
unaffiliated publicly traded companies is $298,827. The gross
unrealized appreciation based on the tax cost for these securities is
$0. The gross unrealized depreciation based on the tax cost for
these securities is $72,432.
|
|
(5)
|
Legal
restrictions on sale of investment.
|
|
(6)
|
Represents
a non-income producing security. Equity investments that have not
paid dividends within the last 12 months are considered to be non-income
producing.
|
|
(7)
|
These
investments are development-stage companies. A development-stage
company is defined as a company that is devoting substantially all of its
efforts to establishing a new business, and either it has not yet
commenced its planned principal operations, or it has commenced such
operations but has not realized significant revenue from
them.
|
|
(8)
|
With
our purchase of Series E Convertible Preferred Stock of BioVex, we
received a warrant to purchase a number of shares of common stock of
BioVex as determined by dividing 624,999.99 by the price per share at
which the common stock is offered and sold to the public in connection
with the IPO. The ability to exercise this warrant is therefore
contingent on BioVex completing successfully an IPO before the expiration
date of the warrant on September 27, 2012. The exercise price of
this warrant shall be 110 percent of the IPO
price.
|
|
(9)
|
Cobalt
Technologies, Inc., does business as Cobalt
Biofuels.
|
|
(10)
|
D-Wave
Systems, Inc., is located and is doing business primarily in Canada.
We invested in D-Wave Systems, Inc., through D-Wave USA, a Delaware
company. Our investment is denominated in Canadian dollars and is
subject to foreign currency translation. See "Note 3. Summary of
Significant Accounting Policies."
|
|
(11)
|
We
exercised NeoPhotonics Corporation warrants in January and February
2010.
|
|
HARRIS & HARRIS GROUP,
INC.
CONSOLIDATED SCHEDULE OF
INVESTMENTS AS OF DECEMBER 31,
2009
|
|
(12)
|
With
our purchase of the Series B Convertible Preferred Stock of TetraVitae
Bioscience, Inc., we received the right to purchase, at a price of
$2.63038528 per share, a number of shares in the Series C financing equal
to the number of shares of Series B Preferred Stock purchased. The
ability to exercise this right is contingent on TetraVitae Bioscience
completing successfully a subsequent round of
financing.
|
|
(13)
|
Initial
investment was made during 2009.
|
|
(14)
|
The
aggregate cost for federal income tax purposes of investments in
non-controlled affiliated companies is $54,864,948. The gross
unrealized appreciation based on the tax cost for these securities is
$10,648,525. The gross unrealized depreciation based on the tax cost
for these securities is
$15,216,253.
|
|
(15)
|
On
February 28, 2008, Lifco, Inc., merged with CFX Battery, Inc. The
surviving entity is CFX Battery,
Inc.
|
|
(16)
|
With
our investment in a convertible bridge note issued by Ensemble Discovery,
we received a warrant to purchase a number of shares of the class of stock
sold in the next financing of Ensemble Discovery equal to $149,539.57
divided by the price per share of the class of stock sold in the next
financing of Ensemble Discovery. The ability to exercise this
warrant is, therefore, contingent on Ensemble Discovery completing
successfully a subsequent round of financing. This warrant shall
expire and no longer be exercisable on September 10, 2015. The cost
basis of this warrant is $89.86.
|
|
(17)
|
The
aggregate cost for federal income tax purposes of investments in
controlled affiliated companies is $10,248,932. The gross unrealized
appreciation based on the tax cost for these securities is $0. The
gross unrealized depreciation based on the tax cost for these securities
is $4,405,502.
|
|
(18)
|
The
aggregate cost for federal income tax purposes of our U.S. government
securities is $55,960,024. The gross unrealized appreciation on the tax
cost for these securities is $0. The gross unrealized depreciation on the tax cost of these
securities is $12,443.
|
|
HARRIS
& HARRIS GROUP, INC.
FOOTNOTE
TO CONSOLIDATED SCHEDULE OF
INVESTMENTS
|
|
I.
|
Determination
of Net Asset Value
|
|
II.
|
Approaches
to Determining Fair Value
|
|
·
|
Market
Approach: The market approach uses prices and other relevant
information generated by market transactions involving identical or
comparable assets or liabilities. For example, the market approach often
uses market multiples derived from a set of comparables. Multiples might
lie in ranges with a different multiple for each comparable. The selection
of where within the range each appropriate multiple falls requires
judgment considering factors specific to the measurement (qualitative and
quantitative).
|
|
·
|
Income
Approach: The income approach uses valuation techniques to convert
future amounts (for example, cash flows or earnings) to a single present
value amount (discounted). The measurement is based on the value indicated
by current market expectations about those future amounts. Those valuation
techniques include present value techniques; option-pricing models, such
as the Black-Scholes-Merton formula (a closed-form model) and a binomial
model (a lattice model), which incorporate present value techniques; and
the multi-period excess earnings method, which is used to measure the fair
value of certain assets.
|
|
·
|
Level 1:
Unadjusted quoted prices in active markets for identical assets or
liabilities.
|
|
|
|
|
·
|
Level 2: Quoted
prices in active markets for similar assets or liabilities, or quoted
prices for identical or similar assets or liabilities in markets that are
not active, or inputs other than quoted prices that are observable for the
asset or liability.
|
|
|
|
|
·
|
Level 3:
Unobservable inputs for the asset or
liability.
|
|
III.
|
Investment
Categories
|
|
·
|
Equity-related
securities;
|
|
·
|
Long-term
fixed-income securities;
|
|
·
|
Short-term
fixed-income securities;
|
|
·
|
Investments
in intellectual property, patents, research and development in technology
or product development;
and
|
|
·
|
All
other securities.
|
|
A.
|
EQUITY-RELATED
SECURITIES
|
|
§
|
Readily
available public market quotations;
|
|
§
|
The
cost of the Company’s investment;
|
|
§
|
Transactions
in a company's securities or unconditional firm offers by responsible
parties as a factor in determining
valuation;
|
|
§
|
The
financial condition and operating results of the
company;
|
|
|
§
|
The
company's progress towards
milestones.
|
|
§
|
The
long-term potential of the business and technology of the
company;
|
|
§
|
The
values of similar securities issued by companies in similar
businesses;
|
|
§
|
Multiples
to revenue, net income or EBITDA that similar securities issued by
companies in similar businesses
receive;
|
|
§
|
The
proportion of the company's securities we own and the nature of any rights
to require the company to register restricted securities under applicable
securities laws; and
|
|
§
|
The
rights and preferences of the class of securities we own as
compared with other classes of securities the portfolio company has
issued.
|
|
|
B.
|
LONG-TERM
FIXED-INCOME SECURITIES
|
|
1.
|
Readily
Marketable: Long-term fixed-income securities for which
market quotations are readily available are valued using the most recent
bid quotations when available
|
|
2.
|
Not
Readily Marketable: Long-term fixed-income securities
for which market quotations are not readily available are fair valued
using the market approach. The factors that may be considered when
valuing these types of securities by the market approach
include:
|
|
·
|
Credit
quality;
|
|
·
|
Interest
rate analysis;
|
|
·
|
Quotations
from broker-dealers;
|
|
·
|
Prices
from independent pricing services that the Board believes are reasonably
reliable; and
|
|
·
|
Reasonable
price discovery procedures and data from other
sources.
|
|
|
C.
|
SHORT-TERM
FIXED-INCOME SECURITIES
|
|
·
|
The
cost of the Company’s investment;
|
|
·
|
Investments
in the same or substantially similar intellectual property or patents or
research and development in technology or product development or offers by
responsible third parties;
|
|
·
|
The
results of research and
development;
|
|
·
|
Product
development and milestone progress;
|
|
·
|
Commercial
prospects;
|
|
·
|
Term
of patent;
|
|
·
|
Projected
markets; and
|
|
·
|
Other
subjective factors.
|
|
|
E.
|
ALL
OTHER SECURITIES
|
|
NOTES
TO CONSOLIDATED FINANCIAL STATEMENTS
(Unaudited)
|
|
Fair Value Measurement at Reporting Date Using:
|
||||||||||||||||
|
Description
|
June 30, 2010
|
Quoted Prices in Active
Markets for Identical
Assets (Level 1)
|
Significant Other
Observable Inputs
(Level 2)
|
Significant
Unobservable Inputs
(Level 3)
|
||||||||||||
|
U.S.
Government Securities
|
$ | 45,930,735 | $ | 45,930,735 | $ | 0 | $ | 0 | ||||||||
|
Privately
Held Portfolio Companies:
|
||||||||||||||||
|
Preferred
Stock
|
$ | 85,717,686 | $ | 0 | $ | 0 | $ | 85,717,686 | ||||||||
|
Bridge
Notes
|
$ | 4,658,791 | $ | 0 | $ | 0 | $ | 4,658,791 | ||||||||
|
Common
Stock
|
$ | 1,122,777 | $ | 0 | $ | 0 | $ | 1,122,777 | ||||||||
|
Warrants
|
$ | 540,743 | $ | 0 | $ | 0 | $ | 540,743 | ||||||||
|
Publicly
Traded
|
||||||||||||||||
|
Portfolio
Companies:
|
||||||||||||||||
|
Common
Stock
|
$ | 0 | $ | 0 | $ | 0 | $ | 0 | ||||||||
|
Total
|
$ | 137,970,732 | $ | 45,930,735 | $ | 0 | $ | 92,039,997 | ||||||||
|
Beginning
Balance
4/1/2010
|
Total
Realized
Gains
(Losses)
Included in
Changes in
Net Assets
|
Total
Unrealized
Gains
(Losses)
Included in
Changes in
Net Assets
|
Investments
in Private
Placements
and
Interest on
Bridge
Notes
|
Disposals
|
Ending
Balance
6/30/2010
|
Amount of
Total Gains
for the
Period
Included in
Changes in
Net Assets
Attributable
to the
Change in
Unrealized
Gains or
Losses
Relating to
Assets Still
Held at the
Reporting
Date
|
||||||||||||||||||||||
|
Preferred
Stock
|
$ | 77,237,407 | $ | 0 | $ | 4,674,671 | $ | 3,805,608 | $ | 0 | $ | 85,717,686 | $ | 4,674,671 | ||||||||||||||
|
Bridge
Notes
|
3,703,674 | 0 | 0 | 955,117 | 0 | 4,658,791 | 0 | |||||||||||||||||||||
|
Common
Stock
|
1,463,561 | 0 | (340,784 | ) | 0 | 0 | 1,122,777 | (340,784 | ) | |||||||||||||||||||
|
Warrants
|
610,304 | (257,007 | ) | 187,446 | 0 | 0 | 540,743 | 187,446 | ||||||||||||||||||||
|
Total
|
$ | 83,014,946 | $ | (257,007 | ) | $ | 4,521,333 | $ | 4,760,725 | $ | 0 | $ | 92,039,997 | $ | 4,521,333 | |||||||||||||
|
Beginning
Balance
1/1/2010
|
Total
Realized
Gains
(Losses)
Included in
Changes in
Net Assets
|
Total
Unrealized
Gains
(Losses)
Included in
Changes in
Net Assets
|
Investments
in Private
Placements
and
Interest on
Bridge
Notes
|
Disposals
|
Ending
Balance
6/30/2010
|
Amount of
Total
Gains for
the Period
Included in
Changes in
Net Assets
Attributable
to the
Change in
Unrealized
Gains or
Losses
Relating to
Assets Still
Held at the
Reporting
Date
|
||||||||||||||||||||||
|
Preferred
Stock
|
$ | 73,134,661 | $ | 0 | $ | 8,317,389 | $ | 4,265,636 | $ | 0 | $ | 85,717,686 | $ | 8,317,389 | ||||||||||||||
|
Bridge
Notes
|
2,718,225 | 0 | 0 | 1,940,566 | 0 | 4,658,791 | 0 | |||||||||||||||||||||
|
Common
Stock
|
1,164,599 | 0 | (50,700 | ) | 8,878 | 0 | 1,122,777 | (50,700 | ) | |||||||||||||||||||
|
Warrants
|
779,601 | (257,007 | ) | (17,550 | ) | 35,699 | 0 | 540,743 | (17,550 | ) | ||||||||||||||||||
|
Total
|
$ | 77,797,086 | $ | (257,007 | ) | $ | 8,249,139 | $ | 6,250,779 | $ | 0 | $ | 92,039,997 | $ | 8,249,139 | |||||||||||||
|
Weighted
|
||||||||||||||||||||||||||
|
Average
|
||||||||||||||||||||||||||
|
Number
|
Expected
|
Expected
|
Expected
|
Risk-free
|
Fair
|
|||||||||||||||||||||
|
of Options
|
Term
|
Volatility
|
Dividend
|
Interest
|
Value
|
|||||||||||||||||||||
|
Type of Award
|
Term
|
Granted
|
in Yrs
|
Factor
|
Yield
|
Rates
|
Per Share
|
|||||||||||||||||||
|
March
18, 2010 Non-qualified stock options
|
5
Years
|
150,000 | 3.50 | 63.1 | % | 0 | % | 1.77 | % | $ | 2.20 | |||||||||||||||
|
May
12, 2010 Non-qualified stock options
|
5
Years
|
150,000 | 3.50 | 62.3 | % | 0 | % | 1.64 | % | $ | 2.21 | |||||||||||||||
|
Total
|
300,000 | $ | 2.21 | |||||||||||||||||||||||
|
Weighted
|
||||||||||||||||||||
|
Weighted
|
Weighted
|
Average
|
||||||||||||||||||
|
Average
|
Average
|
Remaining
|
Aggregate
|
|||||||||||||||||
|
Exercise
|
Grant Date
|
Contractual
|
Intrinsic
|
|||||||||||||||||
|
Shares
|
Price
|
Fair Value
|
Term (Yrs)
|
Value
|
||||||||||||||||
|
Options
Outstanding at January 1, 2010
|
4,184,503 | $ | 8.20 | $ | 4.79 | 6.24 | $ | 216,333 | ||||||||||||
|
Granted
|
300,000 | $ | 4.80 | $ | 2.21 | 4.79 | ||||||||||||||
|
Exercised
|
(5,306 | ) | $ | 3.75 | $ | 1.29 | ||||||||||||||
|
Forfeited
or Expired
|
0 | $ | 0 | $ | 0 | |||||||||||||||
|
Options
Outstanding at June 30, 2010
|
4,479,197 | $ | 7.98 | $ | 4.62 | 5.69 | $ | 72,139 | ||||||||||||
|
Options
Exercisable at June 30, 2010
|
2,695,734 | $ | 8.76 | $ | 5.06 | 5.13 | $ | 72,139 | ||||||||||||
|
Options
Exercisable and Expected to be Exercisable at June 30,
2010
|
4,184,117 | $ | 8.04 | $ | 4.66 | 5.64 | $ | 72,139 | ||||||||||||
|
For the Three Months Ended
June 30
|
For the Six Months Ended
June 30
|
|||||||||||||||
|
2010
|
2009
|
2010
|
2009
|
|||||||||||||
|
Numerator
for increase (decrease) in net assets per share
|
$ | 2,150,952 | $ | 421,367 | $ | 3,838,683 | $ | (530,057 | ) | |||||||
|
Denominator
for basic weighted average shares
|
30,864,491 | 25,859,573 | 30,862,202 | 25,859,573 | ||||||||||||
|
Basic
net increase (decrease) in net assets per share resulting from
operations
|
$ | 0.07 | $ | 0.02 | $ | 0.12 | $ | (0.02 | ) | |||||||
|
Denominator
for diluted weighted average shares
|
30,903,625 | 25,859,573 | 30,901,438 | 25,859,573 | ||||||||||||
|
Diluted
net increase (decrease) in net assets per share resulting from
operations
|
$ | 0.07 | $ | 0.02 | $ | 0.12 | $ | (0.02 | ) | |||||||
|
HARRIS
& HARRIS GROUP, INC.
FINANCIAL
HIGHLIGHTS
(Unaudited)
|
|
Three Months Ended June 30
|
Six Months Ended June 30
|
|||||||||||||||
|
2010
|
2009
|
2010
|
2009
|
|||||||||||||
|
Per
Share Operating Performance
|
||||||||||||||||
|
Net
asset value per share, beginning of period
|
$ | 4.42 | $ | 4.22 | $ | 4.35 | $ | 4.24 | ||||||||
|
Net
operating (loss)*
|
(0.06 | ) | (0.07 | ) | (0.13 | ) | (0.16 | ) | ||||||||
|
Net
realized (loss) on investments*
|
(0.02 | ) | (0.06 | ) | (0.02 | ) | (0.06 | ) | ||||||||
|
Net
decrease in unrealized depreciation as a result of sales*
|
0.01 | 0.06 | 0.01 | 0.06 | ||||||||||||
|
Net
decrease in unrealized depreciation on investments
held*(1)
|
0.14 | 0.09 | 0.26 | 0.14 | ||||||||||||
|
Total
from investment operations*
|
0.07 | 0.02 | 0.12 | (0.02 | ) | |||||||||||
|
Net
increase as a result of stock- based compensation expense*
|
0.02 | 0.03 | 0.04 | 0.05 | ||||||||||||
|
Net
increase as a result of proceeds from exercise of options
|
0.00 | 0.00 | 0.00 | 0.00 | ||||||||||||
|
Total
increase from capital stock transactions
|
0.02 | 0.03 | 0.04 | 0.05 | ||||||||||||
|
Net
asset value per share, end of period
|
$ | 4.51 | $ | 4.27 | $ | 4.51 | $ | 4.27 | ||||||||
|
Stock
price per share, end of period
|
$ | 4.09 | $ | 5.83 | $ | 4.09 | $ | 5.83 | ||||||||
|
Total
return based on stock price
|
(11.28 | )% | 57.57 | % | (10.50 | )% | 47.59 | % | ||||||||
|
Supplemental
Data:
|
||||||||||||||||
|
Net
assets, end of period
|
$ | 139,182,848 | $ | 110,412,973 | $ | 139,182,848 | $ | 110,412,973 | ||||||||
|
Ratio
of expenses to average net assets
|
1.5 | % | 1.9 | % | 3.1 | % | 3.8 | % | ||||||||
|
Ratio
of net operating (loss) to average net assets
|
(1.4 | )% | (1.8 | )% | (3.0 | )% | (3.7 | )% | ||||||||
|
Number
of shares outstanding, end of period
|
30,864,899 | 25,859,573 | 30,864,899 | 25,859,573 | ||||||||||||
|
Item
2.
|
Management's
Discussion
and Analysis of Financial Condition and
Results of Operations
|
|
2006
|
2007
|
2008
|
2009
|
Six
Months Ended
June
30, 2010
|
|
|
Total
Incremental Investments
|
$24,408,187
|
$20,595,161
|
$17,779,462
|
$12,334,051
|
$6,327,164
|
|
Investments
in Privately Held Companies
|
|||||
|
No.
of New Investments
|
6
|
7
|
4
|
1
|
1
|
|
No.
of Follow-On Investment Rounds
|
14
|
20
|
25
|
27
|
15
|
|
No.
of Rounds Led
|
7
|
3
|
4
|
5
|
3
|
|
Average
Dollar Amount – Initial
|
$2,383,424
|
$1,086,441
|
$683,625
|
$250,000
|
$250,000
|
|
Average
Dollar Amount – Follow-On
|
$721,974
|
$649,504
|
$601,799
|
$436,490
|
$388,579
|
|
Investments
in Publicly Traded Companies
|
|||||
|
No.
of New Investments
|
0
|
0
|
0
|
1
|
1
|
|
No.
of Follow-On Investment Rounds
|
0
|
0
|
0
|
2
|
3
|
|
Average
Dollar Amount – Initial
|
$0
|
$0
|
$0
|
$99,624
|
$99,957
|
|
Average
Dollar Amount – Follow-On
|
$0
|
$0
|
$0
|
$99,602
|
$49,507
|
|
1)
|
We
manage the company and our investment pace and criteria such that our
projected needs for capital to make new and follow-on investments do not
exceed the total of our liquid investments. Although we use best
efforts to predict when this capital will be required for use in new and
follow-on investments, we cannot predict with certainty the timing for
these investments. We would be unable to make new or follow-on
investments in our portfolio companies without having substantial liquid
resources of capital available to
us.
|
|
2)
|
Venture
capital firms traditionally invest beside other venture capital firms in a
process called syndication. The size of the fund and the amount of
capital reserves available to syndicate partners is often an attribute
that potential co-investors consider when deciding on syndicate
partners. As we do not have committed capital from limited partners,
we believe we must have adequate available liquid capital on our balance
sheet to be able to have access to high-quality deal
flow.
|
|
3)
|
We
rarely commit the total amount of cumulative capital intended for
investment in any portfolio company at one point in time. Instead,
our investments consist of multiple rounds of financing of a given
portfolio company, in which we typically participate if we believe that
the merits of such an investment outweigh the risks. We also
commonly have preemptive rights to invest additional capital in our
privately held portfolio companies. These rights are useful to
protect and potentially increase the value of our positions in our
portfolio companies as they mature. Commonly, the terms of such
financings in privately held companies also include penalties for those
investors that do not invest in these subsequent rounds of
financing. Without available capital at the time of investment, our
ownership in the company would be subject to these penalties that can lead
to a partial or complete loss of the capital invested prior to that round
of financing.
|
|
4)
|
We
may have the opportunity to increase ownership in late rounds of financing
in some of our most mature companies. Many private venture capital funds
that invested in these companies are reaching the end of the term
associated with their limited partnerships. This issue may limit the
available capital to these funds for follow-on investments, and the
ability to take advantage of potentially valuable terms given to those who
have investable capital. Having permanent, liquid capital available for
investment allows us to take advantage of these opportunities as they
arise.
|
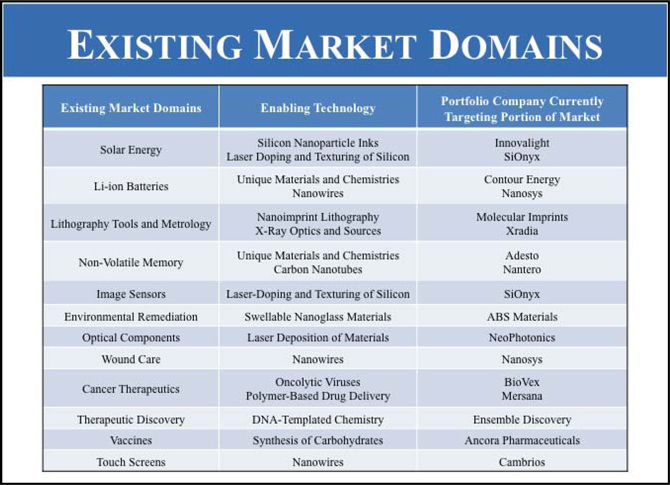
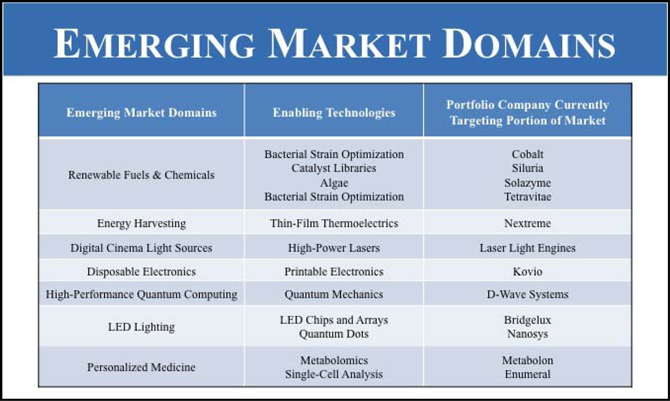
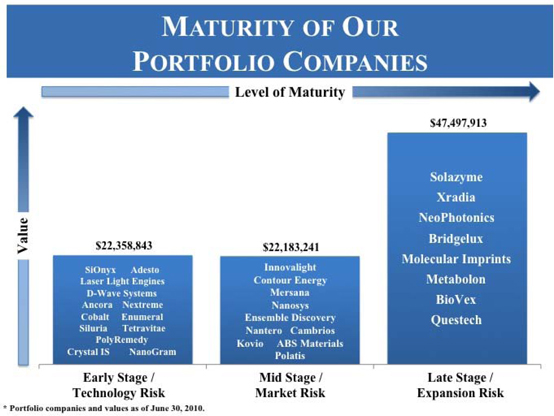
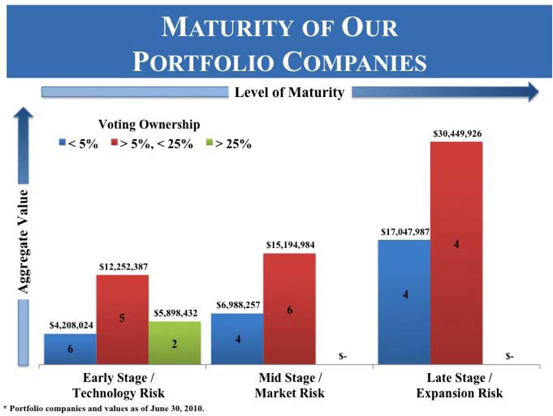
|
2006
|
2007
|
2008
|
2009
|
Six Months Ended
June 30, 2010
|
||||||||||||||||
|
Net
Asset Value, BOY
|
$ | 117,987,742 | $ | 113,930,303 | $ | 138,363,344 | $ | 109,531,113 | $ | 134,158,258 | ||||||||||
|
Gross
Write-Downs During Year
|
$ | (4,211,323 | ) | $ | (7,810,794 | ) | $ | (39,671,588 | ) | $ | (12,845,574 | ) | $ | (7,588,332 | ) | |||||
|
Gross
Write-Ups During Year
|
$ | 279,363 | $ | 11,694,618 | $ | 820,559 | $ | 21,631,864 | $ | 15,837,471 | ||||||||||
|
Gross
Write-Downs as a Percentage of
Net
Asset Value, BOY
|
-3.57 | % | -6.86 | % | -28.67 | % | -11.7 | % | -5.7 | % | ||||||||||
|
Gross
Write-Ups as a Percentage of
Net Asset
Value, BOY
|
0.24 | % | 10.26 | % | 0.59 | % | 19.7 | % | 11.8 | % | ||||||||||
|
Net
Change as a Percentage of
Net
Asset Value, BOY
|
-3.33 | % | 3.40 | % | -28.08 | % | 8.0 | % | 6.1 | % | ||||||||||
|
Q1 2010 to
Q2 2010
|
Q4 2009 to
Q1 2010
|
Q3 2009 to
Q4 2009
|
Q2 2009 to
Q3 2009
|
|||||||||||||
|
Value
of Privately Held Portfolio as of
Previous
Quarter
|
$ | 83,014,946 | $ | 77,797,086 | $ | 69,876,210 | $ | 63,959,811 | ||||||||
|
Value
of Privately Held Portfolio as of
Current
Quarter
|
$ | 92,039,997 | $ | 83,014,946 | $ | 77,797,086 | $ | 69,876,210 | ||||||||
|
Total
New and Follow-On Investments
|
$ | 4,652,106 | $ | 1,426,580 | $ | 4,698,782 | $ | 3,884,893 | ||||||||
|
(+)
Due to Terms of New Equity Rounds of Financing
|
$ | 11,564,433 | $ | 1,436,628 | $ | 5,229,990 | $ | 4,725,316 | ||||||||
|
(-)
Due to Terms of New Equity Rounds of Financing
|
$ | (280,649 | ) | $ | 0 | $ | 0 | $ | (1,967,156 | ) | ||||||
|
(+)
Due to (+) in Values of Comparables
|
$ | 730,026 | $ | 2,151,404 | $ | 1,938,047 | $ | 2,823,833 | ||||||||
|
(-)
Due to (-) in Values of Comparables
|
$ | (1,618,341 | ) | $ | 0 | $ | (6,313 | ) | $ | 0 | ||||||
|
(+)
Due to (-) in Non-Performance Risk
|
$ | 1,355,025 | $ | 2,511,106 | $ | 500,000 | $ | 0 | ||||||||
|
(-)
Due to (+) in Non-Performance Risk
|
$ | (7,172,178 | ) | $ | (2,307,768 | ) | $ | (4,795,765 | ) | $ | (3,794,138 | ) | ||||
|
Other
Factors1
|
$ | (205,371 | ) | $ | (90 | ) | $ | 356,135 | $ | 243,651 |
2
|
|||||
|
Total
Change in Value of Privately Held Portfolio from Quarter to
Quarter
|
$ | 9,025,051 | $ | 5,217,860 | $ | 7,920,876 | $ | 5,916,399 |
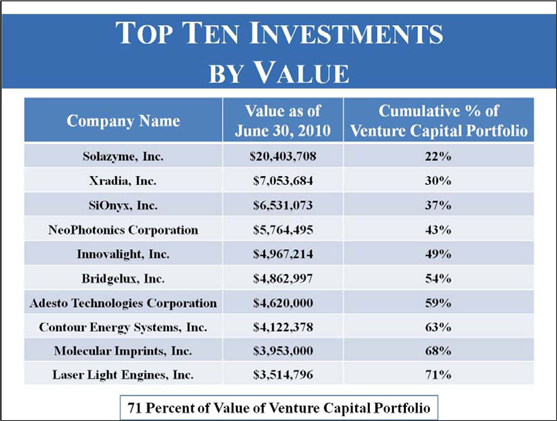
|
Investment
|
Amount of Write-Up
|
|||
|
BioVex
Group, Inc.
|
$ | 423,421 | ||
|
D-Wave
Systems, Inc.
|
855,025 | |||
|
Laser
Light Engines, Inc.
|
500,000 | |||
|
SiOnyx,
Inc.
|
2,002,611 | |||
|
Solazyme,
Inc.
|
8,149,698 | |||
|
Xradia,
Inc.
|
730,022 | |||
|
Investment
|
Amount of Write-Down
|
|||
|
Bridgelux,
Inc.
|
$ | 1,663,728 | ||
|
Kovio,
Inc.
|
335,675 | |||
|
Mersana
Therapeutics, Inc.
|
14,109 | |||
|
Metabolon,
Inc.
|
6,527 | |||
|
Molecular
Imprints, Inc.
|
2,014,874 | |||
|
Nanosys,
Inc.
|
280,649 | |||
|
NeoPhotonics
Corporation
|
1,548,863 | |||
|
Nextreme
Thermal Solutions, Inc.
|
2,202,629 | |||
|
PolyRemedy,
Inc.
|
53,893 | |||
|
Questech
Corporation
|
69,479 | |||
|
TetraVitae
Bioscience, Inc.
|
62,500 | |||
|
Investment
|
Amount of Write-Up
|
|||
|
Metabolon,
Inc.
|
$ | 568,029 | ||
|
Molecular
Imprints, Inc.
|
1,073,605 | |||
|
NeoPhotonics
Corporation
|
630,977 | |||
|
Nextreme
Thermal Solutions, Inc.
|
2,202,628 | |||
|
Questech
Corporation
|
51,879 | |||
|
Siluria
Technologies, Inc.
|
160,723 | |||
|
Investment
|
Amount of Write-Down
|
|||
|
Ancora
Pharmaceuticals Inc.
|
$ | 359,091 | ||
|
BioVex
Group, Inc.
|
25,462 | |||
|
Bridgelux,
Inc.
|
984 | |||
|
Kovio,
Inc.
|
6,762 | |||
|
Mersana
Therapeutics, Inc.
|
4,123 | |||
|
NanoGram
Corporation
|
735,903 | |||
|
Nanomix,
Inc.
|
30,050 | |||
|
Nanosys,
Inc.
|
1,342,529 | |||
|
PolyRemedy,
Inc.
|
28,384 | |||
|
Investment
|
Amount of Write-Up
|
|||
|
BioVex
Group, Inc.
|
$ | 421,422 | ||
|
D-Wave
Systems, Inc.
|
855,025 | |||
|
Ensemble Therapeutics
Corporation
|
500,000 | |||
|
Laser
Light Engines, Inc.
|
500,000 | |||
|
Mersana
Therapeutics, Inc.
|
961,704 | |||
|
Metabolon,
Inc.
|
69,635 | |||
|
Solazyme,
Inc.
|
8,149,698 | |||
|
SiOnyx,
Inc.
|
3,078,765 | |||
|
Xradia,
Inc.
|
1,330,469 | |||
|
Investment
|
Amount of Write-Down
|
|||
|
Bridgelux,
Inc.
|
$ | 220,253 | ||
|
Kovio,
Inc.
|
1,750,165 | |||
|
Molecular
Imprints, Inc.
|
2,023,124 | |||
|
Nanosys,
Inc.
|
280,649 | |||
|
NeoPhotonics
Corporation
|
5,111 | |||
|
Nextreme
Thermal Solutions, Inc.
|
3,303,943 | |||
|
PolyRemedy,
Inc.
|
107,786 | |||
|
TetraVitae
Bioscience, Inc.
|
62,500 | |||
|
Questech
Corporation
|
62,269 | |||
|
Investment
|
Amount of Write-Up
|
|||
|
Metabolon,
Inc.
|
$ | 205,198 | ||
|
Molecular
Imprints, Inc.
|
1,069,605 | |||
|
NeoPhotonics
Corporation
|
572,326 | |||
|
Nextreme
Thermal Solutions, Inc.
|
2,202,628 | |||
|
Questech
Corporation
|
22,690 | |||
|
Siluria
Technologies, Inc.
|
160,723 | |||
|
Solazyme,
Inc.
|
5,376,988 | |||
|
Investment
|
Amount of Write-Down
|
|||
|
Ancora
Pharmaceuticals Inc.
|
$ | 759,091 | ||
|
BioVex
Group, Inc.
|
19,621 | |||
|
Bridgelux,
Inc.
|
1,967 | |||
|
Crystal
IS, Inc.
|
332,238 | |||
|
CSwitch,
Inc.
|
20,286 | |||
|
Kovio,
Inc.
|
12,491 | |||
|
Laser
Light Engines, Inc.
|
500,000 | |||
|
Mersana
Therapeutics, Inc.
|
7,880 | |||
|
NanoGram
Corporation
|
735,903 | |||
|
Nanomix,
Inc.
|
30,050 | |||
|
Nanosys,
Inc.
|
2,685,059 | |||
|
PolyRemedy,
Inc.
|
28,384 | |||
|
SiOnyx,
Inc.
|
1,076,155 | |||
|
New Investments
|
Amount of Investment
|
|||
|
ABS
Materials, Inc.
|
$ | 250,000 | ||
|
Satcon
Technology Corporation
|
99,957 | |||
|
Follow-On Investments
|
Amount of Investment
|
|||
|
ABS
Materials, Inc.
|
$ | 125,000 | ||
|
Ancora
Pharmaceuticals Inc.
|
500,000 | |||
|
Ancora
Pharmaceuticals Inc.
|
600,000 | |||
|
BioVex
Group, Inc.
|
354,390 | |||
|
Bridgelux,
Inc.
|
250,041 | |||
|
Kovio,
Inc.
|
526,225 | |||
|
Laser
Light Engines, Inc.
|
250,000 | |||
|
Laser
Light Engines, Inc.
|
250,000 | |||
|
Mersana
Therapeutics, Inc.
|
87,500 | |||
|
Mersana
Therapeutics, Inc.
|
84,475 | |||
|
NeoPhotonics
Corporation
|
2,455 | |||
|
NeoPhotonics
Corporation
|
2,109 | |||
|
Orthovita,
Inc.
|
98,427 | |||
|
Satcon
Technology Corporation
|
22,134 | |||
|
Satcon
Technology Corporation
|
27,960 | |||
|
SiOnyx,
Inc.
|
339,760 | |||
|
SiOnyx,
Inc.
|
956,740 | |||
|
Solazyme,
Inc.
|
1,499,991 | |||
|
Total
|
$ | 6,327,164 | ||
|
June 30, 2010
|
December 31, 2009
|
|||||||
|
Venture
capital investments, at cost
|
$ | 98,084,850 | $ | 92,389,907 | ||||
|
Net
unrealized depreciation(1)
|
6,044,853 | 14,366,426 | ||||||
|
Venture
capital investments, at value
|
$ | 92,039,997 | $ | 78,023,481 | ||||
|
June 30, 2010
|
December 31, 2009
|
|||||||
|
U.S.
government obligations, at cost
|
$ | 45,948,517 | $ | 55,960,024 | ||||
|
Net
unrealized depreciation(1)
|
17,782 | 12,443 | ||||||
|
U.S.
government obligations, at value
|
$ | 45,930,735 | $ | 55,947,581 | ||||
|
|
·
|
Level
1: Unadjusted quoted prices in active markets for
identical assets or liabilities.
|
|
|
·
|
Level
2: Quoted prices in active markets for similar assets or
liabilities, or quoted prices for identical or similar assets or
liabilities in markets that are not active, or inputs other than quoted
prices that are observable for the asset or
liability.
|
|
|
·
|
Level
3: Unobservable inputs for the asset or
liability.
|
|
|
·
|
Political
and economic instability;
|
|
|
·
|
Export
controls and other trade
restrictions;
|
|
|
·
|
Changes
in legal and regulatory
requirements;
|
|
|
·
|
U.S.
and foreign government policy changes affecting the markets for the
technologies;
|
|
|
·
|
Changes
in tax laws and tariffs;
|
|
|
·
|
Convertibility
and transferability of international currencies;
and
|
|
|
·
|
International
currency exchange rate
fluctuations.
|
|
Item
5.
|
Exhibits
|
|
|
31.01*
|
Certification
of CEO pursuant to Section 302 of the Sarbanes-Oxley Act of
2002.
|
|
|
31.02*
|
Certification
of CFO pursuant to Section 302 of the Sarbanes-Oxley Act of
2002.
|
|
|
32*
|
Certification
of CEO and CFO pursuant to 18 U.S.C. Section 1350, as adopted pursuant to
Section 906 of the Sarbanes-Oxley Act of
2002.
|
|
Harris
& Harris Group, Inc.
|
|
|
/s/
|
Daniel B. Wolfe
|
|
By:
|
Daniel
B. Wolfe
|
|
Chief
Financial Officer
|
|
|
/s/
|
Patricia N. Egan
|
|
By:
|
Patricia
N. Egan
|
|
Chief
Accounting Officer
|
|
|
and
Vice President
|
|
|
Exhibit No.
|
Description
|
|
|
31.01
|
Certification
of CEO pursuant to Section 302 of the Sarbanes-Oxley Act of
2002.
|
|
|
31.02
|
Certification
of CFO pursuant to Section 302 of the Sarbanes-Oxley Act of
2002.
|
|
|
32
|
Certification
of CEO and CFO pursuant to 18 U.S.C. Section 1350, as adopted pursuant to
Section 906 of the Sarbanes-Oxley Act of
2002.
|