UNITED STATES
SECURITIES AND EXCHANGE COMMISSION
WASHINGTON, DC 20549
Form 10-K
|
x
|
ANNUAL REPORT PURSUANT TO SECTION 13 OR 15(d) OF THE SECURITIES EXCHANGE ACT OF 1934
|
For the fiscal year ended December 31, 2010
or
|
¨
|
TRANSITION REPORT PURSUANT TO SECTION 13 OR 15(d) OF THE SECURITIES EXCHANGE ACT OF 1934
|
For the transition period from _____________________ to ____________________
Commission File No. 0-11576
|
HARRIS & HARRIS GROUP, INC.®
|
|
(Exact Name of Registrant as Specified in Its Charter)
|
|
New York
|
|
13-3119827
|
|
(State or Other Jurisdiction
|
|
(I.R.S. Employer
|
|
of Incorporation or Organization)
|
|
Identification No.)
|
|
1450 Broadway, New York, New York
|
|
10018
|
|
(Address of Principal Executive Offices)
|
|
(Zip Code)
|
Registrant's telephone number, including area code (212) 582-0900
Securities registered pursuant to Section 12(b) of the Act:
|
Title of Each Class
|
|
Name of Each Exchange on Which Registered
|
| |
|
|
|
Common Stock, $.01 par value
|
|
Nasdaq Global Market
|
Securities registered pursuant to Section 12(g) of the Act:
Indicate by check mark if the registrant is a well-known seasoned issuer, as defined in Rule 405 of the Securities Act.¨Yes þ No
Indicate by check mark if the registrant is not required to file reports pursuant to Section 13 or Section 15(d) of the Act.¨Yes þ No
Indicate by check mark whether the registrant (1) has filed all reports required to be filed by Section 13 or 15(d) of the Securities Exchange Act of 1934 during the preceding 12 months (or for such shorter period that the registrant was required to file such reports), and (2) has been subject to such filing requirements for the past 90 days. þYes ¨ No
Indicate by check mark whether the registrant has submitted electronically and posted on its corporate Web site, if any, every Interactive Data file required to be submitted and posted pursuant to Rule 405 of Regulation S-T during the preceding 12 months (or for such shorter period that the registrant was required to submit and post such files). þYes ¨ No
Indicate by check mark if disclosure of delinquent filers pursuant to Item 405 of Regulation S-K is not contained herein, and will not be contained, to the best of registrant's knowledge, in definitive proxy or information statements incorporated by reference in Part III of this Form 10-K or any amendment to this Form 10-K. þ
Indicate by check mark whether the registrant is a large accelerated filer, an accelerated filer, a non-accelerated filer, or a smaller reporting company. See the definitions of "large accelerated filer," "accelerated filer" and "smaller reporting company" in Rule 12b-2 of the Exchange Act. (Check one):
|
Large accelerated filer ¨
|
|
Accelerated filer þ
|
|
Non-accelerated filer ¨
|
|
Smaller reporting company ¨
|
(Do not check if a smaller reporting company)
Indicate by check mark whether the registrant is a shell company (as defined in Rule 12b-2 of the Act).¨Yes þ No
The aggregate market value of the common stock held by non-affiliates of Registrant as of June 30, 2010 was $124,675,809 based on the last sale price as quoted by the Nasdaq Global Market on such date (only officers and directors are considered affiliates for this calculation).
As of March 15, 2011, the registrant had 30,941,139 shares of common stock, par value $.01 per share, outstanding.
|
DOCUMENTS INCORPORATED BY REFERENCE
|
INCORPORATED AT
|
| |
|
|
Harris & Harris Group, Inc. Proxy Statement for the
|
Part III, Items 10, 11,
|
|
2011 Annual Meeting of Shareholders
|
12, 13 and 14
|
TABLE OF CONTENTS
| |
|
Page
|
|
PART I
|
|
|
| |
|
|
|
Item 1.
|
Business
|
1
|
|
Item 1A.
|
Risk Factors
|
14
|
|
Item 1B.
|
Unresolved Staff Comments
|
29
|
|
Item 2.
|
Properties
|
30
|
|
Item 3.
|
Legal Proceedings
|
30
|
|
Item 4.
|
Removed and Reserved
|
30
|
| |
|
|
|
PART II
|
|
|
| |
|
|
|
Item 5.
|
Market For Registrant's Common Equity, Related Stockholder Matters and Issuer Purchases of Equity Securities
|
31
|
|
Item 6.
|
Selected Financial Data
|
34
|
|
Item 7.
|
Management's Discussion and Analysis of Financial Condition and Results of Operations
|
35
|
|
Item 7A.
|
Quantitative and Qualitative Disclosures About Market Risk
|
69
|
|
Item 8.
|
Consolidated Financial Statements and Supplementary Data
|
72
|
|
Item 9.
|
Changes in and Disagreements With Accountants on Accounting and Financial Disclosure
|
127
|
|
Item 9A.
|
Controls and Procedures
|
127
|
|
Item 9B.
|
Other Information
|
127
|
| |
|
|
|
PART III
|
|
|
| |
|
|
|
Item 10.
|
Directors, Executive Officers and Corporate Governance
|
128
|
|
Item 11.
|
Executive Compensation
|
128
|
|
Item 12.
|
Security Ownership of Certain Beneficial Owners and Management and Related Stockholder Matters
|
128
|
|
Item 13.
|
Certain Relationships and Related Transactions, and Director Independence
|
128
|
|
Item 14.
|
Principal Accountant Fees and Services
|
129
|
| |
|
|
|
PART IV
|
|
|
| |
|
|
|
Item 15.
|
Exhibits and Financial Statements Schedules
|
130
|
| |
|
|
|
Signatures
|
133
|
PART I
Item 1. Business.
Harris & Harris Group, Inc.® (the "Company," "us," "our," and "we"), is an internally managed venture capital company specializing in nanotechnology and microsystems that has elected to operate as a business development company ("BDC") under the Investment Company Act of 1940, which we refer to as the 1940 Act. For tax purposes, we have elected to be a regulated investment company ("RIC") under Subchapter M of the Internal Revenue Code of 1986. Our primary investment objective is to achieve long-term capital appreciation by making venture capital investments. Generation of current income is a secondary objective. We define venture capital investments as the money and resources made
available to privately held start-up firms and privately held and publicly traded small businesses with exceptional growth potential. We incorporated under the laws of the state of New York in August 1981. Our investment approach is comprised of a patient examination of available opportunities, thorough due diligence and close involvement with management. As a venture capital company, we invest in and provide managerial assistance to our portfolio companies, many of which, in our opinion, have significant potential for growth. We are overseen by our Board of Directors and managed by our officers and have no investment advisor.
We make venture capital investments exclusively in companies commercializing or integrating products enabled by nanotechnology or microsystems. This investment focus is not a fundamental policy and accordingly may be changed without shareholder approval, although we intend to give shareholders at least 60 days' prior notice of any change in investment focus.
Nanotechnology is measured in nanometers, which are units of measurement in billionths of a meter. Microsystems are measured in micrometers, which are units of measurement in millionths of a meter. We sometimes use "tiny technology" to describe both of these disciplines. Nanotechnology and microsystems are multidisciplinary and widely applicable, and they incorporate technology that was not previously in widespread use. Products enabled by nanotechnology and microsystems are applicable to a large number of industries including pharmaceuticals, medical devices, telecommunications, electronics and semiconductors, and industries that seek to address global problems related to resource constraints (cleantech).
We consider a company to fit our investment thesis if the company employs or integrates or intends to employ or integrate technology that we consider to be at the microscale or smaller and if the employment of that technology is material to its business plan. Because it is in many respects a new field, tiny technology has significant scientific, engineering and commercialization risks.
As of December 31, 2010, our venture capital portfolio comprised 71 percent of our total assets, our U.S. Treasury obligations and cash comprised 28 percent of our total assets, and other assets comprised the remaining one percent of our total assets. As of December 31, 2010, we had no debt outstanding.
Neither our investments, nor an investment in us, is intended to constitute a balanced investment program. We expect to be risk seeking rather than risk averse in our investment approach. To such end, we reserve the fullest possible freedom of action, subject to our certificate of incorporation, applicable law and regulations, and policy statements contained herein. There is no assurance that our investment objective will be achieved.
We expect to invest a substantial portion of our assets in securities that we consider to be private venture capital equity investments. These private venture capital equity investments usually do not pay interest or dividends and usually are subject to legal or contractual restrictions on resale that may adversely affect the liquidity and marketability of such securities. We expect to invest a minority portion of our assets in debt securities issued to us by privately held and publicly traded small businesses. These investments usually pay interest and may include payment of fees and issuance of warrants for the purchase of equity securities at a future date.
We expect to make speculative venture capital investments with limited marketability and a greater risk of investment loss than less speculative investments. We make venture capital investments in companies commercializing and integrating products enabled by nanotechnology and microsystems. Such technology is enabling technology applicable to a wide range of industries and businesses. We do not limit our investments to any particular industries or categories of investments within this thesis. Our securities investments may consist of private, public or governmental issuers of any type. Subject to the diversification requirements applicable to a RIC, we may commit all of our assets to only a few
investments.
Achievement of our investment objective is basically dependent upon the judgment of a team of four professional, full-time members of management, three of whom are designated as Managing Directors: Douglas W. Jamison, Alexei A. Andreev and Daniel B. Wolfe, and a Vice President, Misti Ushio. One of our directors, Lori D. Pressman, is also a consultant to us. This team collectively has expertise in venture capital investing, intellectual property and nanotechnology. There can be no assurance that a suitable replacement could be found for any of our officers upon their retirement, resignation, inability to act on our behalf, or death.
Subject to continuing to meet the compliance tests applicable to BDCs, there are no limitations on the types of securities or other assets in which we may invest. Investments may include the following:
|
|
·
|
Venture capital investments, whether in corporate, partnership or other form, including development-stage or start-up entities;
|
|
|
·
|
Equity, equity-related securities (including warrants) and debt with equity features from either private or public issuers;
|
|
|
·
|
Debt obligations of all types having varying terms with respect to security or credit support, subordination, purchase price, interest payments and maturity;
|
|
|
·
|
Intellectual property or patents or research and development in technology or product development that may lead to patents or other marketable technology; and
|
|
|
·
|
Miscellaneous investments.
|
Investments and Strategies
The following is a summary description of the types of assets in which we may invest, the investment strategies we may use and the attendant risks associated with our investments and strategies.
Venture Capital Investments
We define venture capital as the money and resources made available to privately held start-up firms and privately held and publicly traded small businesses with exceptional growth potential. These businesses can range in stage from pre-revenue to generating positive cash flow. Substantially all of our long-term venture capital investments are in thinly capitalized, unproven, small companies focused on commercializing risky technologies. These businesses also tend to lack management depth, to have limited or no history of operations and to have not attained profitability. Because of the speculative nature of these investments, these securities have a significantly greater risk of loss than traditional investment
securities. Some of our venture capital investments will never realize their potential, and some will be unprofitable or result in complete loss of our investment.
We may own 100 percent of the securities of a start-up investment for a period of time and may control the company for a substantial period. Start-up companies are more vulnerable to adverse business or economic developments than better capitalized companies. Start-up businesses generally have limited product lines, markets and/or financial resources. Start-up companies are not well-known to the investing public and are subject to general movements in markets, to perceptions of potential growth and to potential bankruptcy.
In connection with our venture capital investments, we may participate in providing a variety of services to our portfolio companies, including the following:
|
|
·
|
formulating operating strategies;
|
|
|
·
|
formulating intellectual property strategies;
|
|
|
·
|
assisting in financial planning;
|
|
|
·
|
providing management in the initial start-up stages; and
|
|
|
·
|
establishing corporate goals.
|
We may assist in raising additional capital for these companies from other potential investors and may subordinate our own investment to that of other investors. We typically find it necessary or appropriate to provide additional capital of our own. We may introduce these companies to potential joint venture partners, suppliers and customers. In addition, we may assist in establishing relationships with investment bankers and other professionals. We may also assist with mergers and acquisitions ("M&As"). We do not currently derive income from these companies for the performance of any of the above services.
We may control, be represented on, or have observer rights on the Board of Directors of a portfolio company through one or more of our officers or directors, who may also serve as officers of the portfolio company. We indemnify our officers and directors for serving on the Boards of Directors or as officers of portfolio companies, which exposes us to additional risks. Particularly during the early stages of an investment, we may, in rare instances, in effect be conducting the operations of the portfolio company. As a venture capital-backed company emerges from the developmental stage with greater management depth and experience, we expect that our role in the portfolio company’s operations will diminish. Our goal is
to assist each company in establishing its own independent capitalization, management and Board of Directors. We expect to be able to reduce our involvement in those start-up companies that become successful, as well as in those start-up companies that fail.
Equity, Equity-Related Securities and Debt with Equity Features
We may invest in equity, equity-related securities and debt with equity features. These securities include common stock, preferred stock, debt instruments convertible into common or preferred stock, limited partnership interests, other beneficial ownership interests and warrants, options or other rights to acquire any of the foregoing.
We may make investments in companies with operating histories that are unprofitable or marginally profitable, that have negative net worth or that are involved in bankruptcy or reorganization proceedings. These investments would involve businesses that management believes have potential through the infusion of additional capital and management assistance. In addition, we may make investments in connection with the acquisition or divestiture of companies or divisions of companies. There is a significantly greater risk of loss with these types of securities than is the case with traditional investment securities.
Warrants, options and convertible or exchangeable securities generally give the investor the right to acquire specified equity securities of an issuer at a specified price during a specified period or on a specified date. Warrants and options fluctuate in value in relation to the value of the underlying security and the remaining life of the warrant or option, while convertible or exchangeable securities fluctuate in value both in relation to the intrinsic value of the security without the conversion or exchange feature and in relation to the value of the conversion or exchange feature, which is like a warrant or option. When we invest in these securities, we incur the risk that the option feature will expire worthless, thereby either
eliminating or diminishing the value of our investment.
Most of our current portfolio company investments are in the equity securities of private companies. Investments in equity securities of private companies often involve securities that are restricted as to sale and cannot be sold in the open market without registration under the Securities Act of 1933 or pursuant to a specific exemption from these registrations. Opportunities for sale are more limited than in the case of marketable securities, although these investments may be purchased at more advantageous prices and may offer attractive investment opportunities. Even if one of our portfolio companies completes an initial public offering ("IPO"), we are typically subject to a lock-up agreement for 180 days, and the stock price may
decline substantially before we are free to sell.
We may also invest in publicly traded securities of whatever nature, including relatively small, emerging growth companies that management believes have long-term growth potential. These investments may be through open-market transactions or through private placements in publicly traded companies ("PIPEs"). Securities purchased in PIPE transactions are typically subject to a lock-up agreement for 180 days, or are issued as unregistered securities that are not freely available for six months.
Even if we have registration rights to make our investments in privately held and publicly traded companies more marketable, a considerable amount of time may elapse between a decision to sell or register the securities for sale and the time when we are able to sell the securities. The prices obtainable upon sale may be adversely affected by market conditions or negative conditions affecting the issuer during the intervening time. We may elect to hold formerly restricted securities after they have become freely marketable, either because they remain relatively illiquid or because we believe that they may appreciate in value, during which holding period they may decline in value and be especially volatile as unseasoned securities. If
we need funds for investment or working capital purposes, we might need to sell marketable securities at disadvantageous times or prices.
Debt Obligations
We may hold debt securities, including in privately held and thinly traded public companies, for income and as a reserve pending more speculative investments. Debt obligations may include U.S. government and agency securities, commercial paper, bankers’ acceptances, receivables or other asset-based financing, notes, bonds, debentures, or other debt obligations of any nature and repurchase agreements related to these securities. These obligations may have varying terms with respect to security or credit support, subordination, purchase price, interest payments and maturity from private, public or governmental issuers of any type located anywhere in the world. We may invest in debt obligations of companies with operating
histories that are unprofitable or marginally profitable, that have negative net worth or are involved in bankruptcy or reorganization proceedings, or that are start-up or development-stage entities. In addition, we may participate in the acquisition or divestiture of companies or divisions of companies through issuance or receipt of debt obligations. As of December 31, 2010, the debt obligations held in our portfolio consisted of convertible bridge notes, senior secured non-convertible debt through a participation agreement and U.S. Treasury securities. The convertible bridge notes generally do not generate cash payments to us, nor are they held for that purpose. Our convertible bridge notes and the interest accrued thereon are held for the purpose of potential conversion into equity at a future date.
Our investments in debt obligations may be of varying quality, including non-rated, unsecured, highly speculative debt investments with limited marketability. Investments in lower-rated and non-rated securities, commonly referred to as "junk bonds," including our venture debt investments, are subject to special risks, including a greater risk of loss of principal and non-payment of interest. Generally, lower-rated securities offer a higher return potential than higher-rated securities, but involve greater volatility of price and greater risk of loss of income and principal, including the possibility of default or bankruptcy of the issuers of these securities. Lower-rated securities and comparable non-rated securities will likely
have large uncertainties or major risk exposure to adverse conditions and are predominantly speculative with respect to the issuer’s capacity to pay interest and repay principal in accordance with the terms of the obligation. The occurrence of adverse conditions and uncertainties to issuers of lower-rated securities would likely reduce the value of lower-rated securities held by us, with a commensurate effect on the value of our shares.
The markets in which lower-rated securities or comparable non-rated securities are traded generally are more limited than those in which higher-rated securities are traded. The existence of limited markets for these securities may restrict our ability to obtain accurate market quotations for the purposes of valuing lower-rated or non-rated securities and calculating net asset value or to sell securities at their fair value. Any economic downturn could adversely affect the ability of issuers’ lower-rated securities to repay principal and pay interest thereon. The market values of lower-rated and non-rated securities also tend to be more sensitive to individual corporate developments and changes in economic conditions than
higher-rated securities. In addition, lower-rated securities and comparable non-rated securities generally present a higher degree of credit risk. Issuers of lower-rated securities and comparable non-rated securities are often highly leveraged and may not have more traditional methods of financing available to them, so that their ability to service their debt obligations during an economic downturn or during sustained periods of rising interest rates may be impaired. The risk of loss owing to default by these issuers is significantly greater because lower-rated securities and comparable non-rated securities generally are unsecured and frequently are subordinated to the prior payment of senior indebtedness. We may incur additional expenses to the extent that we are required to seek recovery upon a default in the payment of principal or interest on our portfolio holdings.
The market value of investments in debt securities that carry no equity participation usually reflects yields generally available on securities of similar quality and type at the time purchased. When interest rates decline, the market value of a debt portfolio already invested at higher yields can be expected to rise if the securities are protected against early call. Similarly, when interest rates increase, the market value of a debt portfolio already invested at lower yields can be expected to decline. Deterioration in credit quality also generally causes a decline in market value of the security, while an improvement in credit quality generally leads to increased value.
Foreign Securities
We may make investments in securities of issuers whose principal operations are conducted outside the United States, and whose earnings and securities are stated in foreign currency. In order to maintain our status as a BDC, our investments in non-qualifying assets, including the securities of companies organized outside the U.S., would be limited to 30 percent of our assets, because we must invest at least 70 percent of our assets in "qualifying assets," and securities of foreign companies are not "qualifying assets."
Compared to otherwise comparable investments in securities of U.S. issuers, currency exchange risk of securities of foreign issuers is a significant variable. The value of these investments to us will vary with the relation of the currency in which they are denominated to the U.S. dollar, as well as with intrinsic elements of value such as credit risk, interest rates and performance of the issuer. Investments in foreign securities also involve risks relating to economic and political developments, including nationalization, expropriation of assets, currency exchange freezes and local recession. Securities of many foreign issuers are less liquid and more volatile than those of comparable U.S. issuers. Interest and dividend
income and capital gains on our foreign securities may be subject to withholding and other taxes that may not be recoverable by us. We may seek to hedge all or part of the currency risk of our investments in foreign securities through the use of futures, options and forward currency purchases or sales.
Intellectual Property
We believe there is a role for organizations that can assist in technology transfer. Scientists and institutions that develop and patent intellectual property perceive the need for and rewards of entrepreneurial commercialization of their inventions.
Our form of investment may be:
|
|
·
|
funding research and development in the development of a technology;
|
|
|
·
|
obtaining licensing rights to intellectual property or patents;
|
|
|
·
|
acquiring intellectual property or patents; or
|
|
|
·
|
forming and funding companies or joint ventures to commercialize further intellectual property.
|
Income from our investments in intellectual property or its development may take the form of participation in licensing or royalty income, fee income, or some other form of remuneration. In order to satisfy RIC requirements, these investments will normally be held in an entity taxable as a corporation. Investment in developmental intellectual property rights involves a high degree of risk that can result in the loss of our entire investment as well as additional risks, including uncertainties as to the valuation of an investment and potential difficulty in liquidating an investment. Further, investments in intellectual property generally require investor patience, as investment return may be realized only after or over a long
period. At some point during the commercialization of a technology, our investment may be transformed into ownership of securities of a development-stage or start-up company, as discussed under "Venture Capital Investments" above.
Borrowing and Margin Transactions
We may from time to time borrow money or obtain credit by any lawful means from banks, lending institutions, other entities or individuals, in negotiated transactions. We may issue, publicly or privately, bonds, debentures or notes, in series or otherwise, with interest rates and other terms and provisions, including conversion rights, on a secured or unsecured basis, for any purpose, up to the maximum amounts and percentages permitted for BDCs under the 1940 Act. The 1940 Act currently prohibits us from borrowing any money or issuing any other senior securities (including preferred stock but excluding temporary borrowings of up to five percent of our assets), if after giving effect to the borrowing or issuance, the value of our total assets
less liabilities not constituting senior securities would be less than 200 percent of our senior securities. We may pledge assets to secure any borrowings. As of December 31, 2010, we had no debt and have no current intention to issue preferred stock.
A primary purpose of our borrowing power is for leverage, to increase our ability to acquire venture debt investments both by acquiring larger positions and by acquiring more positions while maintaining a substantial balance of cash on our balance sheet. As discussed in more detail below in Management's Discussion and Analysis of Financial Condition and Results of Operations, we believe we need a strong balance sheet to have access to the best deal flow. Borrowings for leverage accentuate any increase or decrease in the market value of our investments and thus our net asset value. Because any decline in the net asset value of our investments will be borne first by holders of common stock, the effect of leverage in a declining market
would be a greater decrease in net asset value applicable to the common stock than if we were not leveraged. Any decrease would likely be reflected in a decline in the market price of our common stock. To the extent the income derived from assets acquired with borrowed funds exceeds the interest and other expenses associated with borrowing, our total income will be greater than if borrowings were not used. Conversely, if the income from assets is not sufficient to cover the borrowing costs, our total income will be less than if borrowings were not used. If our current income is not sufficient to meet our borrowing costs (repayment of principal and interest), we might have to liquidate some or all of our investments when it may be disadvantageous to do so. Our borrowings for the purpose of buying most liquid equity securities will be subject to the margin rules, which require excess liquid collateral marked to market daily. If we
are unable to post sufficient collateral, we will be required to sell securities to remain in compliance with the margin rules. These sales might be at disadvantageous times or prices.
Repurchase of Shares
Our shareholders do not have the right to compel us to redeem our shares. We may, however, purchase outstanding shares of our common stock from time to time, subject to approval of our Board of Directors and compliance with applicable corporate and securities laws. The Board of Directors may authorize purchases from time to time when they are deemed to be in the best interests of our shareholders, but could do so only after notification to shareholders. The Board of Directors may or may not decide to undertake any purchases of our common stock.
Our repurchases of our common shares would decrease our total assets and would therefore likely have the effect of increasing our expense ratio. Subject to our investment restrictions, we may borrow money to finance the repurchase of our common stock in the open market pursuant to any tender offer. Interest on any borrowings to finance share repurchase transactions will reduce our net assets. If, because of market fluctuations or other reasons, the value of our assets falls below the required 1940 Act coverage requirements, we may have to reduce our borrowed debt to the extent necessary to comply with the requirement. To achieve a reduction, it is possible that we may be required to sell portfolio securities at
inopportune times when it may be disadvantageous to do so.
Portfolio Company Turnover
Changes with respect to portfolio companies will be made as our management considers necessary in seeking to achieve our investment objective. The rate of portfolio turnover will not be treated as a limiting or relevant factor when circumstances exist, which are considered by management to make portfolio changes advisable.
Although we expect that many of our investments will be relatively long term in nature, we may make changes in our particular portfolio holdings whenever it is considered that an investment no longer has substantial growth potential or has reached its anticipated level of performance, or (especially when cash is not otherwise available) that another investment appears to have a relatively greater opportunity for capital appreciation. We may also make general portfolio changes to increase our cash to position us in a defensive posture. We may make portfolio changes without regard to the length of time we have held an investment, or whether a sale results in profit or loss, or whether a purchase results in the reacquisition of an investment that
we may have only recently sold. Our investments in privately held companies are illiquid, which limits portfolio turnover. The portfolio turnover rate may vary greatly during a year as well as from year to year and may also be affected by cash requirements.
Competition
Numerous companies and individuals are engaged in the venture capital business, and such business is intensely competitive. We believe the perpetual nature of our corporate structure enables us to be a better long-term partner for our portfolio companies than if we were organized as a traditional private equity fund that typically has a limited life. We believe that we have invested in more nanotechnology-enabled companies than any venture capital firm and that we have assembled a team of investment professionals that have scientific and intellectual property expertise that is relevant to investing in nanotechnology. Nevertheless, many of our competitors have significantly greater financial and other resources than we do and are,
therefore, in certain respects, in a better position than we are to obtain access to attractive venture capital investments. There can be no assurance that we will be able to compete against these venture capital businesses for attractive investments, particularly in capital-intensive companies.
Regulation
The Small Business Investment Incentive Act of 1980 added the provisions of the 1940 Act applicable only to BDCs. BDCs are a special type of investment company. After a company files its election to be treated as a BDC, it may not withdraw its election without first obtaining the approval of holders of a majority of its outstanding voting securities. The following is a brief description of the 1940 Act provisions applicable to BDCs, qualified in its entirety by reference to the full text of the 1940 Act and the rules issued thereunder by the Securities and Exchange Commission ("SEC").
Generally, to be eligible to elect BDC status, a company must primarily engage in the business of furnishing capital and making significant managerial assistance available to companies that do not have ready access to capital through conventional financial channels. Such companies that satisfy certain additional criteria described below are termed "eligible portfolio companies." In general, in order to qualify as a BDC, a company must: (i) be a domestic company; (ii) have registered a class of its securities pursuant to Section 12 of the Securities Exchange Act of 1934 (the "Exchange Act"); (iii) operate for the purpose of investing in the securities of certain types of portfolio companies, including early-stage or emerging companies and
businesses suffering or just recovering from financial distress (see following paragraph); (iv) make available significant managerial assistance to such portfolio companies; and (v) file a proper notice of election with the SEC.
An eligible portfolio company generally is a domestic company that is not an investment company or a company excluded from investment company status pursuant to exclusions for certain types of financial companies (such as brokerage firms, banks, insurance companies and investment banking firms) and that: (i) has a fully diluted market capitalization of less than $250 million and has a class of equity securities listed on a national securities exchange, (ii) does not have a class of securities listed on a national securities exchange, or (iii) is controlled by the BDC by itself or together with others (control under the 1940 Act is presumed to exist where a person owns at least 25 percent of the outstanding voting securities of the portfolio company) and has a
representative on the Board of Directors of such company.
We may be periodically examined by the SEC for compliance with the 1940 Act.
As with other companies regulated by the 1940 Act, a BDC must adhere to certain substantive regulatory requirements. A majority of the directors must be persons who are not interested persons, as that term is defined in the 1940 Act. Additionally, we are required to provide and maintain a bond issued by a reputable fidelity insurance company to protect the BDC. Furthermore, as a BDC, we are prohibited from protecting any director or officer against any liability to us or our shareholders arising from willful malfeasance, bad faith, gross negligence or reckless disregard of the duties involved in the conduct of such person's office.
The 1940 Act provides that we may not make an investment in non-qualifying assets unless at the time at least 70 percent of the value of our total assets (measured as of the date of our most recently filed financial statements) consists of qualifying assets. Qualifying assets include: (i) securities of eligible portfolio companies; (ii) securities of certain companies that were eligible portfolio companies at the time we initially acquired their securities and in which we retain a substantial interest; (iii) securities of certain controlled companies; (iv) securities of certain bankrupt, insolvent or distressed companies; (v) securities received in exchange for or distributed in or with respect to any of the foregoing; and (vi) cash items, U.S. government securities and high quality short-term
debt. The SEC has adopted a rule permitting a BDC to invest its cash in certain money market funds. The 1940 Act also places restrictions on the nature of the transactions in which, and the persons from whom, securities can be purchased in some instances in order for the securities to be considered qualifying assets.
We are permitted by the 1940 Act, under specified conditions, to issue multiple classes of debt and a single class of preferred stock if our asset coverage, as defined in the 1940 Act, is at least 200 percent after the issuance of the debt or the preferred stock (i.e., such senior securities may not be in excess of our net assets). Under specific conditions, we are also permitted by the 1940 Act to issue warrants.
Except under certain conditions, we may sell our securities at a price that is below the prevailing net asset value per share only during the 12-month period after (i) a majority of our directors and our disinterested directors have determined that such sale would be in the best interest of us and our stockholders and (ii) the holders of a majority of our outstanding voting securities and the holders of a majority of our voting securities held by persons who are not affiliated persons of ours approve our ability to make such issuances. A majority of the disinterested directors must determine in good faith that the price of the securities being sold is not less than a price which closely approximates the market value of the securities, less any distribution discount or commission.
Certain transactions involving certain closely related persons of the Company, including its directors, officers and employees, may require the prior approval of the SEC. However, the 1940 Act ordinarily does not restrict transactions between us and our portfolio companies.
Subchapter M Status
We elected to be treated as a RIC, taxable under Subchapter M of the Internal Revenue Code of 1986 (the "Code"), for federal income tax purposes. In general, a RIC is not taxable on its income or gains to the extent it distributes such income or gains to its shareholders. In order to qualify as a RIC, we must, in general, (1) annually derive at least 90 percent of our gross income from dividends, interest and gains from the sale of securities and similar sources (the "Income Source Rule"); (2) quarterly meet certain investment asset diversification requirements; and (3) annually distribute at least 90 percent of our investment company taxable income as a dividend (the "Income Distribution Rule"). Any taxable investment company income not distributed will be subject to
corporate level tax. Any taxable investment company income distributed generally will be taxable to shareholders as dividend income.
In addition to the requirement that we must annually distribute at least 90 percent of our investment company taxable income, we may either distribute or retain our realized net capital gains from investments, but any net capital gains not distributed may be subject to corporate level tax. It is our current intention not to distribute net capital gains. Any net capital gains distributed generally will be taxable to shareholders as long-term capital gains.
In lieu of actually distributing our realized net capital gains, we as a RIC may retain all or part of our net capital gains and elect to be deemed to have made a distribution of the retained portion to our shareholders under the "designated undistributed capital gain" rules of the Code. We currently intend to retain and so designate all of our net capital gains. In this case, the "deemed dividend" generally is taxable to our shareholders as long-term capital gains. Although we pay tax at the corporate rate on the amount deemed to have been distributed, our shareholders receive a tax credit equal to their proportionate share of the tax paid and an increase in the tax basis of their shares by the amount per share retained by us.
To the extent that we declare a deemed dividend, each shareholder will receive an IRS Form 2439 that will reflect each shareholder's receipt of the deemed dividend income and a tax credit equal to each shareholder's proportionate share of the tax paid by us. This tax credit, which is paid at the corporate rate, is often credited at a higher rate than the actual tax due by a shareholder on the deemed dividend income. The "residual" credit can be used by the shareholder to offset other taxes due in that year or to generate a tax refund to the shareholder. Tax exempt investors may file for a refund.
The following simplified examples illustrate the tax treatment under Subchapter M of the Code for us and our individual shareholders with regard to three possible distribution alternatives, assuming a net capital gain of $1.00 per share, consisting entirely of sales of non-real property assets held for more than 12 months.
Under Alternative A: 100 percent of net capital gain declared as a cash dividend and distributed to shareholders:
1. No federal taxation at the Company level.
2. Taxable shareholders receive a $1.00 per share dividend and pay federal tax at a rate not in excess of 15 percent* or $.15 per share, retaining $.85 per share.
3. Non-taxable shareholders that file a federal tax return receive a $1.00 per share dividend and pay no federal tax, retaining $1.00 per share.
Under Alternative B (Current Tax Structure Employed): 100 percent of net capital gain retained by the Company and designated as "undistributed capital gain" or deemed dividend:
1. The Company pays a corporate-level federal income tax of 35 percent on the undistributed gain or $.35 per share and retains 65 percent of the gain or $.65 per share.
2. Taxable shareholders increase their cost basis in their stock by $.65 per share. They pay federal capital gains tax at a rate not in excess of 15 percent* on 100 percent of the undistributed gain of $1.00 per share or $.15 per share in tax. Offsetting this tax, shareholders receive a tax credit equal to 35 percent of the undistributed gain or $.35 per share.
3. Non-taxable shareholders that file a federal tax return receive a tax refund equal to $.35 per share.
*Assumes all capital gains qualify for long-term rates of 15 percent, which may increase for gains realized after December 31, 2010.
Under Alternative C: 100 percent of net capital gain retained by the Company, with no designated undistributed capital gain or deemed dividend:
1. The Company pays a corporate-level federal income tax of 35 percent on the retained gain or $.35 per share plus an excise tax of four percent of $.98 per share, or about $.04 per share.
2. There is no tax consequence at the shareholder level.
Although we may retain income and gains subject to the limitations described above (including paying corporate level tax on such amounts), we could be subject to an additional four percent excise tax if we fail to distribute 98 percent of our aggregate annual taxable income.
As noted above, in order to qualify as a RIC, we must meet certain investment asset diversification requirements each quarter. Because of the specialized nature of our investment portfolio, in some years we have been able to satisfy the diversification requirements under Subchapter M of the Code primarily as a result of receiving certifications from the SEC under the Code with respect to each taxable year beginning after 1998 that we were "principally engaged in the furnishing of capital to other corporations which are principally engaged in the development or exploitation of inventions, technological improvements, new processes, or products not previously generally available" for such year.
Although we received SEC certifications for 1999-2009, there can be no assurance that we will receive such certification for subsequent years (to the extent we need additional certifications as a result of changes in our portfolio). In 2010, we qualified for RIC treatment even without certification. If we require, but fail to obtain, the SEC certification for a taxable year, we may fail to qualify as a RIC for such year. We will also fail to qualify as a RIC for a taxable year if we do not satisfy the Income Source Rule or Income Distribution Rule for such year. In the event we do not qualify as a RIC for any taxable year, we will be subject to federal tax with respect to all of our taxable income, whether or not
distributed. In addition, all our distributions to shareholders in that situation generally will be taxable as ordinary dividends.
Although we generally intend to qualify as a RIC for each taxable year, under certain circumstances we may choose to take action with respect to one or more taxable years to ensure that we would be taxed under Subchapter C of the Code (rather than Subchapter M) for such year or years. We will choose to take such action only if we determine that the result of the action will benefit us and our shareholders.
Subsidiaries
Harris & Harris Enterprises, Inc.SM ("Enterprises"), is a 100 percent wholly owned subsidiary of the Company and is consolidated in our financial statements. Enterprises holds the lease for our office space in Palo Alto, California, is a partner in Harris Partners I, L.P. SM, and is taxed as a C Corporation. Harris Partners I, L.P., is a limited partnership. The partners of Harris Partners I, L.P., are Enterprises (sole general partner) and the Company (sole limited partner). Enterprises, as the sole general partner, consolidates Harris Partners I, L.P.
Available Information
Additional information about us, including our Annual Report on Form 10-K, quarterly reports on Form 10-Q, current reports on Form 8-K and amendments to those reports filed or furnished pursuant to Section 13(a) or 15(d) of the Exchange Act, are available free of charge on our website at www.HHVC.com. Information on our website is not part of this Annual Report on Form 10-K.
Employees
We currently employ directly 10 permanent, full-time employees.
Item 1A. Risk Factors.
Investing in our common stock involves significant risks relating to our business and investment objective. You should carefully consider the risks and uncertainties described below before you purchase any shares of our common stock. These risks and uncertainties are not the only ones we face. Unknown additional risks and uncertainties, or ones that we currently consider immaterial, may also impair our business. If any of these risks or uncertainties materialize, our business, financial condition or results of operations could be materially adversely affected. In this event, the trading price of our common stock could decline, and you could lose all or part of your investment.
Risks related to the companies in our portfolio.
The difficult venture capital investment and capital market climates could increase the non-performance risk for our portfolio companies.
While the public markets have rebounded from the lows of March 2009 and corporate profits and growth are improving, unemployment remains high, and there are global instabilities, including sovereign debt issues and the potential for inflation. Even with signs of economic improvement, the availability of capital for venture capital firms and venture-backed companies continues to be limited. Currently, financing for capital-intensive companies remains difficult. Historically, difficult venture environments have resulted in a higher than normal number of companies not receiving financing and being subsequently closed down with a loss to venture investors, and other companies receiving financing but at significantly lower valuations than the preceding financing
rounds. This issue is compounded by the fact that many existing venture capital firms have few remaining years of investment and available capital owing to the finite lifetime of the funds managed by these firms. Additionally, even if a firm was able to raise a new fund, commonly new funds are not permitted to invest with old funds in existing investments. As such, the currently improving exit environment for venture-backed companies through IPOs and M&A transactions and the currently improving public markets in general may not translate to an increase in the available capital to venture-backed companies, particularly those that have investments from funds that are in the latter stage of life unless it continues for some time into the future.
We believe that these factors continue to introduce significant non-performance risk for venture-backed companies that need to raise additional capital or that require substantial amounts of capital to execute on their business plans. We define non-performance risk as the risk that a portfolio company will be: (a) unable to raise capital, will need to be shut down and will not return our invested capital; or (b) able to raise capital, but at a valuation significantly lower than the implied post-money valuation. In these circumstances, the portfolio company could be recapitalized at a valuation significantly lower than the post-money valuation implied by our valuation method, sold at a loss to our investment or shut down. In addition, significant changes in the capital markets,
including the recent extreme volatility and disruption, have had, and may in the future have, a negative effect on the valuations of our investments and on the potential for liquidity events involving our investments. We believe further that the long-term effects of the difficult venture capital investment and difficult, but improving, exit environments will continue to affect negatively the fundraising ability of some companies regardless of near-term improvements in the overall global economy and public markets.
The average length of time from founding to a liquidity event is at historical highs, which could result in companies remaining in our portfolio longer, leading to lower returns, write-downs and write-offs.
Beginning in about 2001, many fewer venture capital-backed companies per annum have been able to complete IPOs than in the years of the previous decade. The IPO and M&A markets improved in 2010 from those in 2009. On average, however, more capital and more time than in previous decades are required for companies to reach these liquidity events. This trend could lead to companies staying longer in our portfolio as private entities that may require additional funding. In the best case, such stagnation would dampen returns, and in the worst case, could lead to write-downs and write-offs as some companies run short of cash and have to accept lower valuations in private financings or are not able to access additional capital at all. The difficult venture capital climate is
also causing some venture capital firms to change their investment strategies. Accordingly, some venture capital firms are reducing funding of their portfolio companies, making it more difficult for such companies to access capital and to fulfill their potential. In some cases this leads to write-downs and write-offs of such companies by other venture capital firms, such as ourselves, who are co-investors in such companies.
Investing in small, privately held and publicly traded companies involves a high degree of risk and is highly speculative.
We have invested a substantial portion of our assets in privately held companies, the securities of which are inherently illiquid. We also seek to invest in small publicly traded companies that we believe have exceptional growth potential. Although these companies are publicly traded, their stock may not trade at high volumes and prices can be volatile, which may restrict our ability to sell our positions. These privately held and publicly traded businesses tend to lack management depth, to have limited or no history of operations and to have not attained profitability. Companies commercializing products enabled by nanotechnology or microsystems are especially risky, involving scientific, technological and commercialization risks. Because of the speculative
nature of these investments, these securities have a significantly greater risk of loss than traditional investment securities. Some of our venture capital investments are likely to be complete losses or unprofitable, and some will never realize their potential. We have been and will continue to be risk seeking rather than risk averse in our approach to venture capital and other investments. Neither our investments nor an investment in our common stock is intended to constitute a balanced investment program.
We may invest in companies working with technologies or intellectual property that currently have few or no proven commercial applications.
Nanotechnology, in particular, is a developing area of technology, of which much of the future commercial value is difficult to estimate and subject to widely varying interpretations. It is a general purpose technology that is applicable to a diverse set of industries. As such, nanotechnology-enabled products must compete against existing products or enable a completely new product in an emerging or existing industry. The timing of additional future commercially available nanotechnology-enabled products and the industries on which nanotechnology will have the most significant impact are highly uncertain. To date, some of our portfolio companies have not developed any commercially available products. In addition, our portfolio companies may not be able to
manufacture successfully or to market their products in order to achieve commercial success. Further, the products may never gain commercial acceptance.
Our portfolio companies working with nanotechnology and microsystems may be particularly susceptible to intellectual property litigation.
Research and commercialization efforts in nanotechnology and microsystems are being undertaken by a wide variety of government, academic and private corporate entities. As additional commercially viable applications of nanotechnology emerge, ownership of intellectual property on which these products are based may be contested. From time to time, our portfolio companies are or have been involved in intellectual property disputes and litigation. Any litigation over the ownership of, or rights to, any of our portfolio companies’ technologies or products could have a material adverse effect on those companies’ values.
The value of our portfolio could be adversely affected if the technologies utilized by our portfolio companies are found, or even rumored or feared, to cause health or environmental risks, or if legislation is passed that limits the commercialization of any of these technologies.
Nanotechnology has received both positive and negative publicity and is the subject increasingly of public discussion and debate. For example, debate regarding the production of materials that could cause harm to the environment or the health of individuals could raise concerns in the public’s perception of nanotechnology, not all of which might be rational or scientifically based. Nanotechnology in particular is currently the subject of health and environmental impact research. If health or environmental concerns about nanotechnology or microsystems were to arise, whether or not they had any basis in fact, our portfolio companies might incur additional research, legal and
regulatory expenses, and might have difficulty raising capital or marketing their products. Government authorities could, for social or other purposes, prohibit or regulate the use of nanotechnology. Legislation could be passed that could circumscribe the commercialization of any of these technologies.
Our Nanotech for CleantechSM, Nanotech for ElectronicsSM and Nanotech for HealthcareSM portfolios are currently the largest portion of our venture capital portfolio, and, therefore, fluctuations in the value of the companies in these portfolios may
adversely affect our net asset value per share to a greater degree than other sectors of our portfolio.
The three largest portions of our portfolio are our Nanotech for CleantechSM, Nanotech for ElectronicsSM and Nanotech for HealthcareSM portfolios. Our Nanotech for CleantechSM portfolio consists of companies commercializing nanotechnology-enabled products targeted at cleantech-related markets. There are risks in investing in companies that target cleantech-related markets, including the rapid and sometimes dramatic price fluctuations of commodities, particularly oil and sugar, and of
public equities, the reliance on the capital and debt markets to finance large capital outlays, change in climate, including climate-related regulations, and the dependence on government subsidies to be cost-competitive with non-cleantech solutions. For example, the attractiveness of alternative methods for the production of biobutanol and biodiesel can be adversely affected by a decrease in the demand or price of oil. The demand for solar cells is driven partly by government subsidies and the availability of credit to finance the purchase and installation of the system. Adverse developments in any of these sectors may significantly affect the value of our Nanotech for CleantechSM portfolio, and thus our venture capital portfolio as a whole. Additionally, companies with cleantech platforms are currently in favor with the media and investors. Cleantech
companies in general may have a harder time accessing capital in the future if this level of interest subsides.
Our Nanotech for ElectronicsSM portfolio consists of companies commercializing and integrating nanotechnology-enabled products targeted at electronics-related markets. There are risks in investing in companies that target electronics-related markets, including rapid and sometimes dramatic price erosion of products, the reliance on capital and debt markets to finance large capital outlays, including fabrication facilities, the reliance on partners outside of the United States, particularly in Asia, and inherent cyclicality of the electronics market in general. Additionally, electronics-related companies are currently out of favor with many venture capital firms. Therefore, access to capital may be
difficult or impossible for companies in our portfolio that are pursuing these markets.
Our Nanotech for HealthcareSM portfolio consists of companies that commercialize and integrate products enabled by nanotechnology and microsystems in healthcare-related industries, including biotechnology, pharmaceuticals, diagnostics and medical devices. There are risks in investing in companies that target healthcare-related industries, including but not limited to the uncertainty of timing and results of clinical trials to demonstrate the safety and efficacy of products; failure to obtain any required regulatory approval of products; failure to develop manufacturing processes that meet regulatory standards; competition, in particular from companies that develop rival products; and the ability to protect proprietary
technology. Adverse developments in any of these areas may adversely affect the value of our Nanotech for HealthcareSM portfolio.
The three main industry clusters around which our nanotechnology investments have developed are all capital intensive.
The industry clusters where nanotechnology and microsystems are gaining the greatest traction, cleantech, electronics and healthcare, are all capital intensive. Currently, financing for capital-intensive companies remains difficult. In some successful companies, we believe we may need to invest more than we currently have planned to invest in these companies. There can be no assurance that we will have the capital necessary to make such investments. In addition, investing greater than planned amounts in our portfolio companies could limit our ability to pursue new investments and fund follow-on investments. Both of these situations could cause us to miss investment opportunities or limit our ability to protect existing investments from dilution or other
actions or events that would decrease the value and potential return from these investments.
Our portfolio companies may generate revenues from the sale of products that are not enabled by nanotechnology.
We consider a company to be enabled by nanotechnology or microsystems if a product or products, or intellectual property covering a product or products, that we consider to be at the microscale or smaller is material to its business plan. The core business of some of these companies may not be nanotechnology-enabled products, and, therefore, their success or failure may not be dependent upon the nanotechnology aspects of their business. In addition to developing products that we consider nanotechnology, some of these companies may also develop products that we do not consider enabled by nanotechnology. Some of these companies will generate revenues from the sale of non-nanotechnology-enabled products. Additionally, it is possible that a portfolio company may decide to change its business
focus after our initial investment and decide to develop and commercialize non-nanotechnology-enabled products.
Our venture debt investments may be extremely risky, and we could lose all or part of our investments.
A portfolio company’s failure to satisfy financial or operating covenants imposed by us or other lenders could lead to defaults and, potentially, termination of its loans and foreclosure on its assets, which could trigger cross-defaults under other agreements and jeopardize our portfolio company’s ability to meet its obligations under the debt securities that we hold. We may incur expenses to the extent necessary to seek recovery upon default or to negotiate new terms with a defaulting portfolio company. In addition, if a portfolio company goes bankrupt, even though we may have structured our interest as senior debt, depending on the facts and circumstances, including the extent to which we actually provided significant "managerial assistance" to that portfolio company, a
bankruptcy court might recharacterize our debt holding and subordinate all or a portion of our claim to that of another creditor.
When we make a senior secured term loan investment in a portfolio company, we generally take a security interest in the available assets of the portfolio company, including the equity interests of its subsidiaries, which we expect to help mitigate the risk that we will not be repaid. However, there is a risk that the collateral securing our loans may decrease in value over time, may be difficult to sell in a timely manner, may be difficult to appraise and may fluctuate in value based upon the success of the business and market conditions, including as a result of the inability of the portfolio company to raise additional capital, and, in some circumstances, our lien could be subordinated to claims of other creditors. In addition, deterioration in a portfolio company’s financial
condition and prospects, including its inability to raise additional capital, may be accompanied by deterioration in the value of the collateral for the loan. Consequently, the fact that a loan is secured does not guarantee that we will receive principal and interest payments according to the loan’s terms, or at all, or that we will be able to collect on the loan should we be forced to enforce our remedies.
To the extent we use debt to finance our venture debt investments, changes in interest rates will affect our cost of capital and net investment income.
To the extent we borrow money to make venture debt investments, our net investment income will depend, in part, upon the difference between the rate at which we borrow funds and the rate at which we invest those funds. As a result, we can offer no assurance that a significant change in market interest rates will not have a material adverse effect on our net investment income in the event we use debt to finance our venture debt investments. In periods of rising interest rates, our cost of funds could increase, which could reduce our net investment income. Currently, our one venture debt investment is at a fixed rate. Some of our future debt investments may bear interest at variable rates and the interest income from these investments could be negatively affected
by decreases in market interest rates. In addition, an increase in interest rates would make it more expensive to use debt to finance our investments. As a result, a significant increase in market interest rates could increase our cost of capital, which would reduce our net investment income. A decrease in interest rates may have an adverse impact on our returns by requiring us to seek lower yields on our debt investments and by increasing the risk that our portfolio companies will prepay our debt investments, resulting in the need to redeploy capital at potentially lower rates. A decrease in market interest rates may also adversely impact our returns on our cash invested in treasury securities, which would reduce our net investment income.
On February 24, 2011, the Company established a new $10 million three-year revolving credit facility with TD Bank, N.A., to be used in conjunction with its investments in venture debt. As of March 15, 2011, we had $1,250,000 outstanding from our $10 million credit facility.
Our portfolio companies may incur debt that ranks senior to our investments in such companies.
We may make investments in our portfolio companies in the form of bridge notes that typically convert into preferred stock issued in the next round of financing of that portfolio company or other forms of convertible and non-convertible debt securities. The portfolio companies usually have, or may be permitted to incur, other debt that ranks senior to the debt securities in which we invest. By their terms, debt instruments may provide that the holders are entitled to receive payment of interest and principal on or before the dates on which we are entitled to receive payments in respect of the debt securities in which we invest. Also, in the case of insolvency, liquidation, dissolution, reorganization or bankruptcy of a portfolio company, holders of debt instruments ranking senior
to our investment in that portfolio company would typically be entitled to receive payment in full before we receive any distribution in respect of our investment. After repaying such senior creditors, such portfolio company may not have any remaining assets to use for repaying its obligations to us. In addition, in companies where we have made investments in the form of bridge notes or other debt securities, we may also have investments in equity in the form of preferred shares. In such a case, a bankruptcy court may subordinate our bridge notes and/or other debt securities to debt holders that do not have equity in the portfolio company.
Our portfolio companies face risks associated with international sales.
We anticipate that certain of our portfolio companies could generate revenue from international sales. Risks associated with these potential future sales include:
| |
·
|
Political and economic instability;
|
| |
·
|
Export controls and other trade restrictions;
|
| |
·
|
Changes in legal and regulatory requirements;
|
| |
·
|
U.S. and foreign government policy changes affecting the markets for the technologies;
|
| |
·
|
Changes in tax laws and tariffs;
|
| |
·
|
Convertibility and transferability of international currencies; and
|
| |
·
|
International currency exchange rate fluctuations.
|
The effect of global climate change may impact the operations of our portfolio companies.
There may be evidence of global climate change. Climate change creates physical and financial risk, and some of our portfolio companies may be adversely affected by climate change. For example, the needs of customers of energy companies vary with weather conditions, primarily temperature and humidity. To the extent weather conditions are affected by climate change, energy use could increase or decrease depending on the duration and magnitude of any changes. Increases in the cost of energy could adversely affect the cost of operations of our portfolio companies if the use of energy products or services is material to their business. A decrease in energy use due to weather changes may affect some of our portfolio companies’ financial condition through
decreased revenues. Extreme weather conditions in general require more system backup, adding to costs, and can contribute to increased system stresses, including service interruptions.
Risks related to the illiquidity of our investments.
We invest in illiquid securities and may not be able to dispose of them when it is advantageous to do so, or ever.
Most of our investments are or will be equity, equity-linked, or debt securities acquired directly from small companies. These securities are generally subject to restrictions on resale or otherwise have no established trading market. The illiquidity of most of our portfolio of securities may adversely affect our ability to dispose of these securities at times when it may be advantageous for us to liquidate these investments. We may never be able to dispose of these securities.
Unfavorable regulatory changes could impair our ability to engage in liquidity events.
Recent government reforms affecting publicly traded companies, stock markets, investment banks and securities research practices have made it more difficult for privately held companies to complete successful IPOs of their equity securities, and such reforms have increased the expense and legal exposure of being a public company. Public equity market response to companies offering nanotechnology-enabled products is uncertain. An inability to exit investments in our portfolio could negatively affect our liquidity, our reinvestment rate in new and follow-on investments and the value of our portfolio.
Even if some of our portfolio companies complete IPOs, the returns on our investments in those companies would be uncertain.
When companies in which we have invested as private entities complete IPOs of their securities, these newly issued securities are by definition unseasoned issues. Unseasoned issues tend to be highly volatile and have uncertain liquidity, which may negatively affect their price. In addition, we are typically subject to lock-up provisions that prohibit us from selling our investments into the public market for specified periods of time after IPOs. The market price of securities that we hold may decline substantially before we are able to sell these securities. Government reforms that affect the trading of securities in the United States have made market-making by broker-dealers less profitable, which has caused broker-dealers to reduce their market-making activities, thereby making the market for unseasoned stocks
less liquid than they might be otherwise.
Risks related to our Company.
Our business may be adversely affected by the state of the venture capital market and capital markets in general.
The economies of the United States and many other countries are just emerging from recession. While the public markets have rebounded from the lows of March 2009 and corporate profits and growth are improving, unemployment remains high, and there are global instabilities, including sovereign debt issues, popular revolts against established governments and the potential for inflation. These issues may persist for a substantial period and may slow or reverse the recovery of the global economy, which could be detrimental to the recovery of the venture capital industry.
Our business and results of operations could be impacted adversely by a number of follow-on effects of the difficult venture capital market that resulted from the recent financial crisis, including the inability of our portfolio companies to obtain sufficient financing to continue to operate as a going concern, an increase in our funding costs or the limitation on our access to the capital markets. A prolonged period of market illiquidity may have an adverse effect on our business, financial condition, and results of operations. Our nonperforming assets may increase, and the value of our portfolio may decrease if this period of market illiquidity persists. These events could limit our investment activity, limit our ability to grow and negatively impact our operating results.
Changes in regulations of the financial industry have adversely affected coverage of us by financial analysts. A number of analysts that have covered us in the past are no longer able to continue to do so owing to changes in employment, to restrictions on the size of companies they are allowed to cover and/or their firms have shut down operations. An inability to attract analyst coverage may adversely affect our ability to raise capital from investors, particularly institutional investors. Our inability to access the capital markets on favorable terms, or at all, may adversely affect our future financial performance. The inability to obtain adequate financing capital sources could force us to seek debt financing, self-fund strategic initiatives or even forgo certain opportunities, which in turn could potentially
harm our current and future performance.
Because there is generally no established market in which to value our investments, our Valuation Committee’s value determinations may differ materially from the values that a ready market or third party would attribute to these investments.
There is generally no public market for the private equity securities in which we invest. Pursuant to the requirements of the 1940 Act, we value all of the privately held equity and debt securities in our portfolio at fair value as determined in good faith by the Valuation Committee, a committee made up of all of the independent members of our Board of Directors, pursuant to Valuation Procedures established by the Board of Directors. Determining fair value requires that judgment be applied to the specific facts and circumstances of each portfolio investment pursuant to specified valuation principles and processes. We are required by the 1940 Act to value specifically each individual investment on a quarterly basis and record unrealized depreciation for an investment that we believe has become impaired.
Conversely, we must record unrealized appreciation if we believe that a security has appreciated in value. Our valuations, although stated as a precise number, are necessarily within a range of values that vary depending on the significance attributed to the various factors being considered.
We use the Black-Scholes-Merton option pricing model to determine the fair value of warrants held in our portfolio. Option pricing models, including the Black-Scholes-Merton model, require the use of subjective input assumptions, including expected volatility, expected life, expected dividend rate, and expected risk-free rate of return. In the Black-Scholes-Merton model, variations in the expected volatility or expected term assumptions have a significant impact on fair value. Because the securities underlying the warrants in our portfolio are not publicly traded, many of the required input assumptions are more difficult to estimate than they would be if a public market for the underlying securities existed.
Without a readily ascertainable market value and because of the inherent uncertainty of valuation, the fair value that we assign to our investments may differ from the values that would have been used had an efficient market existed for the investments, and the difference could be material. Any changes in fair value are recorded in our Consolidated Statement of Operations as a change in the "Net decrease (increase) in unrealized depreciation on investments."
In the venture capital industry, even when a portfolio of early-stage, high-technology venture capital investments proves to be profitable over the portfolio's lifetime, it is common for the portfolio's value to undergo a so-called "J-curve" valuation pattern. This means that when reflected on a graph, the portfolio’s valuation would appear in the shape of the letter "J," declining from the initial valuation prior to increasing in valuation. This J-curve valuation pattern results from write-downs and write-offs of portfolio investments that appear to be unsuccessful, prior to write-ups for portfolio investments that prove to be successful. Because early-stage companies typically have negative cash flow and are by their nature inherently fragile, a valuation process can more readily substantiate a loss of
value than an increase in value. Even if our venture capital investments prove to be profitable in the long run, such J-curve valuation patterns could have a significant adverse effect on our net asset value per share and the value of our common stock in the interim. Over time, as we continue to make additional nanotechnology investments, this J-curve pattern may be less relevant for our portfolio as a whole, because the individual J-curves for each investment, or series of investments, may overlap with previous investments at different stages of their J-curves.
Changes in valuations of our privately held, early-stage companies tend to be more volatile than changes in prices of established, more mature publicly traded securities.
Investments in privately held, early- and mid-stage companies are inherently more volatile than investments in more mature businesses. Such immature businesses are inherently fragile and easily affected by both internal and external forces. Our investee companies can lose much or all of their value suddenly in response to an internal or external adverse event. Conversely, these immature businesses can gain suddenly in value in response to an internal or external positive development. Moreover, because our ownership interests in such investments are generally valued only at quarterly intervals by our Valuation Committee, changes in valuations from one valuation point to another tend to be larger than changes in valuations of marketable securities that are revalued
in the marketplace much more frequently, in some highly liquid cases, virtually continuously. Although we carefully monitor each of our portfolio companies, information pertinent to our portfolio companies is not always known immediately by us, and, therefore, its availability for use in determining value may not always coincide with the timeframe of our valuations required by the federal securities laws.
We expect to continue to experience material write-downs of securities of portfolio companies.
Write-downs of securities of our privately held companies have always been a by-product and risk of our business. We expect to continue to experience material write-downs of securities of privately held portfolio companies. Write-downs of such companies occur at all stages of their development. Such write-downs may increase in dollar terms, frequency and as a percentage of our net asset value as our dollar investment activity in privately held companies continues to increase, and the number of such holdings in our portfolio continues to grow. If the average size of each of our investments in nanotechnology increases, the average size of our write-downs may also increase.
Because we do not choose investments based on a strategy of diversification, nor do we rebalance the portfolio should one or more investments increase in value substantially relative to the rest of the portfolio, the value of our portfolio is subject to greater volatility than the value of companies with more broadly diversified investments.
We do not choose investments based on a strategy of diversification. We also do not rebalance the portfolio should one of our portfolio companies increase in value substantially relative to the rest of the portfolio. Therefore, the value of our portfolio may be more vulnerable to events affecting a single sector or industry and, therefore, subject to greater volatility than a company that follows a diversification strategy. Accordingly, an investment in our common stock may present greater risk to you than an investment in a diversified company.
We are dependent upon key management personnel for future success, and may not be able to retain them.
We are dependent upon the diligence and skill of our senior management and other key advisers for the selection, structuring, closing and monitoring of our investments. We utilize lawyers, and we utilize outside consultants, including one of our directors, Lori D. Pressman, to assist us in conducting due diligence when evaluating potential investments. There is generally no publicly available information about the companies in which we invest, and we rely significantly on the diligence of our employees and advisers to obtain information in connection with our investment decisions. Our future success, to a significant extent, depends on the continued service and coordination of our senior management team, particularly on Douglas W. Jamison, our Chairman and Chief Executive Officer and a Managing Director; on
Daniel B. Wolfe, our President, Chief Operating Officer, Chief Financial Officer and a Managing Director; on Alexei A. Andreev, Executive Vice President and Managing Director; on Misti Ushio, a Vice President; and on Sandra M. Forman, our General Counsel, Chief Compliance Officer, Director of Human Resources and Corporate Secretary. The departure of any of our executive officers, key employees or advisers could materially adversely affect our ability to implement our business strategy. We do not maintain for our benefit any key-man life insurance on any of our officers or employees.
Our failure to make follow-on investments in our portfolio companies could impair the value of our portfolio.
Following an initial investment in a portfolio company, we may make additional investments in that portfolio company as "follow-on" investments, in order to: (1) increase or maintain in whole or in part our ownership percentage; (2) exercise warrants, options or convertible securities that were acquired in the original or subsequent financing; or (3) attempt to preserve or enhance the value of our investment.
We may elect not to make follow-on investments or lack sufficient funds to make such investments. We have the discretion to make any follow-on investments, subject to the availability of capital resources. The failure to make a follow-on investment may, in some circumstances, jeopardize the continued viability of a portfolio company and our initial investment, or may result in a missed opportunity for us to increase our participation in a successful operation, or may cause us to lose some or all preferred rights pursuant to "pay-to-play" provisions that have become common in venture capital transactions. These provisions require proportionate investment in subsequent rounds of financing in order to preserve preferred rights such as anti-dilution protection, liquidation preferences and preemptive rights to invest
in future rounds of financing. Even if we have sufficient capital to make a desired follow-on investment, we may elect not to make a follow-on investment because we may not want to increase our concentration of risk, because we prefer other opportunities or because we are inhibited by compliance with BDC requirements or the desire to maintain our tax status.
Bank borrowing or the issuance of debt securities or preferred stock by us, to fund investments in portfolio companies or to fund our operating expenses, would make our total return to common shareholders more volatile.
Use of debt or preferred stock as a source of capital entails two primary risks. The first is the risk of leverage, which is the use of debt to increase the pool of capital available for investment purposes. The use of debt leverages our available common equity capital, magnifying the impact on net asset value of changes in the value of our investment portfolio. For example, a BDC that uses 33 percent leverage (that is, $50 of leverage per $100 of common equity) will show a 1.5 percent increase or decline in net asset value for each one percent increase or decline in the value of its total assets. The second risk is that the cost of debt or preferred stock financing may exceed the return on the assets the proceeds are used to acquire, thereby diminishing rather than enhancing the return to common shareholders.
If we issue preferred shares or debt, the common shareholders would bear the cost of this leverage. To the extent that we utilize debt or preferred stock financing for any purpose, these two risks would likely make our total return to common shareholders more volatile. In addition, we might be required to sell investments, in order to meet dividend, interest or principal payments, when it might be disadvantageous for us to do so.
As provided in the 1940 Act and subject to some exceptions, we can issue debt or preferred stock so long as our total assets immediately after the issuance, less some ordinary course liabilities, exceed 200 percent of the sum of the debt and any preferred stock outstanding. The debt or preferred stock may be convertible in accordance with SEC guidelines, which might permit us to obtain leverage at more attractive rates. The requirement under the 1940 Act to pay, in full, dividends on preferred shares or interest on debt before any dividends may be paid on our common stock means that dividends on our common stock from earnings may be reduced or eliminated. An inability to pay dividends on our common stock could conceivably result in our ceasing to qualify as a RIC under the Code, which would in most circumstances
be materially adverse to the holders of our common stock. As of December 31, 2010, we did not have any debt or preferred stock outstanding. As of February 24, 2011, we established a $10 million three-year revolving credit facility with TD Bank, N.A., to be used in conjunction with our investments in venture debt. We do not plan to use this credit facility in conjunction with any private venture capital equity investments.
We are authorized to issue preferred stock, which would convey special rights and privileges to its owners senior to those of common stock shareholders.
We are currently authorized to issue up to 2,000,000 shares of preferred stock, under terms and conditions determined by our Board of Directors. These shares would have a preference over our common stock with respect to dividends and liquidation. The statutory class voting rights of any preferred shares we would issue could make it more difficult for us to take some actions that might, in the future, be proposed by the Board and/or holders of common stock, such as a merger, exchange of securities, liquidation or alteration of the rights of a class of our securities, if these actions were perceived by the holders of the preferred shares as not in their best interests. The issuance of preferred shares convertible into shares of common stock might also reduce the net
income and net asset value per share of our common stock upon conversion.
Loss of status as a RIC could reduce our net asset value and distributable income.
We have elected to qualify, qualified and intend to continue to qualify as a RIC under the Code. As a RIC, we do not have to pay federal income taxes on our income (including realized gains) that is distributed to our shareholders. Accordingly, we are not permitted under accounting rules to establish reserves for taxes on our unrealized capital gains. If we failed to qualify for RIC status in 2010 or beyond, we would be taxed in the same manner as an ordinary corporation and distributions to our shareholders would not be deductible in computing our taxable income, which would materially adversely impact the amount of cash available for distribution to our shareholders. In addition, to the extent that we had unrealized gains, we would have to establish reserves for taxes, which would reduce our net asset value,
accordingly. To qualify again to be taxed as a RIC in a subsequent year, we would be required to distribute to our shareholders our earnings and profits attributable to non-RIC years reduced by an interest charge of 50 percent of such earnings and profits payable by us to the IRS. In addition, if we failed to qualify as a RIC for a period greater than two taxable years, then, in order to qualify as a RIC in a subsequent year, we would be required to elect to recognize and pay tax on any net built-in gain (the excess of aggregate gain, including items of income, over aggregate loss that would have been realized if we had sold our property to an unrelated party for fair market value) or, alternatively, be subject to taxation on such built-in gain recognized for a period of 10 years. In addition, if we, as a RIC, were to decide to make a deemed distribution of realized net capital gains and retain the net realized capital gains, also referred to as a deemed dividend, we would have to
establish appropriate reserves for taxes that we would have to pay on behalf of shareholders. It is possible that establishing reserves for taxes could have a material adverse effect on the value of our common stock. Additionally, if we decide to make a deemed distribution and government regulation increases dividend tax rates for individuals and corporations, the net benefit to shareholders could be adversely affected. Such changes may decrease the value to shareholders that could be generated through our status as a RIC.
We operate in a heavily regulated environment, and changes to, or non-compliance with, regulations and laws could harm our business.
We are subject to substantive SEC regulations as a BDC. Securities and tax laws and regulations governing our activities may change in ways adverse to our and our shareholders’ interests, and interpretations of these laws and regulations may change with unpredictable consequences. Any change in the laws or regulations that govern our business could have an adverse impact on us or on our operations. Changing laws, regulations and standards relating to corporate governance, valuation, public disclosure and market regulation, including the Sarbanes-Oxley Act of 2002, new SEC regulations, new federal accounting standards and Nasdaq Stock Market rules, create additional expense and uncertainty for publicly held companies in general, and for BDCs in particular.
These new or changed laws, regulations and standards are subject to varying interpretations in many cases because of their lack of specificity, and as a result, their application in practice may evolve over time, which may well result in continuing uncertainty regarding compliance matters and higher costs necessitated by ongoing revisions to disclosure and governance practices.
We are committed to maintaining high standards of corporate governance and public disclosure. As a result, our efforts to comply with evolving laws, regulations and standards have and will continue to result in increased general and administrative expenses and a diversion of management time and attention from revenue-generating activities to compliance activities. In particular, our efforts to comply with Section 404 of the Sarbanes-Oxley Act of 2002 and the related regulations regarding our required assessment of our internal controls over financial reporting has required the commitment of significant financial and managerial resources. If our efforts to comply with new or changed laws, regulations and standards differ from the activities intended by regulatory or
governing bodies, our reputation may be harmed. This increased regulatory burden is causing us to incur significant additional expenses and is time consuming for our management, which could have a material adverse effect on our financial performance.
Market prices of our common stock will continue to be volatile.
We expect that the market price of our common stock price will continue to be volatile. The price of the common stock may be higher or lower than the price you pay for your shares, depending on many factors, some of which are beyond our control and may not be directly related to our operating performance. These factors include the following:
|
|
•
|
stock market and capital markets conditions;
|
|
|
•
|
internal developments in our Company with respect to our personnel, financial condition and compliance with all applicable regulations;
|
|
|
•
|
announcements regarding any of our portfolio companies;
|
|
|
•
|
announcements regarding developments in the nanotechnology or cleantech-related fields in general;
|
|
|
•
|
environmental and health concerns regarding nanotechnology, whether real or perceptual;
|
|
|
•
|
announcements regarding government funding and initiatives related to the development of nanotechnology or cleantech-related products;
|
|
|
•
|
general economic conditions and trends; and/or
|
|
|
•
|
departures of key personnel.
|
We will not have control over many of these factors, but expect that our stock price may be influenced by them. As a result, our stock price may be volatile, and you may lose all or part of your investment.
Quarterly results fluctuate and are not indicative of future quarterly performance.
Our quarterly operating results fluctuate as a result of a number of factors. These factors include, among others, variations in and the timing of the recognition of realized and unrealized gains or losses, the degree to which we and our portfolio companies encounter competition in our markets and general economic and capital markets conditions. As a result of these factors, results for any one quarter should not be relied upon as being indicative of performance in future quarters.
To the extent that we do not realize income or choose not to retain after-tax realized capital gains, we will have a greater need for additional capital to fund our investments and operating expenses.
As a RIC, we must annually distribute at least 90 percent of our investment company taxable income as a dividend and may either distribute or retain our realized net capital gains from investments. As a result, these earnings may not be available to fund investments. If we fail to generate net realized capital gains or to obtain funds from outside sources, it would have a material adverse effect on our financial condition and results of operations as well as our ability to make follow-on and new investments. Because of the structure and objectives of our business, we generally expect to experience net operating losses and rely on proceeds from sales of investments and investment income from our venture debt to defray a significant portion of our operating expenses. Investment sales are unpredictable and may not
occur. In addition, as a BDC, we are generally required to maintain a ratio of at least 200 percent of total assets to total borrowings and preferred stock, which may restrict our ability to borrow to fund these requirements. Lack of capital could curtail our investment activities or impair our working capital.
Investment in foreign securities could result in additional risks.
We may invest in foreign securities, and we currently have one investment in a foreign security. When we invest in securities of foreign issuers, we may be subject to risks not usually associated with owning securities of U.S. issuers. These risks can include fluctuations in foreign currencies, foreign currency exchange controls, social, political and economic instability, differences in securities regulation and trading, expropriation or nationalization of assets and foreign taxation issues. In addition, changes in government administrations or economic or monetary policies in the United States or abroad could result in appreciation or depreciation of our securities and could favorably or unfavorably affect our operations. It may also be more difficult to obtain and enforce a judgment against a foreign issuer.
Any foreign investments made by us must be made in compliance with U.S. and foreign currency restrictions and tax laws restricting the amounts and types of foreign investments.
Although most of our investments are denominated in U.S. dollars, our investments that are denominated in a foreign currency are subject to the risk that the value of a particular currency may change in relation to the U.S. dollar, in which currency we maintain financial statements and valuations. Among the factors that may affect currency values are trade balances, the level of short-term interest rates, differences in relative values of similar assets in different currencies, long-term opportunities for investment and capital appreciation and political developments.
Investing in our stock is highly speculative and an investor could lose some or all of the amount invested.
Our investment objective and strategies result in a high degree of risk in our investments and may result in losses in the value of our investment portfolio. Our investments in portfolio companies are highly speculative and, therefore, an investor in our common stock may lose his or her entire investment. The value of our common stock may decline and may be affected by numerous market conditions, which could result in the loss of some or all of the amount invested in our common stock. The securities markets frequently experience extreme price and volume fluctuations that affect market prices for securities of companies in general, and technology and very small capitalization companies in particular. Because of our focus on the technology and very small capitalization sectors, and because we are a very small
capitalization company ourselves, our stock price is especially likely to be affected by these market conditions. General economic conditions, and general conditions in nanotechnology and in the semiconductor and information technology, life science, materials science and other high-technology industries, including cleantech, may also affect the price of our common stock.
Our shares might trade at discounts from net asset value or at premiums that are unsustainable over the long term.
Shares of BDCs like us may, during some periods, trade at prices higher than their net asset value and during other periods, as frequently occurs with closed-end investment companies, trade at prices lower than their net asset value. The possibility that our shares will trade at discounts from net asset value or at premiums that are unsustainable over the long term are risks separate and distinct from the risk that our net asset value per share will decrease. The risk of purchasing shares of a BDC that might trade at a discount or unsustainable premium is more pronounced for investors who wish to sell their shares in a relatively short period of time because, for those investors, realization of a gain or loss on their investments is likely to be more dependent upon changes in premium or discount levels than upon
increases or decreases in net asset value per share. Our common stock may not trade at a price higher than or equal to net asset value per share. On December 31, 2010, our stock closed at $4.38 per share, a discount of $0.38 to our net asset value per share of $4.76 as of December 31, 2010.
The Board of Directors intends to grant stock options to our employees pursuant to the Company's Equity Incentive Plan. When exercised, these options may have a dilutive effect on existing shareholders.
In accordance with the Company’s Equity Incentive Plan, the Company’s Board of Directors may grant options from time to time for up to 20 percent of the total shares of stock issued and outstanding. When options are exercised, net asset value per share will decrease if the net asset value per share at the time of exercise is higher than the exercise price. Alternatively, net asset value per share will increase if the net asset value per share at the time of exercise is lower than the exercise price. Therefore, existing shareholders will be diluted if the net asset value per share at the time of exercise is higher than the exercise price of the options. Even though issuance of shares pursuant to exercises of options increases the Company's capital, and regardless of whether such issuance results in
increases or decreases in net asset value per share, such issuance results in existing shareholders owning a smaller percentage of the shares outstanding.
You have no right to require us to repurchase your shares.
You do not have the right to require us to repurchase your shares of common stock.
The market price of our shares of common stock may be adversely affected by the sale of shares by our management or large shareholders.
Sales of our shares of common stock by our officers through 10b5-1 plans or by large shareholders could adversely and unpredictably affect the price of those securities. Additionally, the price of our shares of common stock could be affected even by the potential for sales by these persons. We cannot predict the effect that any future sales of our common stock, or the potential for those sales, will have on our share price. Furthermore, due to relatively low trading volume of our stock, should one or more large stockholders seek to sell a significant portion of its stock in a short period of time, the price of our stock may decline.
Future sales of our common stock in the public market could cause our stock price to fall.
Sales of a substantial number of shares of our common stock in offerings, such as follow-on public offerings, registered direct or PIPE transactions, or rights offerings, or the perception that these sales might occur, could depress the market price of our common stock and could impair our ability to raise capital through the sale of additional equity securities.
|
Item 1B.
|
Unresolved Staff Comments.
|
None.
The Company maintains its offices at 1450 Broadway, New York, New York 10018, where it leases approximately 6,900 square feet of office space pursuant to a lease agreement expiring on December 31, 2019. (See "Note 9. Commitments and Contingencies" contained in "Item 8. Consolidated Financial Statements and Supplementary Data.")
On July 1, 2008, we signed a five-year lease for approximately 2,290 square feet of office space at 420 Florence Street, Suite 200, Palo Alto, California 94301, commencing on August 1, 2008, and expiring on August 31, 2013.
|
Item 3.
|
Legal Proceedings.
|
The Company is not a party to any legal proceedings.
|
Item 4.
|
Removed and Reserved.
|
PART II
|
Item 5.
|
Market for Registrant's Common Equity, Related StockholderMatters and Issuer Purchases of Equity Securities.
|
Market Information
Our common stock is traded on the Nasdaq Global Market under the symbol "TINY." The following table sets forth the range of the high and low sales price of the Company's shares during each quarter of the last two fiscal years, as reported by Nasdaq Global Market. The quarterly stock prices quoted represent interdealer quotations and do not include markups, markdowns or commissions.
|
2010 Quarter Ending
|
|
Low
|
|
|
High
|
|
| |
|
|
|
|
|
|
|
March 31
|
|
$ |
3.93 |
|
|
$ |
5.33 |
|
|
June 30
|
|
$ |
4.06 |
|
|
$ |
5.50 |
|
|
September 30
|
|
$ |
3.70 |
|
|
$ |
4.40 |
|
|
December 31
|
|
$ |
4.12 |
|
|
$ |
4.73 |
|
| |
|
|
|
|
|
|
|
|
|
2009 Quarter Ending
|
|
Low
|
|
|
High
|
|
| |
|
|
|
|
|
|
|
|
|
March 31
|
|
$ |
2.65 |
|
|
$ |
4.48 |
|
|
June 30
|
|
$ |
3.57 |
|
|
$ |
5.99 |
|
|
September 30
|
|
$ |
5.01 |
|
|
$ |
6.93 |
|
|
December 31
|
|
$ |
4.04 |
|
|
$ |
6.31 |
|
Shareholders
As of March 8, 2011, there were approximately 131 holders of record and approximately 18,443 beneficial owners of the Company's common stock.
Dividends
We did not pay a cash dividend or declare a deemed dividend for 2010 or 2009. For more information about deemed dividends, please refer to the discussion under "Subchapter M Status."
Securities Authorized for Issuance Under Equity Compensation Plans
EQUITY COMPENSATION PLAN INFORMATION
As of December 31, 2010
| |
|
Number of securities
to be issued upon
exercise of out-
standing options,
warrants and rights
|
|
|
Weighted-average
exercise price of
outstanding options,
warrants and rights
|
|
|
Number of securities
remaining available for
future issuance under
equity compensation
plans (excluding
securities reflected in
Column (a))
|
| |
|
|
|
|
|
|
|
|
|
Plan Category
|
|
(a)
|
|
|
(b)
|
|
|
(c)
|
| |
|
|
|
|
|
|
|
|
|
Equity compensation plans approved by security holders
|
|
|
3,860,748 |
|
|
$7.81 |
|
|
(1) |
| |
|
|
|
|
|
|
|
|
|
|
Equity compensation plans not approved by security holders
|
|
|
- |
|
|
- |
|
|
- |
| |
|
|
|
|
|
|
|
|
|
|
TOTAL
|
|
|
3,860,748 |
|
|
$7.81 |
|
|
(1) |
(1) A maximum of twenty percent (20%) of our total shares of our common stock issued and outstanding may be available for awards under the plan, subject to adjustment as described below. Shares issued under the plan may be authorized but unissued shares or treasury shares. If any shares subject to an award granted under the plan are forfeited, cancelled, exchanged or surrendered, or if an award terminates or expires without a distribution of shares, those shares will again be available for awards under the plan.
Recent Sales of Unregistered Securities
The Company did not sell any equity securities during 2010 that were not registered under the Securities Act of 1933.
Performance Graph
The graph below compares the cumulative five-year total return of holders of the Company's common stock with the cumulative total returns of the Nasdaq Composite index and the Nasdaq Financial index. The graph assumes that the value of the investment in the Company's common stock and in each of the indexes (including reinvestment of dividends) was $100 on December 31, 2005, and tracks it through December 31, 2010.
| |
|
|
12/05 |
|
|
|
12/06 |
|
|
|
12/07 |
|
|
|
12/08 |
|
|
|
12/09 |
|
|
|
12/10 |
|
| |
|
|
|
|
|
|
|
|
|
|
|
|
|
|
|
|
|
|
|
|
|
|
|
|
|
Harris & Harris Group, Inc.
|
|
|
100.00 |
|
|
|
86.98 |
|
|
|
63.24 |
|
|
|
28.42 |
|
|
|
32.88 |
|
|
|
31.51 |
|
|
NASDAQ Composite
|
|
|
100.00 |
|
|
|
111.74 |
|
|
|
124.67 |
|
|
|
73.77 |
|
|
|
107.12 |
|
|
|
125.93 |
|
|
NASDAQ Financial
|
|
|
100.00 |
|
|
|
114.27 |
|
|
|
103.45 |
|
|
|
71.01 |
|
|
|
74.79 |
|
|
|
85.39 |
|
The stock price performance included in this graph is not necessarily indicative of future stock price performance.
Source: Research Data Group, Inc.
Stock Transfer Agent
American Stock Transfer & Trust Company, 59 Maiden Lane, New York, New York 10038 (Telephone 800-937-5449, Attention: Ms. Jennifer Donovan) serves as our transfer agent. Certificates to be transferred should be mailed directly to the transfer agent, preferably by registered mail.
|
Item 6.
|
Selected Financial Data.
|
The information below was derived from the audited Consolidated Financial Statements included in this report and in previous annual reports filed with the SEC. This information should be read in conjunction with those Consolidated Financial Statements and Supplementary Data and the notes thereto. These historical results are not necessarily indicative of the results to be expected in the future.
Financial Position as of December 31:
| |
|
2010
|
|
|
2009
|
|
|
2008
|
|
|
2007
|
|
|
2006
|
|
| |
|
|
|
|
|
|
|
|
|
|
|
|
|
|
|
|
Total assets
|
|
$ |
149,289,168 |
|
|
$ |
136,109,101 |
|
|
$ |
111,627,601 |
|
|
$ |
142,893,332 |
|
|
$ |
118,328,590 |
|
| |
|
|
|
|
|
|
|
|
|
|
|
|
|
|
|
|
|
|
|
|
|
Total liabilities
|
|
$ |
2,435,256 |
|
|
$ |
1,950,843 |
|
|
$ |
2,096,488 |
|
|
$ |
4,529,988 |
|
|
$ |
4,398,287 |
|
| |
|
|
|
|
|
|
|
|
|
|
|
|
|
|
|
|
|
|
|
|
|
Net assets1
|
|
$ |
146,853,912 |
|
|
$ |
134,158,258 |
|
|
$ |
109,531,113 |
|
|
$ |
138,363,344 |
|
|
$ |
113,930,303 |
|
| |
|
|
|
|
|
|
|
|
|
|
|
|
|
|
|
|
|
|
|
|
|
Net asset value per outstanding share
|
|
$ |
4.76 |
|
|
$ |
4.35 |
|
|
$ |
4.24 |
|
|
$ |
5.93 |
|
|
$ |
5.42 |
|
| |
|
|
|
|
|
|
|
|
|
|
|
|
|
|
|
|
|
|
|
|
|
Cash dividends paid
|
|
$ |
0.00 |
|
|
$ |
0.00 |
|
|
$ |
0.00 |
|
|
$ |
0.00 |
|
|
$ |
0.00 |
|
| |
|
|
|
|
|
|
|
|
|
|
|
|
|
|
|
|
|
|
|
|
|
Cash dividends paid per outstanding share
|
|
$ |
0.00 |
|
|
$ |
0.00 |
|
|
$ |
0.00 |
|
|
$ |
0.00 |
|
|
$ |
0.00 |
|
| |
|
|
|
|
|
|
|
|
|
|
|
|
|
|
|
|
|
|
|
|
|
Shares outstanding, end of year1
|
|
|
30,878,164 |
|
|
|
30,859,593 |
|
|
|
25,859,573 |
|
|
|
23,314,573 |
|
|
|
21,015,017 |
|
Operating Data for Year Ended December 31:
| |
|
2010
|
|
|
2009
|
|
|
2008
|
|
|
2007
|
|
|
2006
|
|
| |
|
|
|
|
|
|
|
|
|
|
|
|
|
|
|
|
Total investment income
|
|
$ |
446,038 |
|
|
$ |
247,848 |
|
|
$ |
1,987,347 |
|
|
$ |
2,705,636 |
|
|
$ |
3,028,761 |
|
| |
|
|
|
|
|
|
|
|
|
|
|
|
|
|
|
|
|
|
|
|
|
Total expenses2
|
|
$ |
8,001,845 |
|
|
$ |
9,009,063 |
|
|
$ |
12,674,498 |
|
|
$ |
14,533,179 |
|
|
$ |
10,641,696 |
|
| |
|
|
|
|
|
|
|
|
|
|
|
|
|
|
|
|
|
|
|
|
|
Net operating loss
|
|
$ |
(7,555,807 |
) |
|
$ |
(8,761,215 |
) |
|
$ |
(10,687,151 |
) |
|
$ |
(11,827,543 |
) |
|
$ |
(7,612,935 |
) |
| |
|
|
|
|
|
|
|
|
|
|
|
|
|
|
|
|
|
|
|
|
|
Total tax expense (benefit)
|
|
$ |
4,461 |
|
|
$ |
(753 |
) |
|
$ |
34,121 |
|
|
$ |
87,975 |
|
|
$ |
(227,355 |
) |
| |
|
|
|
|
|
|
|
|
|
|
|
|
|
|
|
|
|
|
|
|
Net realized (loss) income from investments
|
|
$ |
(3,740,518 |
) |
|
$ |
(11,105,577 |
) |
|
$ |
(8,323,634 |
) |
|
$ |
30,162 |
|
|
$ |
258,693 |
|
| |
|
|
|
|
|
|
|
|
|
|
|
|
|
|
|
|
|
|
|
|
|
Net decrease (increase) in unrealized depreciation on investments
|
|
$ |
21,883,175 |
|
|
$ |
19,718,327 |
|
|
$ |
(30,170,712 |
) |
|
$ |
5,080,936 |
|
|
$ |
(4,418,870 |
) |
| |
|
|
|
|
|
|
|
|
|
|
|
|
|
|
|
|
|
|
|
|
Net increase (decrease) in net assets resulting from operations
|
|
$ |
10,586,850 |
|
|
$ |
(148,465 |
) |
|
$ |
(49,181,497 |
) |
|
$ |
(6,716,445 |
) |
|
$ |
(11,773,112 |
) |
| |
|
|
|
|
|
|
|
|
|
|
|
|
|
|
|
|
|
|
|
|
|
Increase (decrease) in net assets resulting from operations per average outstanding share
|
|
$ |
0.34 |
|
|
$ |
(0.01 |
) |
|
$ |
(1.99 |
) |
|
$ |
(0.30 |
) |
|
$ |
(0.57 |
) |
1 We completed offerings of our common stock as follows: 0 shares in 2010; 4,887,500 shares in 2009; 2,545,000 shares in 2008; 1,300,000 shares in 2007; and 0 shares in 2006.
2 Included in total expenses is non-cash, stock-based, compensation expense of $2,088,091 in 2010; $3,089,520 in 2009; $5,965,769 in 2008; $8,050,807 in 2007; and $5,038,956 in 2006. Also included in total expenses are the following profit-sharing expenses: $0 in each of 2010, 2009, 2008 and 2007; and $50,875 in 2006.
|
Item 7.
|
Management's Discussion and Analysis of Financial Condition and Results of Operations.
|
The information contained in this section should be read in conjunction with the Company's 2010 Consolidated Financial Statements and notes thereto.
Forward-Looking Statements
The information contained herein may contain "forward-looking statements" based on our current expectations, assumptions and estimates about us and our industry. These forward-looking statements involve risks and uncertainties. Words such as "believe," "anticipate," "estimate," "expect," "intend," "plan," "will," "may," "might," "could," "continue" and other similar expressions identify forward-looking statements. In addition, any statements that refer to expectations, projections or other characterizations of future events or circumstances are forward-looking statements. Our actual results could differ materially from those anticipated in the forward-looking statements as a result of several factors more fully described in "Risk Factors" and elsewhere in this Form 10-K. The forward-looking statements made
in this Form 10-K relate only to events as of the date on which the statements are made. We undertake no obligation to update publicly any forward-looking statements for any reason, even if new information becomes available or other events occur in the future.
Background and Overview
We incorporated under the laws of the state of New York in August 1981. In 1983, we completed an IPO. In 1984, we divested all of our assets except Otisville BioTech, Inc., and became a financial services company with the investment in Otisville as the initial focus of our business activity.
In 1992, we registered as an investment company under the 1940 Act, commencing operations as a closed-end, non-diversified investment company. In 1995, we elected to become a BDC subject to the provisions of Sections 55 through 65 of the 1940 Act.
We are a venture capital company that specializes in making investments in companies commercializing and integrating products enabled by nanotechnology and microsystems. We define venture capital investments as the money and resources made available to privately held start-up firms and privately held and publicly traded small businesses with exceptional growth potential. Nanotechnology is the study of structures measured in nanometers, which are units of measurement in billionths of a meter. Microsystems are measured in micrometers, which are units of measurement in millionths of a meter. We sometimes use "tiny technology" to describe both of these disciplines.
We consider a company to fit our investment thesis if the company employs or intends to employ technology that we consider to be at the microscale or smaller and if the employment of that technology is material to its business plan. By making these investments, we seek to provide our shareholders with a specific focus on nanotechnology and microsystems through a portfolio of venture capital investments that address a variety of markets and products.
As of December 31, 2010, $105,679,002, or 71 percent, of our total assets at fair value consisted of private venture capital investments in equity or equity-related securities, including unrealized appreciation of $7,514,868. As of December 31, 2010, $471,420, or 0.3 percent, of our total assets at fair value consisted of private venture capital investments in non-convertible debt securities, net of unrealized depreciation of $11,830. As of December 31, 2010, $0 of our total assets consisted of publicly traded venture capital investments. As of December 31, 2009, $77,797,086, or 57 percent, of our total assets at fair value consisted of private venture capital investments, net of unrealized depreciation of $14,293,994. As of December 31, 2009, $0 of our total assets consisted of non-convertible debt securities.
As of December 31, 2009, $226,395, or less than one percent, of our total assets at market value consisted of publicly traded venture capital investments, net of unrealized depreciation of $72,432.
We believe that we are the only publicly traded BDC making venture capital investments exclusively in nanotechnology and microsystems. We believe we provide five core benefits to our shareholders. First, we are an established firm with a track record of investing in venture capital-backed companies. Second, we provide shareholders with access to emerging companies that commercialize and integrate products enabled by nanotechnology and microsystems that are privately and publicly owned. Third, we have an existing portfolio of companies that we believe are comparable in stage to those found in the latter years of a private venture capital fund. Fourth, we are able to invest opportunistically in a range of types of securities to take advantage of market inefficiencies. Many venture capital firms structured as
private partnerships are restricted to certain types of assets. We believe our recent efforts to invest in venture debt securities fit this description. Fifth, we provide access to venture capital investments in a vehicle that, unlike private venture capital firms, is both transparent and liquid.
Investment Strategy
We have discretion in the investment of our capital. Throughout our corporate history, we have made primarily early-stage venture capital investments in a variety of industries. These businesses can range in stage from pre-revenue to generating positive cash flow. These businesses tend to be thinly capitalized, unproven, small companies that lack management depth, have little or no history of operations and are developing unproven technologies. These businesses may be privately held or publicly traded. We historically have invested in equity securities of these companies that are generally illiquid due to restrictions on resale and to the lack of an established trading market. Our investments in equity and convertible debt securities are made using our cash reserves, currently invested in U.S. Treasury
obligations. We do not use leverage or debt to supplement our cash in investments in equity and convertible debt securities. We refer to our portfolio of investments in equity and equity-related securities in later sections of the Management's Discussion and Analysis of Financial Condition and Results of Operations as our "equity-focused" portfolio of investments.
Additionally, we provide non-convertible debt financing to privately held or publicly traded companies that are generating cash or have near-term visibility to reaching positive cash flow. Credit remains extremely expensive or unavailable for even the strongest small privately held and publicly traded companies. In addition to fees and monthly principal and interest payments, we may receive warrants in these investments. Providing non-convertible debt enables us to generate near-term cash flow with a defined period for return on our investment. We may use leverage or debt to help fund our investments in non-convertible debt securities as these investments have defined periods of time for return on investment. We refer to our portfolio of investments in non-convertible debt in later sections of the Management's
Discussion and Analysis of Financial Condition and Results of Operations as our "venture debt" portfolio of investments.
Historical Investments
Since our investment in Otisville in 1983 through December 31, 2010, we have made a total of 90 venture capital investments. We have exited 58 of these 90 investments, realizing total gross proceeds of $144,325,044 on our cumulative invested capital of $75,537,972.
In 1994, we invested in our first nanotechnology company, Nanophase Technologies Corporation. Recognizing the potential of nanotechnology, we continued to monitor developments in the field. From August 2001 through December 31, 2010, all 48 of our initial investments have been in companies commercializing or integrating products enabled by nanotechnology or microsystems. From August 2001 through December 31, 2010, we have invested a total (before any subsequent write-ups, write-downs or dispositions) of $126,809,483 in these companies. We currently have 32 companies in our portfolio, including one investment made prior to 2001. At December 31, 2010, from first dollar in, the average and median holding periods for these 32 investments were 4.9 years and 4.7 years, respectively. Historically, as measured from
first dollar in to last dollar out, the average and median holding periods for the 58 investments we have exited were 3.9 years and 3.3 years, respectively.
In the first quarter of 2011, we had liquidity events in two of our portfolio companies. BioVex Group, Inc., was purchased by Amgen, Inc., on March 4, 2011, after approximately 3.4 years in our portfolio. NeoPhotonics Corporation completed an IPO on February 2, 2011, after approximately 7.2 years in our portfolio.
Investment Pace
We invested $489,999 in nanotechnology and microsystems in 2001. We invested $10,060,721 in nanotechnology and microsystems in 2010. The following is a summary of our annual initial and follow-on investments in nanotechnology from January 1, 2006, to December 31, 2010. We consider a "round led" to be a round where we were the sole institutional investor or the leader of a set of investors in an investee company. Typically, but not always, the lead investor negotiates the price and terms of a deal with the investee company.
| |
|
2006
|
|
|
2007
|
|
|
2008
|
|
|
2009
|
|
|
2010
|
|
| |
|
|
|
|
|
|
|
|
|
|
|
|
|
|
|
|
Total Incremental Investments
|
|
$24,408,187 |
|
|
$20,595,161 |
|
|
$17,779,462 |
|
|
$12,334,051 |
|
|
$10,060,721 |
|
|
Investments in Our Equity-Focused Portfolio of Investments
in Privately Held and Publicly Traded Companies
|
|
| |
|
|
|
|
|
|
|
|
|
|
|
|
|
|
|
|
No. of New Investments
|
|
6 |
|
|
7 |
|
|
4 |
|
|
2 |
|
|
3 |
|
| |
|
|
|
|
|
|
|
|
|
|
|
|
|
|
|
|
No. of Follow-On Investment Rounds
|
|
14 |
|
|
20 |
|
|
25 |
|
|
29 |
|
|
27 |
|
| |
|
|
|
|
|
|
|
|
|
|
|
|
|
|
|
|
No. of Rounds Led
|
|
7 |
|
|
3 |
|
|
4 |
|
|
5 |
|
|
5 |
|
| |
|
|
|
|
|
|
|
|
|
|
|
|
|
|
|
|
Average Dollar Amount – Initial
|
|
$2,383,424 |
|
|
$1,086,441 |
|
|
$683,625 |
|
|
$174,812 |
|
|
$117,069 |
|
| |
|
|
|
|
|
|
|
|
|
|
|
|
|
|
|
|
Average Dollar Amount – Follow-On
|
|
$721,974 |
|
|
$649,504 |
|
|
$601,799 |
|
|
$413,256 |
|
|
$341,093 |
|
| |
|
|
Investments in Our Venture Debt Portfolio of Investments
In Privately Held and Publicly Traded Companies
|
|
| |
|
|
|
|
|
|
|
|
|
|
|
|
|
|
|
|
No. of New Investments
|
|
0 |
|
|
0 |
|
|
0 |
|
|
0 |
|
|
1 |
|
| |
|
|
|
|
|
|
|
|
|
|
|
|
|
|
|
|
Average Dollar Amount
|
|
$0 |
|
|
$0 |
|
|
$0 |
|
|
$0 |
|
|
$500,000 |
|
(1) At December 31, 2010, we had no equity investments in publicly traded companies.
Importance of Availability of Liquid Capital
Private venture capital funds are structured commonly as limited partnerships with a committed level of capital and finite lifetime. Capital is "called" from limited partners to make investments and pay for expenses of running the firm at various points within the lifetime of the fund. For each initial investment, the fund must reserve additional capital for follow-on investments at later stages of the life of the portfolio companies. These follow-on investments are required because often venture-backed portfolio companies in areas in which we invest, whether privately held or publicly traded, operate with negative cash flow for lengthy periods of time. In general, the cumulative total of initial invested capital and reserves cannot exceed the committed level of capital of the fund.
Our strategy for investing capital is similar to this approach in some respects. We make initial investments in privately held and publicly traded companies and project the amount of capital that may be required should the company mature successfully. These projections, equivalent to the reserves of private venture capital funds, are reviewed weekly by management, are updated frequently and are a component of the data that guide our decisions on whether to make new and follow-on investments. As a publicly traded, internally managed venture capital company, our cash used to make investments and pay expenses is held by us and not called from external sources when needed. Accordingly, it is crucial that we operate the company with a substantial balance of liquid capital for this reason and for four additional
reasons.
|
|
1)
|
We manage the company and our investment criteria and pace such that our projected needs for capital to make new and follow-on investments do not exceed the total of our liquid investments. Although we use best efforts to predict when this capital will be required for use in new and follow-on investments, we cannot predict with certainty the timing for these investments. We would be unable to make new or follow-on investments in our portfolio companies without having substantial liquid resources of capital available to us.
|
|
|
2)
|
Venture capital firms traditionally invest beside other venture capital firms in a process called syndication. The size of the fund and the amount of capital reserves available to syndicate partners is often an attribute that potential co-investors consider when deciding on syndicate partners. As we do not have committed capital from limited partners, we believe we must have adequate available liquid capital on our balance sheet to be able to have access to high-quality deal flow.
|
|
|
3)
|
We rarely commit the total amount of cumulative capital intended for investment in any portfolio company at one point in time. Instead, our investments consist of multiple rounds of financing of a given portfolio company, in which we typically participate if we believe that the merits of such an investment outweigh the risks. We also commonly have preemptive rights to invest additional capital in our privately held portfolio companies. These rights are useful to protect and potentially increase the value of our positions in our portfolio companies as they mature. Commonly, the terms of such financings in privately held companies also include penalties for those investors that do not invest in these subsequent rounds of financing. Without available capital at the time of investment, our ownership in the company would be subject to these penalties that can lead to a partial or complete loss
of the capital invested prior to that round of financing.
|
|
|
4)
|
We may have the opportunity to increase ownership in late rounds of financing in some of our most mature companies. Many private venture capital funds that invested in these companies are reaching the end of the term associated with their limited partnerships. This issue may limit the available capital to these funds for follow-on investments, and the ability to take advantage of potentially valuable terms given to those who have investable capital. Having permanent, liquid capital available for investment and access to the capital markets allows us to take advantage of these opportunities as they arise.
|
Involvement with Portfolio Companies
The 1940 Act requires that BDCs offer to "make available significant managerial assistance" to portfolio companies. We are actively involved with our portfolio companies through membership on boards of directors, as observers to the boards of directors and/or through frequent communication with management. As of December 31, 2010, we held at least a board seat or observer rights as part of our investments in 26 of our 32 portfolio companies (81 percent).
We may hold two or more board seats in early-stage portfolio companies or those in which we have significant ownership. As of December 31, 2010, we held two board seats in Ancora Pharmaceuticals Inc. and Enumeral Biomedical Corp. We may transition off of the board of directors to an observer role as our portfolio companies raise additional capital from new investors, as they mature or as they are able to attract independent members who have relevant industry experience and contacts. We also typically step off the board of directors upon the completion of an IPO.
We may be actively involved in the formation and development of business strategies of our earliest stage portfolio companies. This involvement may include hiring management, licensing intellectual property, securing space and raising additional capital. We also provide managerial assistance to late-stage companies looking for potential exit opportunities by leveraging our status as a publicly traded company through our relationships with the banking community and our knowledge and experience implementing and complying with Section 404 of the Sarbanes-Oxley Act for larger companies.
Commercialization of Nanotechnology by Our Portfolio Companies
Nanotechnology is a general-purpose technology. An innovation qualifies as a general purpose technology if it has the potential for pervasive use across a wide range of sectors in a way that fundamentally alters the modes of operations within those sectors. Nanotechnology is applicable to many industry clusters and can be used to address current and future market needs. We have historically identified a number of existing and emerging market opportunities within industry clusters where we believe nanotechnology could yield disruptive capabilities and create value. The two charts below identify these market opportunities and the pipeline of portfolio companies across industry clusters that seek to fulfill them, respectively. We also include the percent of the value
of our portfolio in each of the three industry clusters around which our portfolio has matured.

We refer to the three largest clusters of investment as "Nanotech for CleantechSM," "Nanotech for ElectronicsSM" and "Nanotech for HealthcareSM," respectively. These three clusters are comprised of multi-billion dollar industries that have grown historically through innovation of technology.
We classify Nanotech for CleantechSM companies as those that seek to improve performance, productivity or efficiency, and to reduce environmental impact, waste, cost, energy consumption or raw materials using nanotechnology-enabled solutions. "Cleantech" is a term used commonly to describe products and processes that solve global problems related to resource constraints.
We classify Nanotech for ElectronicsSM companies as those that use nanotechnology to address problems in electronics-related industries, including semiconductors.
We classify Nanotech for HealthcareSM companies as those that use nanotechnology to address problems in healthcare-related industries, including biotechnology, pharmaceuticals and medical devices.
We have and may continue to make investments outside these industry areas, and we may not maintain these industry clusters or the weightings within these clusters in future quarters.
We believe the development and commercialization of nanotechnology-enabled solutions are the result of the convergence of traditionally separate scientific disciplines such as biology, materials science, chemistry, electronics, information technology, and physics. We believe such nanotechnology enabled advances in each of these industry clusters, and in general, could not otherwise occur within one discipline alone.
Maturity of Current Equity-Focused Venture Capital Portfolio
Our equity-focused venture capital portfolio is composed of companies at varying maturities facing different types of risks. We have defined these levels of maturity and sources of risk as: 1) Early Stage/Technology Risk, 2) Mid Stage/Market Risk and 3) Late Stage/Execution Risk. Early-stage companies have a high degree of technical, market and execution risk, which is typical of initial investments by venture capital firms, including us. These companies often require substantial development of their technologies before they begin introducing products to market. Mid-stage companies are those that have overcome most of the technical risk associated with their products and are now focused on addressing the market acceptance for their products. For those companies
developing therapeutics or medical devices, the focus is on bringing their products through the first phases of clinical trials. Late-stage companies are those that have determined there is a market for their products, and they are now focused on sales execution and scale. Late-stage healthcare and biotechnology companies are typically either in Phase III Clinical Trials, which are the pivotal trials before a possible FDA approval and commercial launch of a product, or are generating revenue from the commercial sale of one or more products. The charts below show our assessment of the stage of maturity of the 31 companies in our equity-focused portfolio of investments and the distribution of ownership of our portfolio companies within each of these stages of maturity, respectively.
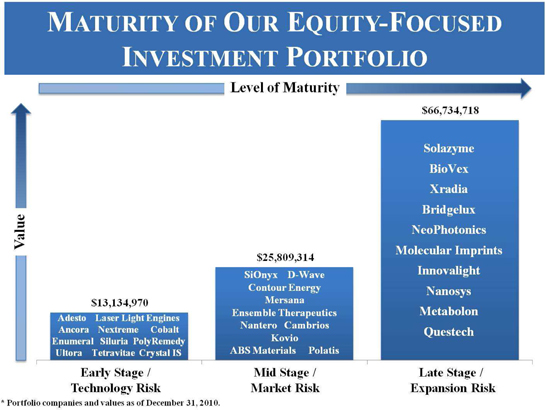
We seek to create a portfolio of companies that enables consistent flows of potential exit events in multiple industry sectors that can be monetized as these companies mature. We believe a portfolio of companies focused on a diverse set of industry clusters reduces the potential impact of cyclicality of any one cluster on the flow of potential exit events. Our current portfolio is comprised of companies at varying stages of maturity in a diverse set of industry clusters. As our portfolio companies mature, we seek to invest in new early and mid-stage companies that may mature into mid and late-stage companies. This continuous progression creates a pipeline of investment maturities that may lead to more frequent exit events of our portfolio companies. This pipeline is demonstrated by the distribution of our
current portfolio companies by stage within each industry cluster.
We expect some of our portfolio companies to transition between stages of maturity over time. This transition may be forward if the company is maturing and is successfully executing its business plan or may be backward if the company is not successfully executing its business plan or decides to change its business plan substantially from its original plan. Transitions backward are commonly accompanied by an increase in non-performance risk, which reduces valuation. We discuss non-performance risk and its implications on value below in the section titled Valuation of Investments.
During the fourth quarter of 2010, we transitioned two companies, SiOnyx, Inc., and D-Wave Systems, Inc., from being classified as early-stage companies to mid-stage companies, and we transitioned Innovalight, Inc., from a mid-stage company to a late-stage company. We classified our new portfolio company, Ultora, Inc., as an early-stage company as of December 31, 2010.
We currently have 22 companies in our equity-focused venture capital portfolio that generate revenues ranging from nominal to significant from commercial sales of products and/or services, from commercial partnerships and/or from government grants. In aggregate, our portfolio companies had approximately $380 million in revenue in 2010, a 42 percent increase from aggregate 2009 revenue of approximately $267 million.
On January 24, 2011, Amgen, Inc., agreed to acquire BioVex Group, Inc., for an upfront payment of $425 million and milestone payments of $575 million. This transaction closed on March 4, 2011. On March 11, 2011, the Company received its upfront payment of $7,702,470, which did not include $958,296 held in escrow. If all the milestone payments were to be paid by Amgen, we would receive $18,187,158. There can be no assurances as to how much of this amount we will ultimately realize. On December 31, 2010, the value of our investment in BioVex was $11,430,062, which included the upfront payment and certain discounts applied to future escrow and milestone payments BioVex may be eligible to receive. As of December 31, 2010, our cost basis in BioVex was $3,962,447.
On February 2, 2011, NeoPhotonics Corporation completed an IPO by selling 7,500,000 shares of common stock at $11 per share. Harris & Harris Group purchased 50,000 shares in this transaction. The common stock of NeoPhotonics trades on the New York Stock Exchange under the symbol "NPTN." As of December 31, 2010, Harris & Harris Group owned an aggregate of 400,907 shares of NeoPhotonics, which converted to common stock on a one-for-one basis as of the IPO. This position was valued at $4,249,615 as of December 31, 2010. The key inputs to our valuation of NeoPhotonics were the share price as of the close of the first day of trading following the company's IPO and a liquidity discount owing to the 180-day lock-up period. As of March 14, 2011, NeoPhotonics' closing price was $9.88 per share.
During the second half of 2010, three of our privately held companies retained bankers to explore opportunities to sell those companies. Two of these three companies have received offers for acqusition through non-bindin letters of intent. There can be no assurance that these companies will successfully complete a sale. A variety of factors, including general business conditions, could lead one or more of these companies to terminate such efforts or could lead to one or more of the potential acquirers to rescind their non-binding offers to purchase those companies.
On March 11, 2011, Solazyme, Inc., filed a registration statement on Form S-1 to register its shares of common stock for an IPO. There can be no assurance that this company will successfully complete an IPO, and a variety of factors, including stock market and general business conditions, could lead it to terminate such efforts to complete an IPO.
Current Business Environment
The fourth quarter of 2010 concluded with the public markets continuing to increase broadly in value. Amidst this improvement in the value of public equities, there were sustained positive signs in the exit market for venture-backed companies with 14 venture-backed companies managing to complete IPOs, up from three IPOs in the same quarter of 2009. However, even within this improving general economic environment, the availability of capital for venture capital firms and venture-backed companies continues to be restricted. Investors in venture capital funds are becoming more selective not only with the venture capital funds they invest in, but also with the amount of capital they invest in these funds. In 2010, the U.S. venture capital industry only managed to raise a total of $11.6 billion across 119 funds, the
lowest level in seven years, according to Dow Jones LP Source. Although fundraising for late-stage funds increased throughout 2010, both fundraising for early-stage and multi-stage funds continued to slide in 2010. Early-stage funds raised by 73 firms accounted for $4.8 billion, a 12 percent decrease from 2009. This trend is in part owing to the closely watched 10-year benchmark for venture capital returns that stood at minus 4.6 percent as of September 30, 2010, which is the most recent data available for this statistic from Cambridge Associates, LLC.
Historically, difficult venture environments have resulted in a higher than normal number of companies not receiving financing and being subsequently closed down with a loss to venture investors, and other companies receiving financing but at significantly lower valuations than the preceding financing rounds. This issue is compounded by the fact that many existing venture capital firms have few remaining years of investment and available capital owing to the finite lifetime of the funds managed by these firms. Additionally, even if a firm was able to raise a new fund, commonly new funds are not permitted to invest new funds in existing investments. This limitation of available capital can lead to fractured syndicates of investors. A fractured syndicate can result in a portfolio company being unable to raise
additional capital to fund operations. This issue is especially acute in capital-intensive industries that are enabled by nanotechnology, such as healthcare, semiconductors and electronics, and cleantech. The portfolio company may be forced to sell before reaching its full potential or be shut down entirely if the remaining investors cannot financially support the company. As such, the currently improving exit environment for venture-backed companies through IPOs and M&A transactions and the currently improving public markets in general may not translate to an increase in the available capital to venture-backed companies, particularly those that have investments from funds that are in the latter stage of life unless the markets continue to improve for some time into the future.
Our overall goal remains unchanged, which is to maintain our leadership position in investing in nanotechnology and microsystems and to increase our net asset value. The current environment for venture capital financings continues to favor those firms that have capital to invest regardless of the stage of the investee company. We continue to finance our new and follow-on equity and convertible debt investments from our cash reserves, currently invested in U.S. Treasury obligations. We believe the turmoil of the venture capital industry and the current economic climate provide opportunities to invest this capital at historically low valuations in equity and convertible debt securities and at high yields in non-convertible debt securities of new and existing privately held and publicly traded companies of varying
maturities.
Valuation of Investments
We value our privately held venture capital investments each quarter as determined in good faith by our Valuation Committee, a committee of all the independent directors, within guidelines established by our Board of Directors in accordance with the 1940 Act. (See "Footnote to Consolidated Schedule of Investments" contained in "Consolidated Financial Statements.")
The values of privately held, venture capital-backed companies are inherently more difficult than publicly traded companies to assess at any single point in time because securities of these types of companies are not actively traded. We believe, perhaps even more than in the past, that illiquidity, and the perception of illiquidity, can affect value. Management believes further that the long-term effects of the difficult venture capital market and difficult, but improving, exit environments will continue to affect negatively the fundraising ability of weak companies regardless of near-term improvements in the overall global economy and public markets, and that these factors can also affect value.
In each of the years in the period 2006 through 2010, the Company recorded the following gross write-ups in privately held securities as a percentage of net assets at the beginning of the year ("BOY"), gross write-downs in privately held securities as a percentage of net assets at the beginning of the year, and change in value of private portfolio securities as a percentage of net assets at the beginning of the year.
| |
|
2006
|
|
|
2007
|
|
|
2008
|
|
|
2009
|
|
|
2010
|
|
| |
|
|
|
|
|
|
|
|
|
|
|
|
|
|
|
|
Net Asset Value, BOY
|
|
$ |
117,987,742 |
|
|
$ |
113,930,303 |
|
|
$ |
138,363,344 |
|
|
$ |
109,531,113 |
|
|
$ |
134,158,258 |
|
| |
|
|
|
|
|
|
|
|
|
|
|
|
|
|
|
|
|
|
|
|
|
Gross Write-Downs During Year
|
|
$ |
(4,211,323 |
) |
|
$ |
(7,810,794 |
) |
|
$ |
(39,671,588 |
) |
|
$ |
(12,845,574 |
) |
|
$ |
(11,391,367 |
) |
| |
|
|
|
|
|
|
|
|
|
|
|
|
|
|
|
|
|
|
|
|
|
Gross Write-Ups During Year
|
|
$ |
279,363 |
|
|
$ |
11,694,618 |
|
|
$ |
820,559 |
|
|
$ |
21,631,864 |
|
|
$ |
30,051,847 |
|
| |
|
|
|
|
|
|
|
|
|
|
|
|
|
|
|
|
|
|
|
|
|
Gross Write-Downs as a Percentage of Net Asset Value, BOY
|
|
|
-3.57 |
% |
|
|
-6.86 |
% |
|
|
-28.67 |
% |
|
|
-11.7 |
% |
|
|
-8.5 |
% |
| |
|
|
|
|
|
|
|
|
|
|
|
|
|
|
|
|
|
|
|
|
|
Gross Write-Ups as a Percentage of Net Asset Value, BOY
|
|
|
0.24 |
% |
|
|
10.26 |
% |
|
|
0.59 |
% |
|
|
19.7 |
% |
|
|
22.4 |
% |
| |
|
|
|
|
|
|
|
|
|
|
|
|
|
|
|
|
|
|
|
|
|
Net Change as a Percentage of Net Asset Value, BOY
|
|
|
-3.33 |
% |
|
|
3.40 |
% |
|
|
-28.08 |
% |
|
|
8.0 |
% |
|
|
13.9 |
% |
1
From December 31, 2009, to December 31, 2010, the value of our private venture capital portfolio increased by $28,353,336, from $77,797,086 to $106,150,422. Approximately $9.8 million of this amount was from new and follow-on investments in our privately held portfolio companies. The remaining $18.6 million was from a net increase in the value of our portfolio companies. The table below indicates some of the inputs used to determine value of our privately held portfolio companies and the portion of the change in value, on a quarter over quarter basis, relevant to those inputs. We note that our Valuation Committee and ultimately our Board of Directors take into account multiple sources of quantitative and qualitative inputs to determine the value of our privately held
portfolio companies.
| |
|
Q3 2010 to
Q4 2010
|
|
|
Q2 2010 to
Q3 2010
|
|
|
Q1 2010 to
Q2 2010
|
|
|
Q4 2009 to
Q1 2010
|
|
|
Value of Privately Held Portfolio as of Previous Quarter
|
|
$ |
96,779,429 |
|
|
$ |
92,039,997 |
|
|
$ |
83,014,946 |
|
|
$ |
77,797,086 |
|
|
Value of Privately Held Portfolio as of Current Quarter
|
|
$ |
106,150,422 |
|
|
$ |
96,779,429 |
|
|
$ |
92,039,997 |
|
|
$ |
83,014,946 |
|
Examples of Inputs that Contribute to Changes in Value
|
Total New and Follow-On Investments
|
|
$ |
393,650 |
|
|
$ |
3,320,255 |
|
|
$ |
4,652,106 |
|
|
$ |
1,426,580 |
|
|
(+) Due to Terms of New Equity Rounds of Financing
|
|
$ |
192,409 |
|
|
$ |
1,023,808 |
|
|
$ |
11,564,433 |
|
|
$ |
1,436,628 |
|
|
(-) Due to Terms of New Equity Rounds of Financing
|
|
$ |
0 |
|
|
$ |
0 |
|
|
$ |
(280,649 |
) |
|
$ |
0 |
|
|
(+) Due to (+) in Values of Comparables or Indications of Value From Potential Acquirers
|
|
$ |
13,268,122 |
|
|
$ |
1,407,773 |
|
|
$ |
730,026 |
|
|
$ |
2,151,404 |
|
|
(-) Due to (-) in Values of Comparables or Indications of Value From Potential Acquirers
|
|
$ |
(2,495,827 |
) |
|
$ |
0 |
|
|
$ |
(1,618,341 |
) |
|
$ |
0 |
|
|
(+) Due to (-) in Non-Performance Risk
|
|
$ |
0 |
|
|
$ |
53,893 |
|
|
$ |
1,355,025 |
|
|
$ |
2,511,106 |
|
|
(-) Due to (+) in Non-Performance Risk
|
|
$ |
(2,275,810 |
) |
|
$ |
(1,304,165 |
) |
|
$ |
(7,172,178 |
) |
|
$ |
(2,307,768 |
) |
|
Other Factors(1)
|
|
$ |
288,449 |
|
|
$ |
237,868 |
|
|
$ |
(205,371 |
) |
|
$ |
(90 |
) |
| |
|
|
|
|
|
|
|
|
|
|
|
|
|
|
|
|
|
Total Change in Value of Privately Held Portfolio from Quarter to Quarter
|
|
$ |
9,370,993 |
|
|
$ |
4,739,432 |
|
|
$ |
9,025,051 |
|
|
$ |
5,217,860 |
|
(1) Other factors include changes in accrued bridge note interest, currency fluctuations and the value of warrants.
The values of publicly traded comparables on December 31, 2010, and indications of value from potential or confirmed acquirers were significant factors in determining the values of five of our 32 privately held portfolio companies. One of these five companies is BioVex Group, Inc. The key input to the valuation of our investment in BioVex Group, Inc., at December 31, 2010, was the terms of the definitive acquisition agreement between BioVex and Amgen that closed on March 4, 2011. The key inputs to the valuation of our investment in NeoPhotonics Corporation were the share price as of the close of the first day of trading following the company’s IPO and a liquidity discount owing to the 180-day lock-up period. As of March
14, 2011, the closing price of NeoPhotonics' common stock was $9.88 per share. NeoPhotonics and the three other companies out of the five in this classification accounted for approximately $37 million of the total value of our venture capital portfolio as of December 31, 2010. These values could differ materially if calculated on a different date due to changes in values and/or operating performance of the publicly traded comparables or should potential acquisitions of a subset of these companies not be consummated.
As part of the valuation process, we consider non-performance risk. Non-performance risk is the risk that a portfolio company will be: (a) unable to raise capital, will need to be shut down and will not return our invested capital; or (b) able to raise capital, but at a valuation significantly lower than the implied post-money valuation. Our best estimate of the non-performance risk of our portfolio companies has been quantified and included in the valuation of the companies as of December 31, 2010. In the future, as these companies receive terms for additional financings or are unable to receive additional financing and, therefore, proceed with sales or shutdowns of the business, we expect the contribution of the discount for
non-performance risk to vary in importance in determining the values of our securities of these companies. As of December 31, 2010, non-performance risk was a significant factor in determining the values of 12 of our 32 privately held portfolio companies. These 12 companies accounted for approximately $27 million of the total value of our privately held venture capital portfolio. We increased the non-performance risk, thereby decreasing the value, of four companies. We decreased the non-performance risk, thereby increasing the value, of zero companies. We maintained the same level of non-performance risk in eight companies.
As of December 31, 2010, our top ten investments by value accounted for approximately 72 percent of the value of our venture capital portfolio. As of that date, we believe at least four of these ten companies will require capital by the end of 2011.
Top Ten Investments
by Value |
| Company Name |
Value as of
December 31, 2010 |
Cumulative %
of Venture Capital Portfolio |
| Solazyme, Inc. |
$23,225,822 |
22% |
| BioVex Group, Inc. |
$11,430,062 |
33% |
| Xradia, Inc. |
$9,279,027 |
41% |
| Sionyx, Inc. |
$6,528,352 |
48% |
| Bridgelux, Inc. |
$4,862,998 |
52% |
| AdestoTechnologies Corporation |
$4,620,000 |
56% |
| D-Wave Systems, Inc. |
$4,365,484 |
61% |
| NeoPhotonics, Inc. |
$4,249,615 |
65% |
| Laser Light Engines, Inc. |
$4,214,709 |
69% |
| Contour Energy Systems, Inc. |
$4,122,378 |
72% |
| 72 Percent of Value of Venture Capital Portfolio |
The increase or decrease in the value of our venture capital investments does not affect the day-to-day operations of the Company, as we had no debt as of December 31, 2010. We fund our venture capital investments and daily operating expenses from interest earned and proceeds from the sales of our investments in U.S. government and agency obligations. As of December 31, 2010, we held $38,274,617 in U.S. government obligations, and we had an additional $3,756,919 in cash.
Investment Objective
Our principal objective is to achieve long-term capital appreciation by making equity-focused venture capital investments. Therefore, a significant portion of our current venture capital investment portfolio provides little or no income in the form of dividends or interest. Current income is a secondary objective. We are implementing a strategy that we believe will provide greater regularity and shorter time periods between realizations of capital gains on investments. As part of this strategy, we are seeking to increase our current income by providing debt financing to privately held and publicly traded small companies. We seek to reach the point where future growth is financed through reinvestment of
our capital gains from our venture capital investments and where current income offsets our annual expenses during periods of time between realizations of capital gains on our investments.
We currently earn interest income from fixed-income securities, including U.S. government and agency securities. The amount of interest income we earn varies with the average balance of our fixed-income portfolio and the average yield on this portfolio. In previous years, we have been able to generate substantial amounts of interest income from our holdings of U.S. Treasury securities. As of December 31, 2010, we held one short-duration U.S. Treasury security yielding approximately 0.1 percent. As of December 31, 2010, yields for 3-month, 6-month, and 12-month U.S. Treasury securities were 0.12 percent, 0.19 percent and 0.29 percent, respectively. With yields at this level, we expect to generate less interest
income from U.S. government securities than in previous fiscal quarters and years.
Results of Operations
We present the financial results of our operations utilizing accounting principles generally accepted in the United States of America ("GAAP") for investment companies. On this basis, the principal measure of our financial performance during any period is the net increase (decrease) in our net assets resulting from our operating activities, which is the sum of the following three elements:
Net Operating Income (Loss) - the difference between our income from interest, dividends, and fees and our operating expenses.
Net Realized Gain (Loss) on Investments - the difference between the net proceeds of sales of portfolio securities and their stated cost, plus income from interests in limited liability companies.
Net Increase (Decrease) in Unrealized Appreciation or Depreciation on Investments - the net unrealized change in the value of our investment portfolio.
Owing to the structure and objectives of our business, we generally expect to experience net operating losses and seek to generate increases in our net assets from operations through the long term appreciation of our venture capital investments. We have relied, and continue to rely, primarily on proceeds from sales of investments, rather than on investment income, to defray a significant portion of our operating expenses. Because such sales are unpredictable, we attempt to maintain adequate working capital to provide for fiscal periods when there are no such sales. During 2010, we made our first venture debt investment. While the interest income generated from this investment did not defray a significant portion of our
operating expenses in 2010, further investments in venture debt could generate more substantial investment income in future years.
The potential for, or occurrence of, inflation could result in rising interest rates for government-backed debt. This trend would have two effects on our business. First, the spread between the interest rates we can obtain from investing low-risk government debt versus high-risk venture debt will compress, which would result in a reduction of the risk premium associated with investments in venture debt. We may reduce the number and amount invested in venture debt should this risk premium decrease substantially as to not compensate us adequately for the risk associated with such investments. Second, funds drawn from our line of credit will accrue interest at a rate that fluctuates with the London Interbank Offered Rate (LIBOR). LIBOR is expected to increase in times of
inflation. Our venture debt investments may include both fixed and floating interest rates. Our interest income would decrease if the spread between the interest rate on funds from our line of credit and our venture debt investments decrease.
Years Ended December 31, 2010, 2009, and 2008
During the year ended December 31, 2010, we had a net increase in net assets resulting from operations of $10,586,850.
During the years ended December 31, 2009, and 2008, we had net decreases in net assets resulting from operations of $148,465, and $49,181,497, respectively.
Investment Income and Expenses:
During the years ended December 31, 2010, 2009, and 2008, we had net operating losses of $7,555,807, $8,761,215, and $10,687,151, respectively. The variation in these results is primarily owing to the changes in investment income and operating expenses, including non-cash expense of $2,088,091 in 2010, $3,089,520 in 2009, and $5,965,769 in 2008 associated with the granting of stock options. During the years ended December 31, 2010, 2009, and 2008, total investment income was $446,038, $247,848, and $1,987,347, respectively. During the years ended December 31, 2010, 2009, and 2008, total operating expenses were $8,001,845, $9,009,063, and $12,674,498, respectively.
During 2010, as compared with 2009, investment income increased from $247,848 to $446,038, reflecting an increase in interest income from bridge notes and the participation agreement, offset by a decrease in our average holdings of U.S. government securities as well as a substantial decrease in interest rates. The average yield on our U.S. government securities decreased from 0.3 percent for the year ended December 31, 2009, to 0.1 percent for the year ended December 31, 2010. During the twelve months ended December 31, 2010, our average holdings of such securities were $47,139,264, as compared with $52,154,428 during the year ended December 31, 2009.
Operating expenses, including non-cash, stock-based compensation expenses, were $8,001,845 and $9,009,063 for the twelve months ended December 31, 2010, and December 31, 2009, respectively. The decrease in operating expenses for the twelve months ended December 31, 2010, as compared with the twelve months ended December 31, 2009, was primarily owing to decreases in salaries, benefits and stock-based compensation expense, administration and operations expense and professional fees, offset by an increase in rent expense, directors' fees and expenses, and custody fees. Salaries, benefits and stock-based compensation expense decreased by $1,040,081, or 16.4 percent, through December 31,
2010, as compared with December 31, 2009, primarily as a result of a decrease in non-cash expense of $1,001,429 associated with the Harris & Harris Group, Inc. 2006 Equity Incentive Plan (the "Stock Plan"). While the non-cash, stock-based, compensation expense for the Stock Plan increased our operating expenses by $2,088,091, this increase was offset by a corresponding increase to our additional paid-in capital, resulting in no net impact to our net asset value. The non-cash, stock-based, compensation expense and corresponding increase to our additional paid-in capital may increase in future quarters. Administration and operations expense decreased by $114,504, or 10.2 percent, for the year ended December 31, 2010, as compared with the year ended December 31, 2009, primarily as a result of a decrease in our directors' and officers' liability insurance expense and decreases in the expenses related to the annual report and proxy, offset by increases
in the cost of non-employee related insurance and expenses associated with the relocation of our corporate headquarters in New York City. Professional fees decreased by $14,551, or 1.9 percent, for the year ended December 31, 2010, as compared with the year ended December 31, 2009, primarily as a result of a decrease in accounting and legal fees, offset by an increase in certain consulting fees. Rent expense increased $85,628, or 27.1 percent, for the year ended December 31, 2010. Our rent expense of $402,232 for the year ended December 31, 2010, includes $319,129 of rent paid in cash and $83,103 of non-cash rent expense, credits and abatements that we recognize on a straight-line basis over the lease term. Our cash-based rent expense in 2009 was $316,604. Our rent paid in cash of $319,129 includes $47,094 of real estate tax escalation charges from 2003 to 2010 paid on our previous corporate headquarters located at 111 West 57
Street in New York City. For the year ended December 31, 2010, we had a loss of $56,540 as a result of abandoning our lease at our former office prior to the end of the lease term, which expired in April 2010. Directors' fees and expenses increased by $6,773, or 2.0 percent, for the year ended December 31, 2010, as compared with the year ended December 31, 2009, primarily as a result of increases in directors' travel-related expenses. Custody fees increased by $12,543, or 15.0 percent, for the year ended December 31, 2010, as compared with the year ended December 31, 2009, owing to the higher fees charged by our new custodian, The Bank of New York Mellon, which has more expertise in working with investment companies than our prior custodian.
During 2009, as compared with 2008, investment income decreased from $1,987,347 to $247,848, primarily reflecting a substantial decrease in interest rates. The average yield on our U.S. government securities decreased from 3.2 percent for the year ended December 31, 2008, to 0.3 percent for the year ended December 31, 2009. During the twelve months ended December 31, 2009, our average holdings of such securities were $52,154,428, as compared with $55,978,372 during the year ended December 31, 2008.
Operating expenses, including non-cash, stock-based compensation expenses, were $9,009,063 and $12,674,498 for the twelve months ended December 31, 2009, and December 31, 2008, respectively. The decrease in operating expenses for the twelve months ended December 31, 2009, as compared with the twelve months ended December 31, 2008, was primarily owing to decreases in salaries, benefits and stock-based compensation expense and to decreases in administration and operations expense and directors’ fees and expenses, offset by increases in professional fees, rent expense and custody fees. Salaries, benefits and stock-based compensation expense decreased by $3,763,191, or 37.3 percent, through December 31, 2009, as compared with December 31,
2008, primarily as a result of a decrease in non-cash expense of $2,876,249 associated with the Stock Plan and a decrease in salaries and benefits owing primarily to a decrease in our headcount, mainly the retirement of Charles E. Harris. At December 31, 2009, we had 11 full-time employees, as compared with 12 full-time employees at December 31, 2008. While the non-cash, stock-based, compensation expense for the Stock Plan increased our operating expenses by $3,089,520, this increase was offset by a corresponding increase to our additional paid-in capital, resulting in no net impact to our net asset value. The non-cash, stock-based, compensation expense and corresponding increase to our additional paid-in capital may increase in future quarters. Administration and operations expense decreased by $34,759, or 3.0 percent, for the year ended December 31, 2009, as compared with the year ended December 31, 2008, primarily as a result of a decrease
in our directors' and officers' liability insurance expense and decreases in the cost of non-employee related insurance and managing directors’ travel-related expenses. Directors' fees and expenses decreased by $29,156, or 7.9 percent, for the year ended December 31, 2009, primarily as a result of fewer meetings held during the year, as compared with the year ended December 31, 2008. Professional fees increased by $73,070, or 10.5 percent, for the year ended December 31, 2009, as compared with the year ended December 31, 2008, primarily as a result of an increase in certain legal, consulting and accounting fees. Rent expense increased $40,581, or 14.7 percent, for the year ended December 31, 2009, owing to a full year of higher rent associated with our Palo Alto office lease which became effective July 1, 2008. Custody fees increased by $51,850, or 164.0 percent, for the year ended December 31, 2009, as compared with the year ended
December 31, 2008. This increase is owing to the higher fees charged by our new custodian, The Bank of New York Mellon, who has more expertise in working with investment companies.
Realized Income and Losses from Investments:
During the years ended December 31, 2010, 2009, and 2008, we realized net losses on investments of $3,740,518, $11,105,577, and $8,323,634, respectively. The variation in these results is primarily owing to variations in gross realized gains and losses from investments and income taxes in each of the three years. For the years ended December 31, 2010, 2009, and 2008, we realized losses from investments, before taxes, of $3,736,057, $11,106,330, and $8,289,513, respectively. Income tax expense (benefit) for the years ended December 31, 2010, 2009, and 2008 was $4,461, $(753), and $34,121, respectively.
During the year ended December 31, 2010, we realized net losses of $3,736,057, consisting primarily of realized losses on a portion of our investment in Kovio, Inc., of $257,007, on a portion of our investment in Mersana Therapeutics, Inc., of $190,902, in NanoGram Corporation of $3,136,552, in Orthovita, Inc., of $167,300, and realized losses on the disposal of fixed assets, offset by realized gains on our investment in Satcon Technology Corporation of $14,320 and realized gains on the sale of U.S. government securities. The realized losses on our investments in Kovio, Inc., and Mersana Therapeutics, Inc., were owing to the termination and expiration of certain warrants, respectively. The warrant from Kovio, Inc., was terminated pursuant to
the terms of the Series A' financing which closed during the second quarter of 2010. The warrant from Mersana Therapeutics, Inc., expired unexercised on October 21, 2010. On July 11, 2010, NanoGram was acquired for an undisclosed amount; holders of common stock did not receive any proceeds from this transaction. During the second quarter of 2010, we received a dividend payment of $13,218 representing our pro rata portion of the residual net proceeds from the liquidation of Optiva, Inc. We had invested in Optiva during 2002, and in 2005, it began liquidation under an assignment for the benefit of creditors. This sum represents the final payment from the liquidation.
During the year ended December 31, 2009, we realized net losses of $11,106,330, consisting primarily of realized losses on our investments in CSwitch Corporation of $5,649,297, in Exponential Business Development Company of $14,330, in Kereos, Inc., of $1,500,000, in Nanomix, Inc., of $3,176,125, in Questech Corporation of $16,253, and in Starfire Systems, Inc., of $750,000. Since the date of our investment of $25,000 in Exponential Business Development Company in 1995, we periodically received cash distributions totaling $31,208 through the date of the sale. During the third quarter of 2009, we received a payment of $4,115 from the sale of our interest in Nanomix, Inc. The realized loss on Questech Corporation was owing to an
unexercised warrant that expired on November 19, 2009.
During the year ended December 31, 2008, we realized net losses of $8,289,513, consisting primarily of realized losses on our investments in Chlorogen, Inc., of $1,326,072, on Evolved Nanomaterial Sciences, Inc., of $2,800,000, on NanoOpto Corporation of $3,688,581, on Phoenix Molecular Corporation of $93,487, on an unexercised warrant of Questech Corporation of $16,253 and on Zia Laser of $1,478,500, offset by realized gains of $1,110,821 on the sale of U.S. government securities. During the first quarter of 2008, we received a payment of $105,714 from the NanoOpto Corporation bridge note. The realized loss on Questech Corporation was owing to an unexercised warrant that expired on November 19, 2008.
Net Unrealized Appreciation and Depreciation of Portfolio Securities:
During the year ended December 31, 2010, net unrealized depreciation on total investments decreased by $21,883,175.
During the year ended December 31, 2009, net unrealized depreciation on total investments decreased by $19,718,327.
During the year ended December 31, 2008, net unrealized depreciation on total investments increased by $30,170,712.
During the year ended December 31, 2010, net unrealized depreciation on our venture capital investments decreased by $21,869,464, or 152.2 percent, from net unrealized depreciation of $14,366,426 at December 31, 2009, to net unrealized appreciation of $7,503,038 at December 31, 2010, owing primarily to increases in the valuations of the following investments held:
|
Investment
|
|
Amount of Write-Up
|
|
| |
|
|
|
|
BioVex Group, Inc.
|
|
$ |
9,060,913 |
|
|
D-Wave Systems, Inc.
|
|
|
1,121,841 |
|
|
Ensemble Therapeutics Corporation
|
|
|
500,000 |
|
|
Laser Light Engines, Inc.
|
|
|
118,907 |
|
|
Mersana Therapeutics, Inc.
|
|
|
937,882 |
|
|
Metabolon, Inc.
|
|
|
58,366 |
|
|
Questech Corporation
|
|
|
72,755 |
|
|
SiOnyx, Inc.
|
|
|
3,076,044 |
|
|
Solazyme, Inc.
|
|
|
10,971,812 |
|
|
Xradia, Inc.
|
|
|
3,555,811 |
|
The write-ups for the year ended December 31, 2010, were partially offset by decreases in the valuations of the following investments held:
|
Investment
|
|
Amount of Write-Down
|
|
| |
|
|
|
|
Ancora Pharmaceuticas Inc.
|
|
$ |
301,573 |
|
|
Bridgelux, Inc.
|
|
|
220,252 |
|
|
GEO Semiconductor Inc.
|
|
|
11,830 |
|
|
Innovalight, Inc.
|
|
|
1,241,665 |
|
|
Kovio, Inc.
|
|
|
1,750,165 |
|
|
Molecular Imprints, Inc.
|
|
|
2,031,749 |
|
|
Nanosys, Inc.
|
|
|
280,649 |
|
|
NeoPhotonics Corporation
|
|
|
1,519,991 |
|
|
Nextreme Thermal Solutions, Inc.
|
|
|
3,854,600 |
|
|
PolyRemedy, Inc.
|
|
|
53,893 |
|
|
TetraVitae Bioscience, Inc.
|
|
|
125,000 |
|
We had a decrease in unrealized depreciation for Kovio, Inc., of $227,469, and Mersana Therapeutics, Inc., of $171,752, owing to the termination and expiration of certain warrants, respectively. The warrant for Kovio, Inc., was terminated pursuant to the terms of the Series A' financing which closed during the second quarter of 2010. The warrant for Mersana Therapeutics, Inc., expired unexercised on October 21, 2010.
We had a decrease in unrealized depreciation for NanoGram Corporation of $3,136,552, which resulted from a realized loss on such investment during the period. On July 11, 2010, NanoGram was acquired for an undisclosed amount. Holders of common stock did not receive any proceeds from this transaction.
We had a decrease in unrealized depreciation for Orthovita, Inc., of $72,432 owing to the sale of its securities.
We had a decrease in unrealized depreciation owing to foreign currency translation of $178,295 on our investment in D-Wave Systems, Inc.
Unrealized depreciation on our U.S. government securities portfolio decreased from unrealized depreciation of $12,443 at December 31, 2009, to unrealized appreciation of $1,268 at December 31, 2010.
During the year ended December 31, 2009, net unrealized depreciation on our venture capital investments decreased by $19,758,422, or 57.9 percent, from net unrealized depreciation of $34,124,848 at December 31, 2008, to net unrealized depreciation of $14,366,426 at December 31, 2009, owing primarily to increases in the valuations of the following investments held:
|
Investment
|
|
Amount of Write-Up
|
|
| |
|
|
|
|
Adesto Technologies Corporation
|
|
$ |
1,320,000 |
|
|
BioVex Group, Inc.
|
|
|
845,952 |
|
|
Bridgelux, Inc.
|
|
|
987,642 |
|
|
CFX Battery, Inc.
|
|
|
812,383 |
|
|
Ensemble Discovery Corporation
|
|
|
500,000 |
|
|
Metabolon, Inc.
|
|
|
196,512 |
|
|
Molecular Imprints, Inc.
|
|
|
3,841,541 |
|
|
NeoPhotonics Corporation
|
|
|
3,350,923 |
|
|
Nextreme Thermal Solutions, Inc.
|
|
|
2,202,628 |
|
|
Questech Corporation
|
|
|
297,104 |
|
|
Siluria Technologies, Inc.
|
|
|
160,723 |
|
|
Solazyme, Inc.
|
|
|
5,376,988 |
|
|
Xradia, Inc.
|
|
|
1,723,215 |
|
These write-ups for the twelve months ended December 31, 2009, were partially offset by the following write-downs:
|
Investment
|
|
Amount of Write-Down
|
|
| |
|
|
|
|
Ancora Pharmaceuticals Inc.
|
|
$ |
1,072,811 |
|
|
Cambrios Technologies Corporation
|
|
|
257,878 |
|
|
Cobalt Technologies, Inc.
|
|
|
187,499 |
|
|
Crystal IS, Inc.
|
|
|
779,094 |
|
|
D-Wave Systems, Inc.
|
|
|
826,786 |
|
|
Innovalight, Inc.
|
|
|
1,537,713 |
|
|
Kovio, Inc.
|
|
|
2,266,912 |
|
|
Laser Light Engines, Inc.
|
|
|
999,999 |
|
|
Mersana Therapeutics, Inc.
|
|
|
17,500 |
|
|
NanoGram Corporation
|
|
|
1,471,805 |
|
|
Nanosys, Inc.
|
|
|
2,685,059 |
|
|
Orthovita, Inc.
|
|
|
72,432 |
|
|
PolyRemedy, Inc.
|
|
|
136,170 |
|
|
SiOnyx, Inc.
|
|
|
1,076,155 |
|
We also had decreases to unrealized depreciation for CSwitch Corporation of $5,629,011, Exponential Business Development Company of $15,361, Kereos, Inc., of $1,500,000, Nanomix, Inc., of $3,150,190 and Starfire Systems, Inc., of $750,000 owing to the disposal of their securities and changes in the capital account balance of Exponential Business Development Company prior to its sale. We had a decrease to unrealized depreciation for Questech Corporation of $16,253 owing to a realized loss on an unexercised warrant that expired on November 19, 2009.
We had an increase owing to foreign currency translation of $469,809 on our investment in D-Wave Systems, Inc.
Unrealized appreciation on our U.S. government securities portfolio decreased from $27,652 at December 31, 2008, to unrealized depreciation of $12,443 at December 31, 2009.
During the year ended December 31, 2008, net unrealized depreciation on our venture capital investments increased by $29,557,704, or 647.2 percent, from net unrealized depreciation of $4,567,144 at December 31, 2007, to net unrealized depreciation of $34,124,848 at December 31, 2008, owing primarily to decreases in the valuations of the following investments held:
|
Investment
|
|
Amount of Write-Down
|
|
| |
|
|
|
|
Adesto Technologies Corporation
|
|
$ |
1,100,000 |
|
|
Ancora Pharmaceuticals, Inc.
|
|
|
299,439 |
|
|
BioVex Group, Inc.
|
|
|
2,439,250 |
|
|
Bridgelux, Inc.
|
|
|
3,624,553 |
|
|
Cambrios Technologies Corporation
|
|
|
1,297,012 |
|
|
Cobalt Technologies, Inc.
|
|
|
187,499 |
|
|
Crystal IS, Inc.
|
|
|
1,001,300 |
|
|
CSwitch Corporation
|
|
|
5,177,946 |
|
|
D-Wave Systems, Inc.
|
|
|
22,670 |
|
|
Ensemble Discovery Corporation
|
|
|
1,000,000 |
|
|
Innovalight, Inc.
|
|
|
1,927,946 |
|
|
Kereos, Inc.
|
|
|
159,743 |
|
|
Kovio, Inc.
|
|
|
761,497 |
|
|
Mersana Therapeutics, Inc.
|
|
|
1,019,613 |
|
|
Metabolon, Inc.
|
|
|
2,136,734 |
|
|
Molecular Imprints, Inc.
|
|
|
2,365,417 |
|
|
NanoGram Corporation
|
|
|
4,415,417 |
|
|
Nanomix, Inc.
|
|
|
980,418 |
|
|
Neophotonics Corporation
|
|
|
4,024,305 |
|
|
Nextreme Thermal Solutions, Inc.
|
|
|
2,182,133 |
|
|
Polatis, Inc.
|
|
|
276,526 |
|
|
PolyRemedy, Inc.
|
|
|
122,250 |
|
|
Questech Corporation
|
|
|
463,968 |
|
|
Siluria Technologies, Inc.
|
|
|
160,723 |
|
|
SiOnyx, Inc.
|
|
|
1,076,153 |
|
|
Starfire Systems, Inc.
|
|
|
750,000 |
|
|
TetraVitae Bioscience, Inc.
|
|
|
125,000 |
|
We also had decreases in unrealized depreciation attributable to the reversal of depreciation owing to net realized losses on Chlorogen, Inc., of $1,326,072, on Evolved Nanomaterial Sciences, Inc., of $2,800,000, on NanoOpto Corporation of $3,688,581, on Questech Corporation of $16,253 owing to a realized loss on an unexercised warrant that expired on November 19, 2008, and on Zia Laser, Inc., of $1,478,672. For the twelve months ended December 31, 2008, we had increases in the valuations of our investments in Exponential Business Development Company of $25 and Solazyme, Inc., of $820,534. We had a decrease owing to foreign currency translation of $590,329 on our investment in D-Wave Systems,
Inc. Unrealized appreciation on our U.S. government securities portfolio decreased from $640,660 at December 31, 2007, to $27,652 at December 31, 2008.
Financial Condition
December 31, 2010
At December 31, 2010, our total assets and net assets were $149,289,168 and $146,853,912, respectively. Our net asset value per share at that date was $4.76, and our shares outstanding increased to 30,878,164 as of December 31, 2010.
Significant developments in the twelve months ended December 31, 2010, included an increase in the holdings of our venture capital investments of $28,126,941 and a decrease in our holdings of U.S. government obligations and cash of $15,527,510. The increase in the value of our venture capital investments from $78,023,481 at December 31, 2009, to $106,150,422 at December 31, 2010, resulted primarily from an increase in the net value of our venture capital investments of $18,132,021 and by four new and 27 follow-on investments of $10,060,721. The decrease in the value of our U.S. government obligations and cash from $57,559,046 at December 31, 2009, to $42,031,536 at December 31, 2010,
is primarily owing to the payment of cash for operating expenses of $5,672,401 and to new and follow-on venture capital investments totaling $10,060,721.
The following table is a summary of additions to our portfolio of venture capital investments made during the twelve months ended December 31, 2010:
|
New Investments
|
|
Amount of Investment
|
|
| |
|
|
|
|
ABS Materials, Inc.
|
|
$ |
250,000 |
|
|
Satcon Technology Corporation
|
|
|
99,957 |
|
|
GEO Semiconductor Inc.
|
|
|
500,000 |
|
|
Ultora, Inc.
|
|
|
1,250 |
|
|
Follow-On Investments
|
|
Amount of Investment
|
|
| |
|
|
|
|
ABS Materials, Inc.
|
|
$ |
125,000 |
|
|
Ancora Pharmaceuticals Inc.
|
|
|
500,000 |
|
|
Ancora Pharmaceuticals Inc.
|
|
|
600,000 |
|
|
Ancora Pharmaceuticals Inc.
|
|
|
400,000 |
|
|
Ancora Pharmaceuticals Inc.
|
|
|
300,000 |
|
|
BioVex Group, Inc.
|
|
|
354,390 |
|
|
BioVex Group, Inc.
|
|
|
323,077 |
|
|
Bridgelux, Inc.
|
|
|
250,041 |
|
|
Cambrios Technologies Corporation
|
|
|
92,400 |
|
|
D-Wave Systems, Inc.
|
|
|
580,257 |
|
|
Kovio, Inc.
|
|
|
526,225 |
|
|
Laser Light Engines, Inc.
|
|
|
250,000 |
|
|
Laser Light Engines, Inc.
|
|
|
250,000 |
|
|
Laser Light Engines, Inc.
|
|
|
40,000 |
|
|
Laser Light Engines, Inc.
|
|
|
90,000 |
|
|
Laser Light Engines, Inc.
|
|
|
910,000 |
|
|
Mersana Therapeutics, Inc.
|
|
|
87,500 |
|
|
Mersana Therapeutics, Inc.
|
|
|
84,475 |
|
|
Nanosys, Inc.
|
|
|
496,573 |
|
|
NeoPhotonics Corporation
|
|
|
2,455 |
|
|
NeoPhotonics Corporation
|
|
|
2,109 |
|
|
Orthovita, Inc.
|
|
|
98,427 |
|
|
Satcon Technology Corporation
|
|
|
22,134 |
|
|
Satcon Technology Corporation
|
|
|
27,960 |
|
|
SiOnyx, Inc.
|
|
|
339,760 |
|
|
SiOnyx, Inc.
|
|
|
956,740 |
|
|
Solazyme, Inc.
|
|
|
1,499,991 |
|
| |
|
|
|
|
|
Total
|
|
$ |
10,060,721 |
|
The following tables summarize the values of our portfolios of venture capital investments and U.S. government obligations, as compared with their cost, at December 31, 2010, and December 31, 2009:
| |
|
December 31,
|
|
| |
|
2010
|
|
|
2009
|
|
|
Venture capital investments, at cost
|
|
$ |
98,647,384 |
|
|
$ |
92,389,907 |
|
|
Net unrealized appreciation (depreciation)(1)
|
|
|
7,503,038 |
|
|
|
(14,366,426 |
) |
|
Venture capital investments, at value
|
|
$ |
106,150,422 |
|
|
$ |
78,023,481 |
|
| |
|
December 31,
|
|
| |
|
2010
|
|
|
2009
|
|
|
U.S. government obligations, at cost
|
|
$ |
38,273,349 |
|
|
$ |
55,960,024 |
|
|
Net unrealized appreciation
|
|
|
|
|
|
|
|
|
|
(depreciation)(1)
|
|
|
1,268 |
|
|
|
(12,443 |
) |
|
U.S. government obligations, at value
|
|
$ |
38,274,617 |
|
|
$ |
55,947,581 |
|
(1) At December 31, 2010, and December 31, 2009, the net accumulated unrealized appreciation (depreciation) on investments was $7,504,306 and $(14,378,869), respectively.
December 31, 2009
At December 31, 2009, our total assets and net assets were $136,109,101 and $134,158,258, respectively. Our net asset value per share at that date was $4.35, and our shares outstanding increased to 30,859,593 as of December 31, 2009.
Significant developments in the twelve months ended December 31, 2009, included an increase in the holdings of our venture capital investments and U.S. government obligations of $21,058,328 and $2,963,641, respectively. The increase in the value of our venture capital investments from $56,965,153 at December 31, 2008, to $78,023,481 at December 31, 2009, resulted primarily from an increase in the net value of our venture capital investments of $8,652,415 and two new and 29 follow-on investments of $12,344,051. The increase in the value of our U.S. government obligations from $52,983,940 at December 31, 2008, to $55,947,581 at December 31, 2009, is primarily owing to net proceeds of $21,264,140
received through a public follow-on offering and proceeds received from stock option exercises of $421,950, offset by the payment of cash basis operating expenses of $5,683,624 and by new and follow-on venture capital investments totaling $12,344,051.
The following table is a summary of additions to our portfolio of venture capital investments made during the twelve months ended December 31, 2009:
|
New Investments
|
|
Amount of Investment
|
|
| |
|
|
|
|
Orthovita, Inc.
|
|
$ |
99,624 |
|
|
Enumeral Technologies, Inc.
|
|
|
250,000 |
|
|
Follow-On Investments
|
|
Amount of Investment
|
|
| |
|
|
|
|
Adesto Technologies Corporation
|
|
$ |
550,000 |
|
|
Adesto Technologies Corporation
|
|
|
1,635,775 |
|
|
Ancora Pharmaceuticals Inc.
|
|
|
125,000 |
|
|
Ancora Pharmaceuticals Inc.
|
|
|
200,000 |
|
|
Ancora Pharmaceuticals Inc.
|
|
|
100,000 |
|
|
Ancora Pharmaceuticals Inc.
|
|
|
700,000 |
|
|
BioVex Group, Inc.
|
|
|
111,111 |
|
|
BioVex Group, Inc.
|
|
|
166,667 |
|
|
BioVex Group, Inc.
|
|
|
299,145 |
|
|
Bridgelux, Inc.
|
|
|
250,124 |
|
|
Cambrios Technologies Corporation
|
|
|
515,756 |
|
|
CFX Battery, Inc.
|
|
|
3,492 |
|
|
CFX Battery, Inc.
|
|
|
533,239 |
|
|
CFX Battery, Inc.
|
|
|
1,000,000 |
|
|
CFX Battery, Inc.
|
|
|
300,000 |
|
|
Cobalt Technologies, Inc.
|
|
|
374,999 |
|
|
Crystal IS, Inc.
|
|
|
408,573 |
|
|
Ensemble Discovery Corporation
|
|
|
48,883 |
|
|
Innovalight, Inc.
|
|
|
721,090 |
|
|
Laser Light Engines, Inc.
|
|
|
890,000 |
|
|
Laser Light Engines, Inc.
|
|
|
500,000 |
|
|
Mersana Therapeutics, Inc.
|
|
|
200,000 |
|
|
Mersana Therapeutics, Inc.
|
|
|
250,000 |
|
|
Metabolon, Inc.
|
|
|
1,000,000 |
|
|
NeoPhotonics Corporation
|
|
|
87,364 |
|
|
NeoPhotonics Corporation
|
|
|
692,300 |
|
|
Orthovita, Inc.
|
|
|
99,808 |
|
|
Orthovita, Inc.
|
|
|
99,395 |
|
|
PolyRemedy, Inc.
|
|
|
121,706 |
|
| |
|
|
|
|
|
Total
|
|
$ |
12,334,051 |
|
Cash Flow
Year Ended December 31, 2010
Net cash used in operating activities for the year ended December 31, 2010, was $5,843,791, primarily reflecting the payment of operating expenses.
Net cash provided by investing activities for the year ended December 31, 2010, was $7,968,532, primarily reflecting proceeds from the sale of U.S. government securities of $17,700,144 and venture capital investments of $408,899, offset by venture capital investments of $10,050,721.
Cash provided by financing activities for the year ended December 31, 2010, was $20,713, resulting from the exercise of stock options, offset by the payment of certain offering costs relating to the public follow-on offering that closed on October 9, 2009.
Year Ended December 31, 2009
Net cash used in operating activities for the year ended December 31, 2009, was $5,277,132, primarily reflecting the payment of operating expenses.
Net cash used in investing activities for the year ended December 31, 2009, was $15,433,826, primarily reflecting venture capital investments of $12,344,051, less proceeds from the sale of venture capital investments of $7,365.
Cash provided by financing activities for the year ended December 31, 2009, was $21,686,090, resulting from the issuance of 4,887,500 new shares of our common stock on October 9, 2009, in a public follow-on offering and exercise of stock options.
Year Ended December 31, 2008
Net cash used in operating activities for the year ended December 31, 2008, was $4,178,331, primarily owing to the payment of operating expenses.
Cash used in investing activities for the year ended December 31, 2008, was $9,865,758, primarily reflecting a net decrease in our investment in U.S. government securities of $7,798,836 and investments in private placements of $17,779,462, less proceeds from the sale of venture capital investments of $136,837.
Cash provided by financing activities for the year ended December 31, 2008, was $14,383,497, resulting from the issuance of 2,545,000 new shares of our common stock on June 20, 2008, in a registered direct stock offering.
Liquidity and Capital Resources
Our liquidity and capital resources are generated and are generally available through our cash holdings, interest earned on our investments on U.S. government securities, cash flows from the sales of U.S. government securities and payments received on our venture debt investments, proceeds from periodic follow-on equity offerings and realized capital gains retained for reinvestment.
We fund our day-to-day operations using interest earned and proceeds from the sales of our investments in U.S. government securities and interest earned from our venture debt securities. The increase or decrease in the valuations of our portfolio companies does not impact our daily liquidity. At December 31, 2010, and December 31, 2009, we had no investments in money market mutual funds. We have not issued any debt securities, and, therefore, are not subject to credit agency downgrades.
As a venture capital company, it is critical that we have capital available to support our best companies until we have an opportunity for liquidity in our investments. As such, we will continue to maintain a substantial amount of liquid capital on our balance sheet. However, to complement our equity-focused portfolio investing, we seek to invest some of this capital in venture debt where we will have more defined investment return timelines than we currently have in our existing portfolio. In addition, in the future, we may from time to time opt to borrow money to make investments, specifically in debt securities that generate cash flow and have a known timeframe for return on investment.
On February 24, 2011, we established a new $10 million three-year revolving credit facility with TD Bank, N.A., to be used in conjunction with our venture debt investments.
We believe that the difficult venture capital environment may continue to adversely affect the valuation of investment portfolios, tighter lending standards and reduced access to capital. These conditions may lead to a further decline in net asset value and/or decline in valuations of our portfolio companies. Although we cannot predict future market conditions, we continue to believe that our current cash and U.S. government security holdings and our ability to adjust our investment pace will provide us with adequate liquidity to execute our current business strategy.
Except for a rights offering, we are also generally not able to issue and sell our common stock at a price below our net asset value per share, exclusive of any distributing commission or discount, without shareholder approval. As of December 31, 2010, our net asset value was $4.76 per share and our closing market price was $4.38 per share. We do not currently have shareholder approval to issue or sell shares below our net asset value per share.
December 31, 2010
At December 31, 2010, and December 31, 2009, our total net primary liquidity was $42,079,934 and $57,642,233, respectively.
Our primary liquidity, which is comprised of our cash, U.S. government securities, receivables from unsettled trades, receivables from portfolio companies and interest receivables, are adequate to cover our gross cash operating expenses. Our gross cash operating expenses for 2010 and 2009 totaled $5,672,401 and $5,683,624, respectively.
The decrease in our primary liquidity from December 31, 2009, to December 31, 2010, is primarily owing to the use of funds for investments and payment of net operating expenses.
At December 31, 2010, and December 31, 2009, our secondary liquidity was $0 and $226,395, respectively. Our secondary liquidity consists of our publicly traded securities. Although these companies are publicly traded, their stock may not trade at high volumes and prices can be volatile, or our stock may be subject to restrictions on transfer, such as lock-up provisions, which may restrict our ability to sell our positions at any given time.
On October 9, 2009, we completed the sale of 4,887,500 shares of our common stock at a price of $4.75 per share to the public for total gross proceeds of $23,215,625; net proceeds of this offering, after placement agent fees and offering costs of $2,000,413, were $21,215,212. We intend to use, and have been using, the net proceeds of this offering to make new investments in nanotechnology, as well as for follow-on investments in our existing venture capital investments and for working capital. Through December 31, 2010, we have used all of the net proceeds from this offering for these purposes.
On October 26, 2009, we filed a post-effective amendment to our shelf registration statement on Form N-2 to deregister 2,112,500 shares of common stock that were not sold in the public offering that closed on October 9, 2009.
On July 1, 2008, we signed a five-year lease for office space at 420 Florence Street, Suite 200, Palo Alto, California, commencing on August 1, 2008, and expiring on August 31, 2013. Total rent expense for our office space in Palo Alto was $128,962 in 2010, $125,205 in 2009 and $51,525 in 2008. Future minimum lease payments in each of the following years are: 2011 - $132,831; 2012 - $136,816 and 2013 - $93,135.
On September 24, 2009, we signed a ten-year lease for office space at 1450 Broadway, New York, New York. The lease commenced on January 21, 2010, and this office space replaced our corporate headquarters previously located at 111 West 57th Street in New York City. The base rent is $36 per square foot with a 2.5 percent increase per year over the 10 years of the lease, subject to a full abatement of rent for four months and a rent credit for six months throughout the lease term. The lease expires on December 31, 2019. Total rent expense for our office space in New York City was $215,319 in 2010. Future minimum lease payments in each of the following years are: 2011 - $188,756; 2012 - $236,768; 2013 - $242,688; 2014 - $248,755; 2015 - $278,394; and thereafter for the remaining term – an aggregate of $1,184,689.
On January 21, 2010, we relocated our corporate headquarters from 111 West 57th Street in New York City to 1450 Broadway in New York City. The lease and sublease for our offices at 111 West 57th Street expired on April 17, 2010 and on April 29, 2010, respectively. Total rent expense for the office space at 111 West 57th Street was $57,951 in 2010, $191,399 in 2009 and $186,698 in 2008. Our rent expense in 2010 of $57,951 includes $47,094 of real estate tax escalation charges from 2003 to 2010 paid on
the office space at 111 West 57th Street.
December 31, 2009
At December 31, 2009, and December 31, 2008, our total net primary liquidity was $57,868,628 and $53,645,843, respectively.
Our net primary sources of liquidity, which consist of cash, our investment in the publicly traded shares of Orthovita, Inc., U.S. government obligations and receivables, are adequate to cover our gross cash operating expenses. Our gross cash operating expenses for 2009 and 2008 totaled $5,683,624 and $6,397,424, respectively.
The increase in our primary liquidity from December 31, 2008, to December 31, 2009, is primarily owing to the proceeds received through the public follow-on offering, partially offset by the use of funds for investments and payment of net operating expenses.
Critical Accounting Policies
The Company's significant accounting policies are described in Note 2 to the Consolidated Financial Statements and in the Footnote to the Consolidated Schedule of Investments. Critical accounting policies are those that are both important to the presentation of our financial condition and results of operations and those that require management’s most difficult, complex or subjective judgments. The Company considers the following accounting policies and related estimates to be critical:
Valuation of Portfolio Investments
The most significant estimate inherent in the preparation of our consolidated financial statements is the valuation of investments and the related amounts of unrealized appreciation and depreciation of investments recorded. As a BDC, we invest in primarily illiquid securities that generally have no established trading market.
Investments are stated at "value" as defined in the 1940 Act and in the applicable regulations of the SEC and GAAP. Value, as defined in Section 2(a)(41) of the 1940 Act, is (i) the market price for those securities for which a market quotation is readily available and (ii) the fair value as determined in good faith by, or under the direction of, the Board of Directors for all other assets. (See "Valuation Procedures" in the "Footnote to Consolidated Schedule of Investments.") As of December 31, 2010, our financial statements include privately held venture capital investments valued at $106,150,422, the fair values of which were determined in good faith by, or under the direction of, the Board of Directors. As of December 31, 2010, approximately 72 percent of our net
assets represent investments in portfolio companies valued at fair value by the Board of Directors.
Determining fair value requires that judgment be applied to the specific facts and circumstances of each portfolio investment, although our valuation policy is intended to provide a consistent basis for determining fair value of the portfolio investments. Factors that may be considered include, but are not limited to, the cost of the Company’s investment; transactions in the portfolio company’s securities or unconditional firm offers by responsible parties; the financial condition and operating results of the company; the long-term potential of the business and technology of the company; the values of similar securities issued by companies in similar businesses; multiples to revenues, net income or EBITDA that similar securities
issued by companies in similar businesses receive; the proportion of the company’s securities we own and the nature of any rights to require the company to register restricted securities under the applicable securities laws; the achievement of milestones; and the rights and preferences of the class of securities we own as compared with other classes of securities the portfolio has issued.
In addition, with respect to our debt investments for which no readily available market quotations are available, we will generally consider the financial condition and current and expected future cash flows of the portfolio company; the creditworthiness of the portfolio company and its ability to meet its current debt obligations; the relative seniority of our debt investment within the portfolio company’s capital structure; the availability and value of any available collateral; and changes in market interest rates and credit spreads for similar debt investments.
Historically, difficult venture capital environments have resulted in companies not receiving financing and being subsequently closed down with a loss of investment to venture investors, and other companies receiving financing but at significantly lower valuations than the preceding rounds, leading to very deep dilution for those who do not participate in the new rounds of investment. Our best estimate of this non-performance risk has been quantified and included in the valuation of our portfolio companies as of December 31, 2010.
All investments recorded at fair value are categorized based upon the level of judgment associated with the inputs used to measure their fair value. Hierarchical levels related to the amount of subjectivity associated with the inputs to fair valuation of these assets, are as follows:
|
|
·
|
Level 1: Unadjusted quoted prices in active markets for identical assets or liabilities.
|
|
|
·
|
Level 2: Quoted prices in active markets for similar assets or liabilities, or quoted prices for identical or similar assets or liabilities in markets that are not active, or inputs other than quoted prices that are observable for the asset or liability.
|
|
|
·
|
Level 3: Unobservable inputs for the asset or liability.
|
As of December 31, 2010, all of our privately held portfolio investments were classified as Level 3 in the hierarchy, indicating a high level of judgment required in their valuation.
The values assigned to our assets are based on available information and do not necessarily represent amounts that might ultimately be realized, as these amounts depend on future circumstances and cannot be reasonably determined until the individual investments are actually liquidated or become readily marketable. Upon sale of investments, the values that are ultimately realized may be different from what is presently estimated. This difference could be material.
Stock-Based Compensation
Determining the appropriate fair-value model and calculating the fair value of share-based awards on the date of grant requires judgment. Historically, we have used the Black-Scholes-Merton option pricing model to estimate the fair value of employee stock options.
Management uses the Black-Scholes-Merton option pricing model in instances where we lack historical data necessary for more complex models and when the share award terms can be valued within the model. Other models may yield fair values that are significantly different from those calculated by the Black-Scholes-Merton option pricing model.
Management uses a binomial lattice option pricing model in instances where it is necessary to include a broader array of assumptions. We used the binomial lattice model for the 10-year NQSOs granted on March 18, 2009. These awards included accelerated vesting provisions that were based on market conditions. At the date of the grant, management’s analysis concluded that triggering of the market condition acceleration clause was probable.
Option pricing models require the use of subjective input assumptions, including expected volatility, expected life, expected dividend rate, and expected risk-free rate of return. Variations in the expected volatility or expected term assumptions have a significant impact on fair value. As the volatility or expected term assumptions increase, the fair value of the stock option increases. The expected dividend rate and expected risk-free rate of return are not as significant to the calculation of fair value. A higher assumed dividend rate yields a lower fair value, whereas higher assumed interest rates yield higher fair values for stock options.
In the Black-Scholes-Merton model, we use the simplified calculation of expected term as described in the SEC’s Staff Accounting Bulletin 107 because of the lack of historical information about option exercise patterns. In the binomial lattice model, we use an expected term that assumes the options will be exercised at two-times the strike price because of the lack of option exercise patterns. Future exercise behavior could be materially different than that which is assumed by the model.
Expected volatility is based on the historical fluctuations in the Company's stock. The Company's stock has historically been volatile, which increases the fair value of the underlying share-based awards.
GAAP requires us to develop an estimate of the number of share-based awards that will be forfeited owing to employee turnover. Quarterly changes in the estimated forfeiture rate can have a significant effect on reported share-based compensation, as the effect of adjusting the rate for all expense amortization after the grant date is recognized in the period the forfeiture estimate is changed. If the actual forfeiture rate proves to be higher than the estimated forfeiture rate, then an adjustment will be made to increase the estimated forfeiture rate, which would result in a decrease to the expense recognized in the financial statements. If the actual forfeiture rate proves to be lower than the estimated forfeiture rate, then
an adjustment will be made to decrease the estimated forfeiture rate, which would result in an increase to the expense recognized in the financial statements. Such adjustments would affect our operating expenses and additional paid-in capital, but would have no effect on our net asset value.
Pension and Post-Retirement Benefit Plan Assumptions
The Company provides a Retiree Medical Benefit Plan for employees who meet certain eligibility requirements. The Company also provides an Executive Mandatory Retirement Benefit Plan for certain individuals employed by us in a bona fide executive or high policy-making position. Several statistical and other factors that attempt to anticipate future events are used in calculating the expense and liability values related to our post-retirement benefit plans. These factors include assumptions we make about the discount rate, the rate of increase in healthcare costs, and mortality, among others.
The discount rate reflects the current rate at which the post-retirement medical benefit and pension liabilities could be effectively settled considering the timing of expected payments for plan participants. In estimating this rate, we consider the Citigroup Pension Liability Index in the determination of the appropriate discount rate assumptions. The weighted average rate we utilized to measure our post retirement medical benefit obligation as of December 31, 2010, and to calculate our 2011 expense was 5.68 percent. We used a discount rate of 5.75 percent to calculate our pension obligation for the Executive Mandatory Retirement Benefit Plan.
Recent Developments — Portfolio Companies
On January 13, 2011, the Company received a warrant to purchase 86,102 shares of Series G Preferred Stock of BioVex Group, Inc., in connection with a contingent equity facility.
On January 24, 2011, BioVex Group, Inc., entered into a definitive acquisition agreement with Amgen, Inc., for the acquisition of BioVex Group, Inc. On March 4, 2011, the transaction was completed. On March 11, 2011, the Company received its upfront payment of $7,702,470, which did not include $958,296 held in escrow. On December 31, 2010, the value of our investment in BioVex was $11,430,062, which included the upfront payment and certain discounts applied to future escrow and milestone payments BioVex may be eligible to receive.
On January 26, 2011, the Company made an $813,805 follow-on investment in a privately held tiny technology portfolio company.
On February 2, 2011, NeoPhotonics Corporation priced its IPO of 7,500,000 shares of common stock at $11 per share. Our investment was converted into 400,907 shares of common stock. These shares are subject to a lock-up period of 180 days. We purchased an additional 50,000 shares of common stock in the IPO. At December 31, 2010, the value of our investment in NeoPhotonics was $4,249,615. On March 14, 2011, the closing price of NeoPhotonics' common stock was $9.88 per share on the New York Stock Exchange.
On February 22, 2011, the Company made a $750,000 investment in a senior secured non-convertible debt security of Nano-Terra, Inc., that included warrants for the purchase of 446,248 shares of Series A-2 Preferred Stock of Nano-Terra, Inc.
On February 24, 2011, the Company established a new $10 million three-year revolving credit facility with TD Bank, N.A., to be used in conjunction with its investments in venture debt. The facility, which matures on February 24, 2014, generally bears interest, at the Company’s option, based on (1) LIBOR plus 1.25 percent or (2) the higher of the federal funds rate plus fifty basis points (0.50 percent) or the U.S. prime rate as published in the Wall Street Journal.
On February 28, 2011, the Company completed a draw down of $1,250,000 from its $10 million credit facility to fund our investments in venture debt. As of March 15, 2011, we had $1,400,000 in outstanding principal in venture debt investments.
On February 28, 2011, the Company sold its 612,061 shares of Series S-2 Convertible Preferred Stock of Siluria Technologies, Inc., for an amount not materially different from the value of the shares as of December 31, 2010.
On March 1, 2011, the Company made a $150,000 follow-on investment in a subordinated secured non-convertible debt security of GEO Semiconductor, Inc., that included warrants for the purchase of 10,000 shares of Series A Preferred Stock.
On March 3, 2011, the Company made a $272,369 follow-on investment in a privately held tiny technology portfolio company.
On March 11, 2011, Solazyme, Inc., filed a registration statement on Form S-1 to register its shares of common stock for an IPO. There can be no assurance that this company will successfully complete an IPO, and a variety of factors, including stock market and general business conditions, could lead it to terminate such efforts to complete an IPO.
Item 7A. Quantitative and Qualitative Disclosures About Market Risk.
Our business activities contain elements of risk. We consider the principal types of market risk to be valuation risk, interest rate risk and foreign currency risk. Although we are risk-seeking rather than risk-averse in our investments, we consider the management of risk to be essential to our business.
Valuation Risk
Value, as defined in Section 2(a)(41) of the 1940 Act, is (i) the market price for those securities for which market quotations are readily available and (ii) fair value as determined in good faith by, or under the direction of, the Board of Directors for all other assets. (See the "Valuation Procedures" in the "Footnote to Consolidated Schedule of Investments" contained in "Item 8. Consolidated Financial Statements and Supplementary Data.")
Because there is typically no public market for our interests in the small privately held companies in which we invest, the valuation of the equity interests in that portion of our portfolio is determined in good faith by our Board of Directors with the assistance of our Valuation Committee, comprised of the independent members of our Board of Directors, in accordance with our Valuation Procedures. In the absence of a readily ascertainable market value, the determined value of our portfolio of equity interests may differ significantly from the values that would be placed on the portfolio if a ready market for the equity interests existed. Determining fair value requires that judgment be applied to the specific facts and circumstances of each
portfolio investment, although our valuation policy is intended to provide a consistent basis for determining fair value of the portfolio investments. Factors that may be considered include, but are not limited to, readily available public market quotations; the cost of the Company’s investment; transactions in the portfolio company’s securities or unconditional firm offers by responsible parties; the financial condition and operating results of the company; the long-term potential of the business and technology of the company; the values of similar securities issued by companies in similar businesses; multiples to revenues, net income or EBITDA that similar securities issued by companies in similar businesses receive; the proportion of the company’s securities we own and the nature of any rights to require the company to register restricted securities under the applicable securities laws; the achievement of milestones; and the rights and
preferences of the class of securities we own as compared with other classes of securities the portfolio has issued. In addition, with respect to our debt investments for which no readily available market quotations are available, we will generally consider the financial condition and current and expected future cash flows of the portfolio company; the creditworthiness of the portfolio company and its ability to meet its current debt obligations; the relative seniority of our debt investment within the portfolio company’s capital structure; the availability and value of any available collateral; and changes in market interest rates and credit spreads for similar debt investments. Any changes in valuation are recorded in our Consolidated Statements of Operations as "Net decrease in unrealized depreciation on investments." Changes in valuation of any of our investments in privately held companies from one period to another may be volatile.
Investments in privately held, immature companies are inherently more volatile than investments in more mature businesses. Such immature businesses are inherently fragile and easily affected by both internal and external forces. Our investee companies can lose much or all of their value suddenly in response to an internal or external adverse event. Conversely, these immature businesses can gain suddenly in value in response to an internal or external positive development.
The values assigned to our assets are based on available information and do not necessarily represent amounts that might ultimately be realized, as these amounts depend on future circumstances and cannot be reasonably determined until the individual investments are actually liquidated or become readily marketable. Upon sale of investments, the values that are ultimately realized may be different from what is presently estimated. This difference could be material.
Interest Rate Risk
Interest rate sensitivity refers to the change in earnings that may result from changes in the level of interest rates. As of December 31, 2010, our one venture debt investment, GEO Semiconductor Inc., was at a fixed rate. As of December 31, 2010, we had no debt outstanding and funded our investment in GEO Semiconductor from cash on our balance sheet. A change in interest rates would, therefore, not have a material effect on our net investment income. In the future, some of our venture debt investments may be at variable rates. Because we intend to fund a portion of our venture debt investments with borrowings, our net investment income will be affected by the difference between the rate at which we invest and the rate at which we borrow. As a
result, there can be no assurance that a significant change in market interest rates will not have a material adverse effect on our net investment income in future quarters.
We generally also invest in both short and long-term U.S. government and agency securities. To the extent that we invest in short and long-term U.S. government and agency securities, changes in interest rates result in changes in the value of these obligations that result in an increase or decrease of our net asset value. The level of interest rate risk exposure at any given point in time depends on the market environment, the expectations of future price and market movements, and the quantity and duration of long-term U.S. government and agency securities held by the Company, and it will vary from period to period. If the average interest rate on U.S. government securities at December 31, 2010, were to
increase by 25, 75 and 150 basis points, the average value of these securities held by us at December 31, 2010, would decrease by approximately $95,687, $287,060 and $574,119, respectively, and the portion of our net asset value attributable to such securities would decrease correspondingly.
In addition, market interest rates for high-yield corporate debt are an input in determining value of our investments in debt securities of privately held and publicly traded companies. Significant changes in these market rates could affect the value of our debt securities as of the date of measurement of value. Our investment income could be adversely affected should such debt securities include floating interest rates. We do not currently have any investments in debt securities with floating interest rates.
Foreign Currency Risk
Most of our investments are denominated in U.S. dollars. We currently have one investment denominated in Canadian dollars. We are exposed to foreign currency risk related to potential changes in foreign currency exchange rates. The potential loss in fair value on this investment resulting from a 10 percent adverse change in quoted foreign currency exchange rates is $387,740 at December 31, 2010.
Item 8. Consolidated Financial Statements and Supplementary Data.
HARRIS & HARRIS GROUP, INC.
INDEX TO CONSOLIDATED FINANCIAL STATEMENTS AND SCHEDULES
The following reports and consolidated financial schedules of Harris & Harris Group, Inc. are filed herewith and included in response to Item 8.
| |
|
Page
|
|
Documents
|
|
|
| |
|
|
|
Management's Report on Internal Control Over Financial Reporting
|
|
73
|
|
Report of Independent Registered Public Accounting Firm
|
|
74
|
| |
|
|
|
Consolidated Financial Statements
|
|
|
| |
|
|
|
Consolidated Statements of Assets and Liabilities as of December 31, 2010, and 2009
|
|
76
|
| |
|
|
|
Consolidated Statement of Operations for the years ended December 31, 2010, 2009, and 2008
|
|
77
|
| |
|
|
|
Consolidated Statements of Cash Flows for the years ended December 31, 2010, 2009, and 2008
|
|
78
|
| |
|
|
|
Consolidated Statements of Changes in Net Assets for the years ended December 31, 2010, 2009, and 2008
|
|
79
|
| |
|
|
|
Consolidated Schedule of Investments as of December 31, 2010
|
|
80-90
|
| |
|
|
|
Consolidated Schedule of Investments as of December 31, 2009
|
|
91-101
|
| |
|
|
|
Footnote to Consolidated Schedule of Investments
|
|
102-105
|
| |
|
|
|
Notes to Consolidated Financial Statements
|
|
106-125
|
| |
|
|
|
Financial Highlights for the years ended December 31, 2010, 2009, and 2008
|
|
126
|
Schedules other than those listed above have been omitted because they are not applicable or the required information is presented in the consolidated financial statements and/or related notes.
Management's Report on Internal Control Over Financial Reporting
Management of the Company is responsible for establishing and maintaining adequate internal control over financial reporting. Internal control over financial reporting is defined in Rules 13a-15(f) and 15d-15(f) under the Exchange Act as a process designed by, or under the supervision of, the Company's principal executive and principal financial officers and effected by the Company's Board of Directors, management and other personnel to provide reasonable assurance regarding the reliability of financial reporting and the preparation of financial statements for external purposes in accordance with generally accepted accounting principles and includes those policies and procedures that:
|
|
•
|
pertain to the maintenance of records that in reasonable detail accurately and fairly reflect the transactions and dispositions of the assets of the Company;
|
|
|
•
|
provide reasonable assurance that transactions are recorded as necessary to permit preparation of financial statements in accordance with generally accepted accounting principles, and that receipts and expenditures of the Company are being made only in accordance with authorizations of management and directors of the Company; and
|
|
|
•
|
provide reasonable assurance regarding prevention or timely detection of unauthorized acquisition, use or disposition of the Company's assets that could have a material effect on the financial statements.
|
Because of its inherent limitations, internal control over financial reporting may not prevent or detect misstatements. Also, projections of any evaluation of effectiveness of internal control over financial reporting to future periods are subject to the risk that controls may become inadequate because of changes in conditions, or that the degree of compliance with the policies or procedures may deteriorate.
Management has assessed the effectiveness of our internal control over financial reporting as of December 31, 2010. In making its assessment, management used the criteria set forth by the Committee of Sponsoring Organizations of the Treadway Commission (COSO) in Internal Control-Integrated Framework. Based on the results of this assessment, management (including our Chief Executive Officer and Chief Financial Officer) has concluded that, as of December 31, 2010, the Company's internal control over financial reporting was effective.
The effectiveness of the Company's internal control over financial reporting has been audited by PricewaterhouseCoopers LLP, an independent registered public accounting firm, as stated in its report which appears on page 74 of this Annual Report on Form 10-K.
Report of Independent Registered Public Accounting Firm
To the Board of Directors and Shareholders of Harris & Harris Group, Inc.:
In our opinion, the accompanying consolidated statements of assets and liabilities, including the consolidated schedules of investments, and the related consolidated statements of operations, changes in net assets, cash flows, and the financial highlights present fairly, in all material respects, the financial position of Harris & Harris Group, Inc. and its subsidiaries at December 31, 2010 and December 31, 2009, and the results of their operations, their cash flows, the changes in their net assets, and the financial highlights for each of the three years in the period ended December 31, 2010 in conformity with accounting principles generally accepted in the United States of America. Also in our opinion, the Company maintained, in all material respects, effective internal control
over financial reporting as of December 31, 2010 based on criteria established in Internal Control - Integrated Framework issued by the Committee of Sponsoring Organizations of the Treadway Commission (COSO). The Company's management is responsible for these financial statements and financial highlights (hereinafter referred to as "financial statements"), for maintaining effective internal control over financial reporting and for its assessment of the effectiveness of internal control over financial reporting, included in Management's Report on Internal Control over Financial Reporting appearing on page 73 of the 2010 Annual Report to Shareholders. Our responsibility is to express opinions on these financial statements and on the Company's internal control over financial reporting based on our integrated audits. We conducted our audits in accordance with the standards of the Public Company Accounting Oversight Board (United
States). Those standards require that we plan and perform the audits to obtain reasonable assurance about whether the financial statements are free of material misstatement and whether effective internal control over financial reporting was maintained in all material respects. Our audits of the financial statements included examining, on a test basis, evidence supporting the amounts and disclosures in the financial statements, assessing the accounting principles used and significant estimates made by management, and evaluating the overall financial statement presentation. Our audit of internal control over financial reporting included obtaining an understanding of internal control over financial reporting, assessing the risk that a material weakness exists, and testing and evaluating the design and operating effectiveness of internal control based on the assessed risk. Our audits also included performing such other procedures as we considered
necessary in the circumstances. We believe that our audits provide a reasonable basis for our opinions.
As more fully disclosed in Note 2 of the Notes to the Consolidated Financial Statements, the financial statements include investments valued at $106,150,422 (72% of net assets) at December 31, 2010, the fair values of which have been estimated by the Board of Directors in the absence of readily ascertainable market values. These estimated values may differ significantly from the values that would have been used had a ready market for the investments existed, and the differences could be material.
A company’s internal control over financial reporting is a process designed to provide reasonable assurance regarding the reliability of financial reporting and the preparation of financial statements for external purposes in accordance with generally accepted accounting principles. A company’s internal control over financial reporting includes those policies and procedures that (i) pertain to the maintenance of records that, in reasonable detail, accurately and fairly reflect the transactions and dispositions of the assets of the company; (ii) provide reasonable assurance that transactions are recorded as necessary to permit preparation of financial statements in accordance with generally accepted accounting principles, and that receipts and expenditures of the company are being made only
in accordance with authorizations of management and directors of the company; and (iii) provide reasonable assurance regarding prevention or timely detection of unauthorized acquisition, use, or disposition of the company’s assets that could have a material effect on the financial statements.
Because of its inherent limitations, internal control over financial reporting may not prevent or detect misstatements. Also, projections of any evaluation of effectiveness to future periods are subject to the risk that controls may become inadequate because of changes in conditions, or that the degree of compliance with the policies or procedures may deteriorate.
/s/ PricewaterhouseCoopers LLP
New York, New York
March 15, 2011
|
HARRIS & HARRIS GROUP, INC.
CONSOLIDATED STATEMENTS OF ASSETS AND LIABILITIES
|
| |
|
December 31, 2010
|
|
|
December 31, 2009
|
|
|
ASSETS
|
|
|
|
|
|
|
|
Investments, in portfolio securities at value:
|
|
|
|
|
|
|
|
Unaffiliated privately held companies
|
|
|
|
|
|
|
|
(cost: $37,480,266 and $26,977,200, respectively)
|
|
$ |
56,315,330 |
|
|
$ |
21,656,436 |
|
|
Unaffiliated publicly traded securities
|
|
|
|
|
|
|
|
|
|
(cost: $0 and $298,827, respectively)
|
|
|
0 |
|
|
|
226,395 |
|
|
Non-controlled affiliated privately held companies
|
|
|
|
|
|
|
|
|
|
(cost: $51,451,965 and $54,864,948, respectively)
|
|
|
42,775,415 |
|
|
|
50,297,220 |
|
|
Controlled affiliated privately held companies
|
|
|
|
|
|
|
|
|
|
(cost: $9,715,153 and $10,248,932, respectively)
|
|
|
7,059,677 |
|
|
|
5,843,430 |
|
|
Total, investments in private portfolio companies and public securities at value
|
|
|
|
|
|
|
|
|
|
(cost: $98,647,384 and $92,389,907, respectively)
|
|
$ |
106,150,422 |
|
|
$ |
78,023,481 |
|
|
Investments, in U.S. Treasury obligations at value
|
|
|
|
|
|
|
|
|
|
(cost: $38,273,349 and $55,960,024, respectively)
|
|
|
38,274,617 |
|
|
|
55,947,581 |
|
|
Cash
|
|
|
3,756,919 |
|
|
|
1,611,465 |
|
|
Restricted funds (Note 2)
|
|
|
2,751 |
|
|
|
2,000 |
|
|
Receivable from portfolio company
|
|
|
10,000 |
|
|
|
28,247 |
|
|
Interest receivable
|
|
|
5,924 |
|
|
|
25,832 |
|
|
Prepaid expenses
|
|
|
379,705 |
|
|
|
94,129 |
|
|
Other assets
|
|
|
708,830 |
|
|
|
376,366 |
|
|
Total assets
|
|
$ |
149,289,168 |
|
|
$ |
136,109,101 |
|
| |
|
|
|
|
|
|
|
|
|
LIABILITIES & NET ASSETS
|
|
|
|
|
|
|
|
|
| |
|
|
|
|
|
|
|
|
|
Post retirement plan liabilities (Note 7)
|
|
$ |
1,506,906 |
|
|
$ |
1,369,843 |
|
|
Accounts payable and accrued liabilities
|
|
|
589,592 |
|
|
|
579,162 |
|
|
Deferred rent
|
|
|
338,758 |
|
|
|
1,838 |
|
|
Total liabilities
|
|
|
2,435,256 |
|
|
|
1,950,843 |
|
| |
|
|
|
|
|
|
|
|
|
Net assets
|
|
$ |
146,853,912 |
|
|
$ |
134,158,258 |
|
| |
|
|
|
|
|
|
|
|
|
Net assets are comprised of:
|
|
|
|
|
|
|
|
|
|
Preferred stock, $0.10 par value, 2,000,000 shares authorized; none issued
|
|
$ |
0 |
|
|
$ |
0 |
|
|
Common stock, $0.01 par value, 45,000,000 shares authorized at 12/31/10 and 12/31/09; 32,706,904 issued at 12/31/10 and 32,688,333 issued at 12/31/09
|
|
|
327,070 |
|
|
|
326,884 |
|
|
Additional paid in capital (Note 10)
|
|
|
208,085,735 |
|
|
|
205,977,117 |
|
|
Accumulated net operating and realized loss
|
|
|
(65,657,668 |
) |
|
|
(54,361,343 |
) |
|
Accumulated unrealized appreciation (depreciation) of investments
|
|
|
7,504,306 |
|
|
|
(14,378,869 |
) |
|
Treasury stock, at cost (1,828,740 shares at 12/31/10 and 12/31/09)
|
|
|
(3,405,531 |
) |
|
|
(3,405,531 |
) |
| |
|
|
|
|
|
|
|
|
|
Net assets
|
|
$ |
146,853,912 |
|
|
$ |
134,158,258 |
|
| |
|
|
|
|
|
|
|
|
|
Shares outstanding
|
|
|
30,878,164 |
|
|
|
30,859,593 |
|
| |
|
|
|
|
|
|
|
|
|
Net asset value per outstanding share
|
|
$ |
4.76 |
|
|
$ |
4.35 |
|
The accompanying notes are an integral part of these consolidated financial statements.
|
HARRIS & HARRIS GROUP, INC.
CONSOLIDATED STATEMENTS OF OPERATIONS
|
| |
|
Year Ended
|
|
|
Year Ended
|
|
|
Year Ended
|
|
| |
|
December 31, 2010
|
|
|
December 31, 2009
|
|
|
December 31, 2008
|
|
|
Investment income:
|
|
|
|
|
|
|
|
|
|
|
Interest from:
|
|
|
|
|
|
|
|
|
|
|
Fixed-income securities and bridge notes
|
|
$ |
415,788 |
|
|
$ |
214,760 |
|
|
$ |
1,971,178 |
|
|
Miscellaneous income
|
|
|
30,250 |
|
|
|
33,088 |
|
|
|
16,169 |
|
|
Total investment income
|
|
|
446,038 |
|
|
|
247,848 |
|
|
|
1,987,347 |
|
| |
|
|
|
|
|
|
|
|
|
|
|
|
|
Expenses:
|
|
|
|
|
|
|
|
|
|
|
|
|
|
Salaries, benefits and stock-based compensation (Note 5)
|
|
|
5,287,386 |
|
|
|
6,327,467 |
|
|
|
10,090,658 |
|
|
Administration and operations
|
|
|
1,010,762 |
|
|
|
1,125,266 |
|
|
|
1,160,025 |
|
|
Professional fees
|
|
|
752,526 |
|
|
|
767,077 |
|
|
|
694,007 |
|
|
Rent (Note 2)
|
|
|
402,232 |
|
|
|
316,604 |
|
|
|
276,023 |
|
|
Directors' fees and expenses
|
|
|
345,000 |
|
|
|
338,227 |
|
|
|
367,383 |
|
|
Custody fees
|
|
|
96,000 |
|
|
|
83,457 |
|
|
|
31,607 |
|
|
Depreciation
|
|
|
51,399 |
|
|
|
50,965 |
|
|
|
54,795 |
|
|
Lease termination costs (Note 2)
|
|
|
56,540 |
|
|
|
0 |
|
|
|
0 |
|
|
Total expenses
|
|
|
8,001,845 |
|
|
|
9,009,063 |
|
|
|
12,674,498 |
|
| |
|
|
|
|
|
|
|
|
|
|
|
|
|
Net operating loss
|
|
|
(7,555,807 |
) |
|
|
(8,761,215 |
) |
|
|
(10,687,151 |
) |
| |
|
|
|
|
|
|
|
|
|
|
|
|
|
Net realized (loss) gain from investments:
|
|
|
|
|
|
|
|
|
|
|
|
|
|
Realized (loss) gain from:
|
|
|
|
|
|
|
|
|
|
|
|
|
|
Unaffiliated companies
|
|
|
13,218 |
|
|
|
(2,264,330 |
) |
|
|
3,588 |
|
|
Non-controlled affiliated companies
|
|
|
(3,584,461 |
) |
|
|
(8,841,675 |
) |
|
|
(6,509,404 |
) |
|
Publicly traded companies
|
|
|
(152,980 |
) |
|
|
0 |
|
|
|
0 |
|
|
Controlled affiliated companies
|
|
|
0 |
|
|
|
0 |
|
|
|
(2,893,487 |
) |
|
U.S. Treasury obligations/other
|
|
|
(11,834 |
) |
|
|
(325 |
) |
|
|
1,109,790 |
|
|
Realized loss from investments
|
|
|
(3,736,057 |
) |
|
|
(11,106,330 |
) |
|
|
(8,289,513 |
) |
| |
|
|
|
|
|
|
|
|
|
|
|
|
|
Income tax expense (benefit) (Note 8)
|
|
|
4,461 |
|
|
|
(753 |
) |
|
|
34,121 |
|
|
Net realized loss from investments
|
|
|
(3,740,518 |
) |
|
|
(11,105,577 |
) |
|
|
(8,323,634 |
) |
| |
|
|
|
|
|
|
|
|
|
|
|
|
|
Net decrease (increase) in unrealized depreciation on investments:
|
|
|
|
|
|
|
|
|
|
|
|
|
|
Change as a result of investment sales
|
|
|
3,608,205 |
|
|
|
11,090,579 |
|
|
|
8,292,072 |
|
|
Change on investments held
|
|
|
18,274,970 |
|
|
|
8,627,748 |
|
|
|
(38,462,784 |
) |
|
Net decrease (increase) in unrealized depreciation on investments
|
|
|
21,883,175 |
|
|
|
19,718,327 |
|
|
|
(30,170,712 |
) |
| |
|
|
|
|
|
|
|
|
|
|
|
|
|
Net increase (decrease) in net assets resulting from operations
|
|
$ |
10,586,850 |
|
|
$ |
(148,465 |
) |
|
$ |
(49,181,497 |
) |
| |
|
|
|
|
|
|
|
|
|
|
|
|
|
Per average basic and diluted outstanding share
|
|
$ |
0.34 |
|
|
$ |
(0.01 |
) |
|
$ |
(1.99 |
) |
| |
|
|
|
|
|
|
|
|
|
|
|
|
|
Average outstanding shares
|
|
|
30,866,239 |
|
|
|
27,025,995 |
|
|
|
24,670,516 |
|
The accompanying notes are an integral part of these consolidated financial statements.
|
HARRIS & HARRIS GROUP, INC.
CONSOLIDATED STATEMENTS OF CASH FLOWS
|
| |
|
Year Ended
|
|
|
Year Ended
|
|
|
Year Ended
|
|
| |
|
December 31, 2010
|
|
|
December 31, 2009
|
|
|
December 31, 2008
|
|
| |
|
|
|
|
|
|
|
|
|
|
Cash flows (used in) provided by operating activities:
|
|
|
|
|
|
|
|
|
|
|
Net increase (decrease) in net assets resulting from operations
|
|
$ |
10,586,850 |
|
|
$ |
(148,465 |
) |
|
$ |
(49,181,497 |
) |
|
Adjustments to reconcile net increase (decrease) in net assets resulting from operations to net cash used in operating activities:
|
|
|
|
|
|
|
|
|
|
|
|
|
|
Net realized and unrealized (gain) loss on investments
|
|
|
(18,147,118 |
) |
|
|
(8,611,997 |
) |
|
|
38,460,225 |
|
|
Depreciation of fixed assets, amortization of premium or discount on U.S. government securities, and bridge note interest
|
|
|
(341,861 |
) |
|
|
12,363 |
|
|
|
(179,809 |
) |
|
Stock-based compensation expense
|
|
|
2,088,091 |
|
|
|
3,089,520 |
|
|
|
5,965,769 |
|
| |
|
|
|
|
|
|
|
|
|
|
|
|
|
Changes in assets and liabilities:
|
|
|
|
|
|
|
|
|
|
|
|
|
|
Restricted funds
|
|
|
(751 |
) |
|
|
189,955 |
|
|
|
2,475,065 |
|
|
Receivable from portfolio company
|
|
|
18,247 |
|
|
|
(28,247 |
) |
|
|
524 |
|
|
Interest receivable
|
|
|
(2,883 |
) |
|
|
35,365 |
|
|
|
621,856 |
|
|
Prepaid expenses
|
|
|
(285,576 |
) |
|
|
390,438 |
|
|
|
4,100 |
|
|
Other receivables
|
|
|
7,187 |
|
|
|
(7,454 |
) |
|
|
0 |
|
|
Return of security deposits on leased properties
|
|
|
44,376 |
|
|
|
0 |
|
|
|
0 |
|
|
Other assets
|
|
|
(294,766 |
) |
|
|
(52,965 |
) |
|
|
88,936 |
|
|
Post retirement plan liabilities
|
|
|
137,063 |
|
|
|
(29,205 |
) |
|
|
102,210 |
|
|
Accounts payable and accrued liabilities
|
|
|
10,430 |
|
|
|
(110,138 |
) |
|
|
(2,529,325 |
) |
|
Deferred rent
|
|
|
336,920 |
|
|
|
(6,302 |
) |
|
|
(6,385 |
) |
| |
|
|
|
|
|
|
|
|
|
|
|
|
|
Net cash used in operating activities
|
|
|
(5,843,791 |
) |
|
|
(5,277,132 |
) |
|
|
(4,178,331 |
) |
| |
|
|
|
|
|
|
|
|
|
|
|
|
|
Cash flows from investing activities:
|
|
|
|
|
|
|
|
|
|
|
|
|
|
Purchase of U.S. government securities
|
|
|
(62,244,735 |
) |
|
|
(208,875,156 |
) |
|
|
(133,032,933 |
) |
|
Sale of U.S. government securities
|
|
|
79,944,879 |
|
|
|
205,769,329 |
|
|
|
140,831,769 |
|
|
Investment in affiliated portfolio companies
|
|
|
(6,382,357 |
) |
|
|
(10,181,931 |
) |
|
|
(16,509,963 |
) |
|
Investment in unaffiliated portfolio companies
|
|
|
(3,668,364 |
) |
|
|
(2,152,120 |
) |
|
|
(1,269,499 |
) |
|
Proceeds from sale of investments and conversion of bridge notes
|
|
|
408,899 |
|
|
|
7,365 |
|
|
|
136,837 |
|
|
Purchase of fixed assets
|
|
|
(89,790 |
) |
|
|
(1,313 |
) |
|
|
(21,969 |
) |
| |
|
|
|
|
|
|
|
|
|
|
|
|
|
Net cash provided by (used in) investing activities
|
|
|
7,968,532 |
|
|
|
(15,433,826 |
) |
|
|
(9,865,758 |
) |
| |
|
|
|
|
|
|
|
|
|
|
|
|
|
Cash flows from financing activities:
|
|
|
|
|
|
|
|
|
|
|
|
|
|
Gross proceeds from public offering (Note 10)
|
|
|
0 |
|
|
|
23,215,625 |
|
|
|
15,651,750 |
|
|
Payment of offering costs (Note 10)
|
|
|
(48,928 |
) |
|
|
(1,951,485 |
) |
|
|
(1,268,253 |
) |
|
Proceeds from stock option exercises (Note 5)
|
|
|
69,641 |
|
|
|
421,950 |
|
|
|
0 |
|
| |
|
|
|
|
|
|
|
|
|
|
|
|
|
Net cash provided by financing activities
|
|
|
20,713 |
|
|
|
21,686,090 |
|
|
|
14,383,497 |
|
| |
|
|
|
|
|
|
|
|
|
|
|
|
|
Net increase in cash:
|
|
|
|
|
|
|
|
|
|
|
|
|
|
Cash at beginning of the year
|
|
|
1,611,465 |
|
|
|
636,333 |
|
|
|
296,925 |
|
|
Cash at end of the year
|
|
|
3,756,919 |
|
|
|
1,611,465 |
|
|
|
636,333 |
|
| |
|
|
|
|
|
|
|
|
|
|
|
|
|
Net increase in cash
|
|
$ |
2,145,454 |
|
|
$ |
975,132 |
|
|
$ |
339,408 |
|
| |
|
|
|
|
|
|
|
|
|
|
|
|
|
Supplemental disclosures of cash flow information:
|
|
|
|
|
|
|
|
|
|
|
|
|
|
Income taxes paid
|
|
$ |
4,461 |
|
|
$ |
2,179 |
|
|
$ |
45,765 |
|
The accompanying notes are an integral part of these consolidated financial statements.
|
HARRIS & HARRIS GROUP, INC.
CONSOLIDATED STATEMENTS OF CHANGES IN NET ASSETS
|
| |
|
Year Ended
|
|
|
Year Ended
|
|
|
Year Ended
|
|
| |
|
December 31, 2010
|
|
|
December 31, 2009
|
|
|
December 31, 2008
|
|
| |
|
|
|
|
|
|
|
|
|
|
Changes in net assets from operations:
|
|
|
|
|
|
|
|
|
|
| |
|
|
|
|
|
|
|
|
|
|
Net operating loss
|
|
$ |
(7,555,807 |
) |
|
$ |
(8,761,215 |
) |
|
$ |
(10,687,151 |
) |
|
Net realized loss on investments
|
|
|
(3,740,518 |
) |
|
|
(11,105,577 |
) |
|
|
(8,323,634 |
) |
|
Net decrease in unrealized depreciation on investments as a result of sales
|
|
|
3,608,205 |
|
|
|
11,090,579 |
|
|
|
8,292,072 |
|
|
Net decrease (increase) in unrealized depreciation on investments held
|
|
|
18,274,970 |
|
|
|
8,627,748 |
|
|
|
(38,462,784 |
) |
| |
|
|
|
|
|
|
|
|
|
|
|
|
|
Net increase (decrease) in net assets resulting from operations
|
|
|
10,586,850 |
|
|
|
(148,465 |
) |
|
|
(49,181,497 |
) |
| |
|
|
|
|
|
|
|
|
|
|
|
|
|
Changes in net assets from capital stock transactions:
|
|
|
|
|
|
|
|
|
|
|
|
|
| |
|
|
|
|
|
|
|
|
|
|
|
|
|
Issuance of common stock upon the exercise of stock options
|
|
|
186 |
|
|
|
1,125 |
|
|
|
0 |
|
|
Issuance of common stock on offering
|
|
|
0 |
|
|
|
48,875 |
|
|
|
25,450 |
|
|
Additional paid in capital on common stock issued net of offering expenses
|
|
|
20,527 |
|
|
|
21,636,090 |
|
|
|
14,358,047 |
|
|
Stock-based compensation expense
|
|
|
2,088,091 |
|
|
|
3,089,520 |
|
|
|
5,965,769 |
|
| |
|
|
|
|
|
|
|
|
|
|
|
|
|
Net increase in net assets resulting from capital stock transactions
|
|
|
2,108,804 |
|
|
|
24,775,610 |
|
|
|
20,349,266 |
|
| |
|
|
|
|
|
|
|
|
|
|
|
|
|
Net increase (decrease) in net assets
|
|
|
12,695,654 |
|
|
|
24,627,145 |
|
|
|
(28,832,231 |
) |
| |
|
|
|
|
|
|
|
|
|
|
|
|
|
Net Assets:
|
|
|
|
|
|
|
|
|
|
|
|
|
| |
|
|
|
|
|
|
|
|
|
|
|
|
|
Beginning of the year
|
|
|
134,158,258 |
|
|
|
109,531,113 |
|
|
|
138,363,344 |
|
| |
|
|
|
|
|
|
|
|
|
|
|
|
|
End of the year
|
|
$ |
146,853,912 |
|
|
$ |
134,158,258 |
|
|
$ |
109,531,113 |
|
The accompanying notes are an integral part of these consolidated financial statements.
|
HARRIS & HARRIS GROUP, INC.
CONSOLIDATED SCHEDULE OF INVESTMENTS AS OF DECEMBER 31, 2010
|
| |
|
Method of
|
|
|
|
Shares/
|
|
|
|
|
| |
|
Valuation (1)
|
|
Industry (2)
|
|
Principal
|
|
|
Value
|
|
| |
|
|
|
|
|
|
|
|
|
|
|
|
Investments in Unaffiliated Companies (3)(4) – 38.3% of net assets at value
|
|
|
|
|
|
|
|
|
|
|
|
| |
|
|
|
|
|
|
|
|
|
|
|
|
Private Placement Portfolio (Illiquid) – 38.3% of net assets at value
|
|
|
|
|
|
|
|
|
|
|
|
| |
|
|
|
|
|
|
|
|
|
|
|
|
BioVex Group, Inc. (5)(6)(7)(8) — Developing novel
|
|
|
|
|
Healthcare/
|
|
|
|
|
|
|
|
biologics for treatment of cancer and infectious disease
|
|
|
|
|
Biotech
|
|
|
|
|
|
|
|
Series E Convertible Preferred Stock
|
|
(M)
|
|
|
|
|
2,799,552 |
|
|
$ |
5,839,158 |
|
|
Series G Convertible Preferred Stock
|
|
(M)
|
|
|
|
|
6,964,034 |
|
|
|
5,431,430 |
|
|
Warrants for Series G Convertible Preferred
|
|
|
|
|
|
|
|
|
|
|
|
|
|
|
Stock expiring 11/5/16
|
|
(M)
|
|
|
|
|
285,427 |
|
|
|
159,474 |
|
| |
|
|
|
|
|
|
|
|
|
|
|
11,430,062 |
|
| |
|
|
|
|
|
|
|
|
|
|
|
|
|
|
Bridgelux, Inc. (5)(6) — Manufacturing high-power light
|
|
|
|
|
Cleantech
|
|
|
|
|
|
|
|
|
|
emitting diodes (LEDs) and arrays
|
|
|
|
|
|
|
|
|
|
|
|
|
|
|
Series B Convertible Preferred Stock
|
|
(M)
|
|
|
|
|
1,861,504 |
|
|
|
1,759,121 |
|
|
Series C Convertible Preferred Stock
|
|
(M)
|
|
|
|
|
2,130,699 |
|
|
|
2,013,510 |
|
|
Series D Convertible Preferred Stock
|
|
(M)
|
|
|
|
|
999,999 |
|
|
|
945,000 |
|
|
Warrants for Series C Convertible Preferred Stock expiring 12/31/14
|
|
( I )
|
|
|
|
|
163,900 |
|
|
|
86,867 |
|
|
Warrants for Series D Convertible Preferred Stock expiring 8/26/14
|
|
( I )
|
|
|
|
|
166,665 |
|
|
|
58,500 |
|
| |
|
|
|
|
|
|
|
|
|
|
|
4,862,998 |
|
| |
|
|
|
|
|
|
|
|
|
|
|
|
|
|
Cobalt Technologies, Inc. (5)(6)(7)(9) — Developing processes for
|
|
|
|
|
Cleantech
|
|
|
|
|
|
|
|
|
|
making biobutanol through biomass fermentation
|
|
|
|
|
|
|
|
|
|
|
|
|
|
|
Series C Convertible Preferred Stock
|
|
(M)
|
|
|
|
|
352,112 |
|
|
|
375,000 |
|
| |
|
|
|
|
|
|
|
|
|
|
|
|
|
|
Ensemble Therapeutics Corporation (5)(6)(10) — Developing DNA-
|
|
|
|
|
Healthcare/
|
|
|
|
|
|
|
|
|
|
Programmed ChemistryTM for the discovery of new classes of
|
|
|
|
|
Biotech
|
|
|
|
|
|
|
|
|
|
therapeutics
|
|
|
|
|
|
|
|
|
|
|
|
|
|
|
Series B Convertible Preferred Stock
|
|
(M)
|
|
|
|
|
1,449,275 |
|
|
|
2,000,000 |
|
|
Unsecured Convertible Bridge Notes (including interest)
|
|
(M)
|
|
|
|
$ |
299,169 |
|
|
|
349,505 |
|
| |
|
|
|
|
|
|
|
|
|
|
|
2,349,505 |
|
| |
|
|
|
|
|
|
|
|
|
|
|
|
|
|
GEO Semiconductor Inc. (7)(11) — Developing programmable,
|
|
|
|
|
Electronics/
|
|
|
|
|
|
|
|
|
|
high-performance video and geometry processing solutions
|
|
|
|
|
Semi-
|
|
|
|
|
|
|
|
|
|
Participation Agreement with Montage Capital relating
|
|
|
|
|
conductors
|
|
|
|
|
|
|
|
|
|
to the following assets:
|
|
|
|
|
|
|
|
|
|
|
|
|
|
|
Senior Secured Debt, 13.75%, maturing on 06/30/12
|
|
( I )
|
|
|
|
$ |
500,000 |
|
|
|
424,920 |
|
|
Warrants for Series A Preferred Stock expiring on 09/17/17
|
|
( I )
|
|
|
|
|
100,000 |
|
|
|
46,500 |
|
| |
|
|
|
|
|
|
|
|
|
|
|
471,420 |
|
The accompanying notes are an integral part of these consolidated financial statements.
|
HARRIS & HARRIS GROUP, INC.
CONSOLIDATED SCHEDULE OF INVESTMENTS AS OF DECEMBER 31, 2010
|
| |
|
Method of
|
|
|
|
Shares/
|
|
|
|
|
| |
|
Valuation (1)
|
|
Industry (2)
|
|
Principal
|
|
|
Value
|
|
| |
|
|
|
|
|
|
|
|
|
|
|
|
Investments in Unaffiliated Companies (3)(4) – 38.3% of net assets at value (Cont.)
|
|
|
|
|
|
|
|
|
|
|
|
| |
|
|
|
|
|
|
|
|
|
|
|
|
Private Placement Portfolio (Illiquid) – 38.3% of net assets at value (Cont.)
|
|
|
|
|
|
|
|
|
|
|
|
| |
|
|
|
|
|
|
|
|
|
|
|
|
Molecular Imprints, Inc. (5)(6) — Manufacturing nanoimprint
|
|
|
|
|
Semi-
|
|
|
|
|
|
|
|
lithography capital equipment
|
|
|
|
|
conductors
|
|
|
|
|
|
|
|
Series B Convertible Preferred Stock
|
|
(M)
|
|
|
|
|
1,333,333 |
|
|
$ |
1,861,111 |
|
|
Series C Convertible Preferred Stock
|
|
(M)
|
|
|
|
|
1,250,000 |
|
|
|
2,013,889 |
|
|
Warrants for Series C Convertible Preferred Stock expiring 12/31/11
|
|
( I )
|
|
|
|
|
125,000 |
|
|
|
69,375 |
|
| |
|
|
|
|
|
|
|
|
|
|
|
3,944,375 |
|
| |
|
|
|
|
|
|
|
|
|
|
|
|
|
|
Nanosys, Inc. (5)(6) — Developing inorganic nanowires and
|
|
|
|
|
Cleantech
|
|
|
|
|
|
|
|
|
|
quantum dots for use in batteries and LED-backlit devices
|
|
|
|
|
|
|
|
|
|
|
|
|
|
|
Series C Convertible Preferred Stock
|
|
(M)
|
|
|
|
|
803,428 |
|
|
|
916,225 |
|
|
Series D Convertible Preferred Stock
|
|
(M)
|
|
|
|
|
1,016,950 |
|
|
|
1,239,680 |
|
|
Series E Convertible Preferred Stock
|
|
(M)
|
|
|
|
|
433,688 |
|
|
|
745,076 |
|
| |
|
|
|
|
|
|
|
|
|
|
|
2,900,981 |
|
| |
|
|
|
|
|
|
|
|
|
|
|
|
|
| |
|
|
|
|
Electronics/
|
|
|
|
|
|
|
|
|
|
Nantero, Inc. (5)(6)(7) — Developing a high-density, nonvolatile,
|
|
|
|
|
Semi-
|
|
|
|
|
|
|
|
|
|
random access memory chip, enabled by carbon nanotubes
|
|
|
|
|
conductors
|
|
|
|
|
|
|
|
|
|
Series A Convertible Preferred Stock
|
|
(M)
|
|
|
|
|
345,070 |
|
|
|
1,046,908 |
|
|
Series B Convertible Preferred Stock
|
|
(M)
|
|
|
|
|
207,051 |
|
|
|
628,172 |
|
|
Series C Convertible Preferred Stock
|
|
(M)
|
|
|
|
|
188,315 |
|
|
|
571,329 |
|
| |
|
|
|
|
|
|
|
|
|
|
|
2,246,409 |
|
| |
|
|
|
|
|
|
|
|
|
|
|
|
|
|
NeoPhotonics Corporation (5)(6)(12) — Developing and manufacturing
|
|
|
|
|
Other
|
|
|
|
|
|
|
|
|
|
optical devices and components
|
|
|
|
|
|
|
|
|
|
|
|
|
|
|
Common Stock
|
|
(M)
|
|
|
|
|
45,214 |
|
|
|
479,269 |
|
|
Series 1 Convertible Preferred Stock
|
|
(M)
|
|
|
|
|
73,250 |
|
|
|
776,450 |
|
|
Series 2 Convertible Preferred Stock
|
|
(M)
|
|
|
|
|
29,675 |
|
|
|
314,555 |
|
|
Series 3 Convertible Preferred Stock
|
|
(M)
|
|
|
|
|
110,000 |
|
|
|
1,166,000 |
|
|
Series X Convertible Preferred Stock
|
|
(M)
|
|
|
|
|
142,768 |
|
|
|
1,513,341 |
|
| |
|
|
|
|
|
|
|
|
|
|
|
4,249,615 |
|
| |
|
|
|
|
|
|
|
|
|
|
|
|
|
|
Polatis, Inc. (5)(6)(7) — Developing MEMS-based optical
|
|
|
|
|
Other
|
|
|
|
|
|
|
|
|
|
networking components
|
|
|
|
|
|
|
|
|
|
|
|
|
|
|
Common Stock
|
|
(M)
|
|
|
|
|
16,438 |
|
|
|
0 |
|
|
Series A-1 Convertible Preferred Stock
|
|
(M)
|
|
|
|
|
16,775 |
|
|
|
0 |
|
|
Series A-2 Convertible Preferred Stock
|
|
(M)
|
|
|
|
|
71,611 |
|
|
|
0 |
|
|
Series A-4 Convertible Preferred Stock
|
|
(M)
|
|
|
|
|
4,774 |
|
|
|
0 |
|
| |
|
|
|
|
|
|
|
|
|
|
|
0 |
|
The accompanying notes are an integral part of these consolidated financial statements.
|
HARRIS & HARRIS GROUP, INC.
CONSOLIDATED SCHEDULE OF INVESTMENTS AS OF DECEMBER 31, 2010
|
| |
|
Method of
|
|
|
|
Shares/
|
|
|
|
|
| |
|
Valuation (1)
|
|
Industry (2)
|
|
Principal
|
|
|
Value
|
|
| |
|
|
|
|
|
|
|
|
|
|
|
|
Investments in Unaffiliated Companies (3)(4) – 38.3% of net assets at value (Cont.)
|
|
|
|
|
|
|
|
|
|
|
|
| |
|
|
|
|
|
|
|
|
|
|
|
|
Private Placement Portfolio (Illiquid) – 38.3% of net assets at value (Cont.)
|
|
|
|
|
|
|
|
|
|
|
|
| |
|
|
|
|
|
|
|
|
|
|
|
|
PolyRemedy, Inc. (5)(6)(7) — Developing a platform for
|
|
|
|
|
Healthcare/
|
|
|
|
|
|
|
|
producing and tracking the use of wound treatment patches
|
|
|
|
|
Biotech
|
|
|
|
|
|
|
|
Series B-1 Convertible Preferred Stock
|
|
(M)
|
|
|
|
|
287,647 |
|
|
$ |
23,466 |
|
|
Series B-2 Convertible Preferred Stock
|
|
(M)
|
|
|
|
|
676,147 |
|
|
|
30,427 |
|
| |
|
|
|
|
|
|
|
|
|
|
|
53,893 |
|
| |
|
|
|
|
|
|
|
|
|
|
|
|
|
|
Siluria Technologies, Inc. (5)(6)(7)(13) — Developing nanomaterials
|
|
|
|
|
Cleantech
|
|
|
|
|
|
|
|
|
|
for manufacturing of chemicals
|
|
|
|
|
|
|
|
|
|
|
|
|
|
|
Series S-2 Convertible Preferred Stock
|
|
(M)
|
|
|
|
|
612,061 |
|
|
|
204,000 |
|
| |
|
|
|
|
|
|
|
|
|
|
|
|
|
|
Solazyme, Inc. (5)(6)(7) — Developing algal biodiesel, industrial
|
|
|
|
|
Cleantech
|
|
|
|
|
|
|
|
|
|
chemicals and specialty ingredients using synthetic biology
|
|
|
|
|
|
|
|
|
|
|
|
|
|
|
Series A Convertible Preferred Stock
|
|
(M)
|
|
|
|
|
988,204 |
|
|
|
9,961,096 |
|
|
Series B Convertible Preferred Stock
|
|
(M)
|
|
|
|
|
495,246 |
|
|
|
4,992,080 |
|
|
Series C Convertible Preferred Stock
|
|
(M)
|
|
|
|
|
651,309 |
|
|
|
6,565,195 |
|
|
Series D Convertible Preferred Stock
|
|
(M)
|
|
|
|
|
169,390 |
|
|
|
1,707,451 |
|
| |
|
|
|
|
|
|
|
|
|
|
|
23,225,822 |
|
| |
|
|
|
|
|
|
|
|
|
|
|
|
|
|
TetraVitae Bioscience, Inc. (5)(6)(7)(14) — Developing methods
|
|
|
|
|
Cleantech
|
|
|
|
|
|
|
|
|
|
of producing alternative chemicals and fuels through biomass
|
|
|
|
|
|
|
|
|
|
|
|
|
|
|
fermentation
|
|
|
|
|
|
|
|
|
|
|
|
|
|
|
Common Stock
|
|
(M)
|
|
|
|
|
118,804 |
|
|
|
0 |
|
| |
|
|
|
|
|
|
|
|
|
|
|
|
|
|
Ultora, Inc. (5)(6)(7)(11) — Developing energy-storage devices
|
|
|
|
|
Cleantech
|
|
|
|
|
|
|
|
|
|
enabled by carbon nanotubes
|
|
|
|
|
|
|
|
|
|
|
|
|
|
|
Secured Convertible Bridge Note (including interest)
|
|
(M)
|
|
|
|
$ |
1,250 |
|
|
|
1,250 |
|
| |
|
|
|
|
|
|
|
|
|
|
|
|
|
|
Total Unaffiliated Private Placement Portfolio (cost: $37,480,266)
|
|
|
|
|
|
|
|
|
|
|
$ |
56,315,330 |
|
| |
|
|
|
|
|
|
|
|
|
|
|
|
|
|
Total Investments in Unaffiliated Companies (cost: $37,480,266)
|
|
|
|
|
|
|
|
|
|
|
$ |
56,315,330 |
|
The accompanying notes are an integral part of these consolidated financial statements.
|
HARRIS & HARRIS GROUP, INC.
CONSOLIDATED SCHEDULE OF INVESTMENTS AS OF DECEMBER 31, 2010
|
| |
|
Method of
|
|
|
|
Shares/ |
|
|
|
|
| |
|
Valuation (1)
|
|
Industry (2)
|
|
Principal
|
|
|
Value
|
|
| |
|
|
|
|
|
|
|
|
|
|
|
|
Investments in Non-Controlled Affiliated Companies (3)(15) – 29.1% of net assets at value
|
|
|
|
|
|
|
|
|
|
|
|
| |
|
|
|
|
|
|
|
|
|
|
|
|
Private Placement Portfolio (Illiquid) – 29.1% of net assets at value
|
|
|
|
|
|
|
|
|
|
|
|
| |
|
|
|
|
|
|
|
|
|
|
|
|
ABS Materials, Inc. (5)(7)(11) — Developing nano-structured
|
|
|
|
|
Cleantech
|
|
|
|
|
|
|
|
absorbent materials for environmental remediation and for the
|
|
|
|
|
|
|
|
|
|
|
|
|
petroleum industry
|
|
|
|
|
|
|
|
|
|
|
|
|
Series A Convertible Preferred Stock
|
|
(M)
|
|
|
|
|
375,000 |
|
|
$ |
375,000 |
|
| |
|
|
|
|
|
|
|
|
|
|
|
|
|
| |
|
|
|
|
Electronics/
|
|
|
|
|
|
|
|
|
|
Adesto Technologies Corporation (5)(6)(7) — Developing low-power,
|
|
|
|
|
Semi-
|
|
|
|
|
|
|
|
|
|
high-performance memory devices
|
|
|
|
|
conductors
|
|
|
|
|
|
|
|
|
|
Series A Convertible Preferred Stock
|
|
(M)
|
|
|
|
|
6,547,619 |
|
|
|
2,420,000 |
|
|
Series B Convertible Preferred Stock
|
|
(M)
|
|
|
|
|
5,952,381 |
|
|
|
2,200,000 |
|
| |
|
|
|
|
|
|
|
|
|
|
|
4,620,000 |
|
| |
|
|
|
|
|
|
|
|
|
|
|
|
|
| |
|
|
|
|
Electronics/
|
|
|
|
|
|
|
|
|
|
Cambrios Technologies Corporation (5)(6)(7) – Developing
|
|
|
|
|
Semi-
|
|
|
|
|
|
|
|
|
|
nanowire-enabled electronic materials for the display industry
|
|
|
|
|
conductors
|
|
|
|
|
|
|
|
|
|
Series B Convertible Preferred Stock
|
|
(M)
|
|
|
|
|
1,294,025 |
|
|
|
323,506 |
|
|
Series C Convertible Preferred Stock
|
|
(M)
|
|
|
|
|
1,300,000 |
|
|
|
586,690 |
|
|
Series D Convertible Preferred Stock
|
|
(M)
|
|
|
|
|
515,756 |
|
|
|
644,695 |
|
|
Unsecured Convertible Bridge Note (including interest)
|
|
(M)
|
|
|
|
$ |
92,400 |
|
|
|
93,332 |
|
| |
|
|
|
|
|
|
|
|
|
|
|
1,648,223 |
|
| |
|
|
|
|
|
|
|
|
|
|
|
|
|
|
Contour Energy Systems, Inc. (5)(6)(7)(16) — Developing batteries using
|
|
|
|
|
Cleantech
|
|
|
|
|
|
|
|
|
|
nanostructured materials
|
|
|
|
|
|
|
|
|
|
|
|
|
|
|
Series A Convertible Preferred Stock
|
|
(M)
|
|
|
|
|
2,565,798 |
|
|
|
2,822,378 |
|
|
Series B Convertible Preferred Stock
|
|
(M)
|
|
|
|
|
812,500 |
|
|
|
1,300,000 |
|
| |
|
|
|
|
|
|
|
|
|
|
|
4,122,378 |
|
| |
|
|
|
|
|
|
|
|
|
|
|
|
|
|
Crystal IS, Inc. (5)(6) — Developing single-crystal
|
|
|
|
|
Cleantech
|
|
|
|
|
|
|
|
|
|
aluminum nitride substrates for light-emitting diodes
|
|
|
|
|
|
|
|
|
|
|
|
|
|
|
Common Stock
|
|
(M)
|
|
|
|
|
3,994,468 |
|
|
|
0 |
|
|
Warrants for Series A-1 Preferred Stock expiring 05/05/13
|
|
( I )
|
|
|
|
|
15,231 |
|
|
|
0 |
|
|
Warrants for Series A-1 Preferred Stock expiring 05/12/13
|
|
( I )
|
|
|
|
|
2,350 |
|
|
|
0 |
|
|
Warrants for Series A-1 Preferred Stock expiring 08/08/13
|
|
( I )
|
|
|
|
|
4,396 |
|
|
|
0 |
|
| |
|
|
|
|
|
|
|
|
|
|
|
0 |
|
The accompanying notes are an integral part of these consolidated financial statements.
|
HARRIS & HARRIS GROUP, INC.
CONSOLIDATED SCHEDULE OF INVESTMENTS AS OF DECEMBER 31, 2010
|
| |
|
Method of
|
|
|
|
Shares/ |
|
|
|
|
| |
|
Valuation (1)
|
|
Industry (2)
|
|
Principal
|
|
|
Value
|
|
| |
|
|
|
|
|
|
|
|
|
|
|
|
Investments in Non-Controlled Affiliated Companies (3)(15) – 29.1% of net assets at value (Cont.)
|
|
|
|
|
|
|
|
|
|
|
|
| |
|
|
|
|
|
|
|
|
|
|
|
|
Private Placement Portfolio (Illiquid) – 29.1% of net assets at value (Cont.)
|
|
|
|
|
|
|
|
|
|
|
|
| |
|
|
|
|
|
|
|
|
|
|
|
| |
|
|
|
|
Electronics/
|
|
|
|
|
|
|
|
D-Wave Systems, Inc. (5)(6)(7)(17) — Developing high-
|
|
|
|
|
Semi-
|
|
|
|
|
|
|
|
performance quantum computing systems
|
|
|
|
|
conductors
|
|
|
|
|
|
|
|
Series B Convertible Preferred Stock
|
|
(M)
|
|
|
|
|
1,144,869 |
|
|
$ |
1,343,504 |
|
|
Series C Convertible Preferred Stock
|
|
(M)
|
|
|
|
|
450,450 |
|
|
|
528,603 |
|
|
Series D Convertible Preferred Stock
|
|
(M)
|
|
|
|
|
1,533,395 |
|
|
|
1,799,439 |
|
|
Series E Convertible Preferred Stock
|
|
(M)
|
|
|
|
|
269,280 |
|
|
|
316,000 |
|
|
Series F Convertible Preferred Stock
|
|
(M)
|
|
|
|
|
258,721 |
|
|
|
303,609 |
|
|
Warrants for Common Stock expiring 06/30/15
|
|
( I )
|
|
|
|
|
153,890 |
|
|
|
74,329 |
|
| |
|
|
|
|
|
|
|
|
|
|
|
4,365,484 |
|
| |
|
|
|
|
|
|
|
|
|
|
|
|
|
|
Enumeral Biomedical Corporation (5)(6)(7)(18) — Developing therapeutics
|
|
|
|
|
Healthcare/
|
|
|
|
|
|
|
|
|
|
and diagnostics through functional assaying of single cells
|
|
|
|
|
Biotech
|
|
|
|
|
|
|
|
|
|
Unsecured Convertible Bridge Note (including interest)
|
|
(M)
|
|
|
|
$ |
250,000 |
|
|
|
270,493 |
|
| |
|
|
|
|
|
|
|
|
|
|
|
|
|
|
Innovalight, Inc. (5)(6)(7) — Developing silicon-based
|
|
|
|
|
Cleantech
|
|
|
|
|
|
|
|
|
|
nanomaterials for use in the solar energy industry
|
|
|
|
|
|
|
|
|
|
|
|
|
|
|
Series B Convertible Preferred Stock
|
|
(M)
|
|
|
|
|
16,666,666 |
|
|
|
1,315,001 |
|
|
Series C Convertible Preferred Stock
|
|
(M)
|
|
|
|
|
5,810,577 |
|
|
|
1,734,521 |
|
|
Series D Convertible Preferred Stock
|
|
(M)
|
|
|
|
|
4,046,974 |
|
|
|
676,027 |
|
| |
|
|
|
|
|
|
|
|
|
|
|
3,725,549 |
|
| |
|
|
|
|
|
|
|
|
|
|
|
|
|
| |
|
|
|
|
Electronics/
|
|
|
|
|
|
|
|
|
|
Kovio, Inc. (5)(6) — Developing semiconductor products
|
|
|
|
|
Semi-
|
|
|
|
|
|
|
|
|
|
using printed electronics and thin-film technologies
|
|
|
|
|
conductors
|
|
|
|
|
|
|
|
|
|
Series A' Convertible Preferred Stock
|
|
(M)
|
|
|
|
|
2,160,000 |
|
|
|
540,000 |
|
|
Series A3X' Convertible Preferred Stock
|
|
(M)
|
|
|
|
|
526,225 |
|
|
|
803,113 |
|
| |
|
|
|
|
|
|
|
|
|
|
|
1,343,113 |
|
| |
|
|
|
|
|
|
|
|
|
|
|
|
|
|
Mersana Therapeutics, Inc. (5)(6)(7)(19) — Developing treatments for
|
|
|
|
|
Healthcare/
|
|
|
|
|
|
|
|
|
|
cancer based on novel drug delivery polymers
|
|
|
|
|
Biotech
|
|
|
|
|
|
|
|
|
|
Series A Convertible Preferred Stock
|
|
(M)
|
|
|
|
|
68,451 |
|
|
|
136,902 |
|
|
Series B Convertible Preferred Stock
|
|
(M)
|
|
|
|
|
866,500 |
|
|
|
1,733,000 |
|
|
Unsecured Convertible Bridge Notes (including interest)
|
|
(M)
|
|
|
|
$ |
821,975 |
|
|
|
960,948 |
|
| |
|
|
|
|
|
|
|
|
|
|
|
2,830,850 |
|
The accompanying notes are an integral part of these consolidated financial statements.
|
HARRIS & HARRIS GROUP, INC.
CONSOLIDATED SCHEDULE OF INVESTMENTS AS OF DECEMBER 31, 2010
|
| |
|
Method of
|
|
|
|
Shares/
|
|
|
|
|
| |
|
Valuation (1)
|
|
Industry (2)
|
|
Principal
|
|
|
Value
|
|
| |
|
|
|
|
|
|
|
|
|
|
|
|
Investments in Non-Controlled Affiliated Companies (3)(15) –
|
|
|
|
|
|
|
|
|
|
|
|
|
29.1% of net assets at value (Cont.)
|
|
|
|
|
|
|
|
|
|
|
|
| |
|
|
|
|
|
|
|
|
|
|
|
|
Private Placement Portfolio (Illiquid) – 29.1% of net assets
|
|
|
|
|
|
|
|
|
|
|
|
|
at value (Cont.)
|
|
|
|
|
|
|
|
|
|
|
|
| |
|
|
|
|
|
|
|
|
|
|
|
|
Metabolon, Inc. (5)(6) — Developing service and diagnostic
|
|
|
|
|
Healthcare/
|
|
|
|
|
|
|
|
products through the use of a metabolomics, or biochemical,
|
|
|
|
|
Biotech
|
|
|
|
|
|
|
|
profiling platform
|
|
|
|
|
|
|
|
|
|
|
|
|
Series B Convertible Preferred Stock
|
|
(M)
|
|
|
|
|
371,739 |
|
|
$ |
1,087,608 |
|
|
Series B-1 Convertible Preferred Stock
|
|
(M)
|
|
|
|
|
148,696 |
|
|
|
435,043 |
|
|
Series C Convertible Preferred Stock
|
|
(M)
|
|
|
|
|
1,000,000 |
|
|
|
1,000,000 |
|
|
Warrants for Series B-1 Convertible Preferred
|
|
|
|
|
|
|
|
|
|
|
|
|
|
|
Stock expiring 3/25/15
|
|
( I )
|
|
|
|
|
74,348 |
|
|
|
95,493 |
|
| |
|
|
|
|
|
|
|
|
|
|
|
2,618,144 |
|
| |
|
|
|
|
|
|
|
|
|
|
|
|
|
|
Nextreme Thermal Solutions, Inc. (5)(6) — Developing thin-film
|
|
|
|
|
Cleantech
|
|
|
|
|
|
|
|
|
|
thermoelectric devices for cooling and energy conversion
|
|
|
|
|
|
|
|
|
|
|
|
|
|
|
Series A Convertible Preferred Stock
|
|
(M)
|
|
|
|
|
17,500 |
|
|
|
23,762 |
|
|
Series B Convertible Preferred Stock
|
|
(M)
|
|
|
|
|
4,870,244 |
|
|
|
526,895 |
|
| |
|
|
|
|
|
|
|
|
|
|
|
550,657 |
|
| |
|
|
|
|
|
|
|
|
|
|
|
|
|
|
Questech Corporation (5)(6) — Manufacturing and marketing
|
|
|
|
Other |
|
|
|
|
|
|
|
|
|
proprietary metal and stone products for home decoration
|
|
|
|
|
|
|
|
|
|
|
|
|
|
|
Common Stock
|
|
(M)
|
|
|
|
|
655,454 |
|
|
|
498,145 |
|
| |
|
|
|
|
|
|
|
|
|
|
|
|
|
| |
|
|
|
|
Electronics/
|
|
|
|
|
|
|
|
|
|
SiOnyx, Inc. (5)(6)(7) — Developing silicon-based optoelectronic
|
|
|
|
|
Semi-
|
|
|
|
|
|
|
|
|
|
products enabled by its proprietary Black Silicon
|
|
|
|
|
conductors
|
|
|
|
|
|
|
|
|
|
Series A Convertible Preferred Stock
|
|
(M)
|
|
|
|
|
233,499 |
|
|
|
160,367 |
|
|
Series A-1 Convertible Preferred Stock
|
|
(M)
|
|
|
|
|
2,966,667 |
|
|
|
2,037,507 |
|
|
Series A-2 Convertible Preferred Stock
|
|
(M)
|
|
|
|
|
4,207,537 |
|
|
|
2,889,736 |
|
|
Series B-1 Convertible Preferred Stock
|
|
(M)
|
|
|
|
|
1,892,836 |
|
|
|
1,300,000 |
|
|
Warrants for Series B-1 Convertible Preferred
|
|
|
|
|
|
|
|
|
|
|
|
|
|
|
Stock expiring 2/23/17
|
|
( I )
|
|
|
|
|
247,350 |
|
|
|
140,742 |
|
| |
|
|
|
|
|
|
|
|
|
|
|
6,528,352 |
|
The accompanying notes are an integral part of these consolidated financial statements.
|
HARRIS & HARRIS GROUP, INC.
CONSOLIDATED SCHEDULE OF INVESTMENTS AS OF DECEMBER 31, 2010
|
| |
|
Method of
|
|
|
|
Shares/ |
|
|
|
|
| |
|
Valuation (1)
|
|
Industry (2)
|
|
Principal
|
|
|
Value
|
|
| |
|
|
|
|
|
|
|
|
|
|
|
|
Investments in Non-Controlled Affiliated Companies (3)(15) –
|
|
|
|
|
|
|
|
|
|
|
|
|
29.1% of net assets at value (Cont.)
|
|
|
|
|
|
|
|
|
|
|
|
| |
|
|
|
|
|
|
|
|
|
|
|
|
Private Placement Portfolio (Illiquid) – 29.1% of net assets
|
|
|
|
|
|
|
|
|
|
|
|
|
at value (Cont.)
|
|
|
|
|
|
|
|
|
|
|
|
| |
|
|
|
|
|
|
|
|
|
|
|
|
Xradia, Inc. (5)(6) — Designing, manufacturing and selling ultra-high
|
|
|
|
|
Other
|
|
|
|
|
|
|
|
resolution 3D x-ray microscopes and fluorescence imaging systems
|
|
|
|
|
|
|
|
|
|
|
|
|
Series D Convertible Preferred Stock
|
|
(M)
|
|
|
|
|
3,121,099 |
|
|
$ |
9,279,027 |
|
| |
|
|
|
|
|
|
|
|
|
|
|
|
|
|
Total Non-Controlled Private Placement Portfolio (cost: $51,451,965)
|
|
|
|
|
|
|
|
|
|
|
$ |
42,775,415 |
|
| |
|
|
|
|
|
|
|
|
|
|
|
|
|
|
Total Investments in Non-Controlled Affiliated Companies (cost: $51,451,965)
|
|
|
|
|
|
|
|
|
|
|
$ |
42,775,415 |
|
The accompanying notes are an integral part of these consolidated financial statements.
|
HARRIS & HARRIS GROUP, INC.
CONSOLIDATED SCHEDULE OF INVESTMENTS AS OF DECEMBER 31, 2010
|
| |
Method of
|
|
|
|
Shares/
|
|
|
|
|
| |
Valuation (1)
|
|
Industry (2)
|
|
Principal
|
|
|
Value
|
|
| |
|
|
|
|
|
|
|
|
|
|
Investments in Controlled Affiliated Companies (3)(20) – 4.8% of net assets at value
|
|
|
|
|
|
|
|
|
|
| |
|
|
|
|
|
|
|
|
|
|
Private Placement Portfolio (Illiquid) – 4.8% of net assets at value
|
|
|
|
|
|
|
|
|
|
| |
|
|
|
|
|
|
|
|
|
|
Ancora Pharmaceuticals Inc. (5)(6)(7) — Developing synthetic
|
|
|
Healthcare/
|
|
|
|
|
|
|
|
carbohydrates for pharmaceutical applications
|
|
|
Biotech
|
|
|
|
|
|
|
|
Series B Convertible Preferred Stock
|
(M)
|
|
|
|
|
1,663,808 |
|
|
$ |
9,773 |
|
|
Series C Convertible Preferred Stock
|
(M)
|
|
|
|
|
2,066,051 |
|
|
|
945,661 |
|
|
Secured Convertible Bridge Notes (including interest)
|
(M)
|
|
|
|
$ |
1,800,000 |
|
|
|
1,889,534 |
|
| |
|
|
|
|
|
|
|
|
|
2,844,968 |
|
| |
|
|
|
|
|
|
|
|
|
|
|
|
Laser Light Engines, Inc. (5)(6)(7) — Manufacturing solid-state light
|
|
|
Cleantech
|
|
|
|
|
|
|
|
|
|
sources for digital cinema and large-venue projection displays
|
|
|
|
|
|
|
|
|
|
|
|
|
Series A Convertible Preferred Stock
|
(M)
|
|
|
|
|
7,499,062 |
|
|
|
1,273,774 |
|
|
Series B Convertible Preferred Stock
|
(M)
|
|
|
|
|
13,571,848 |
|
|
|
2,940,935 |
|
| |
|
|
|
|
|
|
|
|
|
4,214,709 |
|
| |
|
|
|
|
|
|
|
|
|
|
|
|
Total Controlled Private Placement Portfolio (cost: $9,715,153)
|
|
|
|
|
|
|
|
|
$ |
7,059,677 |
|
| |
|
|
|
|
|
|
|
|
|
|
|
|
Total Investments in Controlled Affiliated Companies (cost: $9,715,153)
|
|
|
|
|
|
|
|
|
$ |
7,059,677 |
|
| |
|
|
|
|
|
|
|
|
|
|
|
|
Total Private Placement Portfolio (cost: $98,647,384)
|
|
|
|
|
|
|
|
|
$ |
106,150,422 |
|
The accompanying notes are an integral part of these consolidated financial statements.
|
HARRIS & HARRIS GROUP, INC.
CONSOLIDATED SCHEDULE OF INVESTMENTS AS OF DECEMBER 31, 2010
|
| |
Method of
|
|
Shares/
|
|
|
|
|
| |
Valuation (1)
|
|
Principal
|
|
|
Value
|
|
| |
|
|
|
|
|
|
|
|
U.S. Government Securities (21) – 26.0% of net assets at value
|
|
|
|
|
|
|
|
| |
|
|
|
|
|
|
|
|
U.S. Treasury Bill — due date 01/13/11
|
(M)
|
|
$ |
38,275,000 |
|
|
$ |
38,274,617 |
|
| |
|
|
|
|
|
|
|
|
|
|
Total Investments in U.S. Government Securities (cost: $38,273,349)
|
|
|
|
|
|
|
$ |
38,274,617 |
|
| |
|
|
|
|
|
|
|
|
|
|
Total Investments (cost: $136,920,733)
|
|
|
|
|
|
|
$ |
144,425,039 |
|
The accompanying notes are an integral part of these consolidated financial statements.
|
HARRIS & HARRIS GROUP, INC.
CONSOLIDATED SCHEDULE OF INVESTMENTS AS OF DECEMBER 31, 2010
|
Notes to Consolidated Schedule of Investments
|
(1)
|
See Footnote to Consolidated Schedule of Investments on page 102 for a description of the Valuation Procedures.
|
|
(2)
|
We classify Cleantech companies as those that seek to improve performance, productivity or efficiency, and to reduce environmental impact, waste, cost, energy consumption or raw materials using nanotechnology-enabled solutions. We classify Electronics/Semiconductor companies as those that use nanotechnology to address problems in electronics-related industries, including semiconductors. We classify Healthcare/Biotech companies as those that use nanotechnology to address problems in healthcare-related industries, including biotechnology, pharmaceuticals and medical devices. We use the term "Other" for companies that operate primarily in industries other than those within Cleantech, Electronics/Semiconductors and Healthcare/Biotech. These industries include photonics, metrology, test and measurement, materials, mining, decorative products and
personal care products.
|
|
(3)
|
Investments in unaffiliated companies consist of investments in which we own less than five percent of the voting shares of the portfolio company. Investments in non-controlled affiliated companies consist of investments in which we own five percent or more, but less than 25 percent, of the voting shares of the portfolio company, or where we hold one or more seats on the portfolio company’s Board of Directors but do not control the company. Investments in controlled affiliated companies consist of investments in which we own 25 percent or more of the voting shares of the portfolio company or otherwise control the company.
|
|
(4)
|
The aggregate cost for federal income tax purposes of investments in unaffiliated privately held companies is $37,480,266. The gross unrealized appreciation based on the tax cost for these securities is $26,953,688. The gross unrealized depreciation based on the tax cost for these securities is $8,118,624.
|
|
(5)
|
We are subject to legal restrictions on the sale of this investment.
|
|
(6)
|
Represents a non-income producing security. Investments that have not paid dividends or interest within the last 12 months are considered to be non-income producing.
|
|
(7)
|
These investments are development-stage companies. A development-stage company is defined as a company that is devoting substantially all of its efforts to establishing a new business, and either it has not yet commenced its planned principal operations, or it has commenced such operations but has not realized significant revenue from them.
|
|
(8)
|
On March 4, 2011, Amgen, Inc., and BioVex Group, Inc., announced the completion of the acquisition of BioVex Group, Inc. With our purchase of Series E Convertible Preferred Stock of BioVex, we received a contingent warrant that was cancelled as a result of the acquisition of BioVex by Amgen. See "Note 12. Subsequent Events."
|
|
(9)
|
Cobalt Technologies, Inc., also does business as Cobalt Biofuels.
|
The accompanying notes are an integral part of this consolidated schedule.
|
HARRIS & HARRIS GROUP, INC.
CONSOLIDATED SCHEDULE OF INVESTMENTS AS OF DECEMBER 31, 2010
|
|
(10)
|
On June 9, 2010, Ensemble Discovery Corporation changed its name to Ensemble Therapeutics Corporation. With our investment in a convertible bridge note issued by Ensemble Therapeutics, we received a warrant to purchase a number of shares of the class of stock sold in the next financing of Ensemble Therapeutics equal to $149,539.57 divided by the price per share of the class of stock sold in the next financing of Ensemble Therapeutics. The ability to exercise this warrant is, therefore, contingent on Ensemble Therapeutics completing successfully a subsequent round of financing. This warrant shall expire and no longer be exercisable on September 10, 2015. The cost basis of this warrant is $89.86.
|
|
(11)
|
Initial investment was made during 2010.
|
|
(12)
|
On February 2, 2011, NeoPhotonics Corporation priced its initial public offering ("IPO") of 7,500,000 shares of common stock at $11 per share. See "Note 12. Subsequent Events."
|
|
(13)
|
On February 28, 2011, Harris & Harris Group sold its shares of Silura Technologies, Inc., for an amount not materially different from the value of the shares as of December 31, 2010. See "Note 12. Subsequent Events."
|
|
(14)
|
With our purchase of the Series B Convertible Preferred Stock of TetraVitae Bioscience, Inc., we received the right to purchase, at a price of $2.63038528 per share, a number of shares in the Series C financing equal to the number of shares of Series B Preferred Stock purchased. The ability to exercise this right is contingent on TetraVitae Bioscience completing successfully a subsequent round of financing. This warrant was cancelled as a result of the conversion of our preferred stock into common stock.
|
|
(15)
|
The aggregate cost for federal income tax purposes of investments in non-controlled affiliated companies is $51,451,965. The gross unrealized appreciation based on the tax cost for these securities is $8,260,861. The gross unrealized depreciation based on the tax cost for these securities is $16,937,411.
|
|
(16)
|
On February 28, 2008, Lifco, Inc., merged with CFX Battery, Inc. The surviving entity was CFX Battery, Inc. On February 24, 2010, CFX Battery, Inc., changed its name to Contour Energy Systems, Inc.
|
|
(17)
|
D-Wave Systems, Inc., is located and is doing business primarily in Canada. We invested in D-Wave Systems, Inc., through D-Wave USA, a Delaware company. Our investment is denominated in Canadian dollars and is subject to foreign currency translation. See Note 2. Summary of Significant Accounting Policies.
|
|
(18)
|
On November 9, 2010, Enumeral Technologies, Inc., changed its name to Enumeral Biomedical Corporation.
|
|
(19)
|
Warrants expired unexercised subsequent to September 30, 2010.
|
|
(20)
|
The aggregate cost for federal income tax purposes of investments in controlled affiliated companies is $9,715,153. The gross unrealized appreciation based on the tax cost for these securities is $0. The gross unrealized depreciation based on the tax cost for these securities is $2,655,476.
|
|
(21)
|
The aggregate cost for federal income tax purposes of our U.S. government securities is $38,273,349. The gross unrealized appreciation on the tax cost for these securities is $1,268. The gross unrealized depreciation on the tax cost of these securities is $0.
|
The accompanying notes are an integral part of this consolidated schedule.
|
HARRIS & HARRIS GROUP, INC.
CONSOLIDATED SCHEDULE OF INVESTMENTS AS OF DECEMBER 31, 2009
|
| |
Method of
|
|
Shares/
|
|
|
|
|
| |
Valuation (1)
|
|
Principal
|
|
|
Value
|
|
| |
|
|
|
|
|
|
|
|
Investments in Unaffiliated Companies (2)(3)(4) – 16.3% of net assets at value
|
|
|
|
|
|
|
|
| |
|
|
|
|
|
|
|
|
Private Placement Portfolio (Illiquid) – 16.1% of net assets at value
|
|
|
|
|
|
|
|
| |
|
|
|
|
|
|
|
|
BioVex Group, Inc. (5)(6)(7)(8) — Developing novel biologics for treatment of cancer and infectious disease
|
|
|
|
|
|
|
|
|
Series E Convertible Preferred Stock
|
(M)
|
|
|
2,799,552 |
|
|
$ |
1,042,862 |
|
|
Series G Convertible Preferred Stock
|
(M)
|
|
|
3,738,004 |
|
|
|
627,985 |
|
|
Warrants at $0.21 expiring 11/5/16
|
( I )
|
|
|
285,427 |
|
|
|
20,836 |
|
| |
|
|
|
|
|
|
|
1,691,683 |
|
| |
|
|
|
|
|
|
|
|
|
|
Cobalt Technologies, Inc. (5)(6)(7)(9) — Developing processes for making biobutanol through biomass fermentation
|
|
|
|
|
|
|
|
|
|
|
Series C Convertible Preferred Stock
|
(M)
|
|
|
352,112 |
|
|
|
375,000 |
|
| |
|
|
|
|
|
|
|
|
|
|
D-Wave Systems, Inc. (5)(6)(7)(10) — Developing high-performance quantum computing systems
|
|
|
|
|
|
|
|
|
|
|
Series B Convertible Preferred Stock
|
(M)
|
|
|
1,144,869 |
|
|
|
907,612 |
|
|
Series C Convertible Preferred Stock
|
(M)
|
|
|
450,450 |
|
|
|
357,101 |
|
|
Series D Convertible Preferred Stock
|
(M)
|
|
|
1,533,395 |
|
|
|
1,215,622 |
|
| |
|
|
|
|
|
|
|
2,480,335 |
|
| |
|
|
|
|
|
|
|
|
|
|
Molecular Imprints, Inc. (5)(6) — Manufacturing nanoimprint lithography capital equipment
|
|
|
|
|
|
|
|
|
|
|
Series B Convertible Preferred Stock
|
(M)
|
|
|
1,333,333 |
|
|
|
2,999,999 |
|
|
Series C Convertible Preferred Stock
|
(M)
|
|
|
1,250,000 |
|
|
|
2,812,500 |
|
|
Warrants at $2.00 expiring 12/31/11
|
( I )
|
|
|
125,000 |
|
|
|
163,625 |
|
| |
|
|
|
|
|
|
|
5,976,124 |
|
| |
|
|
|
|
|
|
|
|
|
|
Nanosys, Inc. (5)(6) — Developing zero and one-dimensional inorganic nanometer-scale materials and devices
|
|
|
|
|
|
|
|
|
|
|
Series C Convertible Preferred Stock
|
(M)
|
|
|
803,428 |
|
|
|
1,185,056 |
|
|
Series D Convertible Preferred Stock
|
(M)
|
|
|
1,016,950 |
|
|
|
1,500,001 |
|
| |
|
|
|
|
|
|
|
2,685,057 |
|
The accompanying notes are an integral part of these consolidated financial statements.
|
HARRIS & HARRIS GROUP, INC.
CONSOLIDATED SCHEDULE OF INVESTMENTS AS OF DECEMBER 31, 2009
|
| |
Method of
|
|
Shares/
|
|
|
|
|
| |
Valuation (1)
|
|
Principal
|
|
|
Value
|
|
| |
|
|
|
|
|
|
|
|
Investments in Unaffiliated Companies (2)(3)(4) – 16.3% of net assets at value (Cont.)
|
|
|
|
|
|
|
|
| |
|
|
|
|
|
|
|
|
Private Placement Portfolio (Illiquid) – 16.1% of net assets at value (Cont.)
|
|
|
|
|
|
|
|
| |
|
|
|
|
|
|
|
|
Nantero, Inc. (5)(6)(7) — Developing a high-density, nonvolatile, random access memory chip, enabled by carbon nanotubes
|
|
|
|
|
|
|
|
|
Series A Convertible Preferred Stock
|
(M)
|
|
|
345,070 |
|
|
$ |
1,046,908 |
|
|
Series B Convertible Preferred Stock
|
(M)
|
|
|
207,051 |
|
|
|
628,172 |
|
|
Series C Convertible Preferred Stock
|
(M)
|
|
|
188,315 |
|
|
|
571,329 |
|
| |
|
|
|
|
|
|
|
2,246,409 |
|
| |
|
|
|
|
|
|
|
|
|
|
NeoPhotonics Corporation (5)(6)(11) — Developing and manufacturing optical devices and components
|
|
|
|
|
|
|
|
|
|
|
Common Stock
|
(M)
|
|
|
1,100,013 |
|
|
|
739,209 |
|
|
Series 1 Convertible Preferred Stock
|
(M)
|
|
|
1,831,256 |
|
|
|
1,230,604 |
|
|
Series 2 Convertible Preferred Stock
|
(M)
|
|
|
741,898 |
|
|
|
498,555 |
|
|
Series 3 Convertible Preferred Stock
|
(M)
|
|
|
2,750,000 |
|
|
|
1,848,000 |
|
|
Series X Convertible Preferred Stock
|
(M)
|
|
|
8,923 |
|
|
|
1,427,680 |
|
|
Warrants at $0.15 expiring 01/26/10
|
( I )
|
|
|
16,364 |
|
|
|
11,291 |
|
|
Warrants at $0.15 expiring 12/05/10
|
( I )
|
|
|
14,063 |
|
|
|
9,703 |
|
| |
|
|
|
|
|
|
|
5,765,042 |
|
| |
|
|
|
|
|
|
|
|
|
|
Polatis, Inc. (5)(6)(7) — Developing MEMS-based optical networking components
|
|
|
|
|
|
|
|
|
|
|
Series A-1 Convertible Preferred Stock
|
(M)
|
|
|
16,775 |
|
|
|
0 |
|
|
Series A-2 Convertible Preferred Stock
|
(M)
|
|
|
71,611 |
|
|
|
0 |
|
|
Series A-4 Convertible Preferred Stock
|
(M)
|
|
|
4,774 |
|
|
|
0 |
|
|
Series A-5 Convertible Preferred Stock
|
(M)
|
|
|
16,438 |
|
|
|
0 |
|
| |
|
|
|
|
|
|
|
0 |
|
| |
|
|
|
|
|
|
|
|
|
|
PolyRemedy, Inc. (5)(6)(7) — Developing a robotic manufacturing platform for wound treatment patches
|
|
|
|
|
|
|
|
|
|
|
Series B-1 Convertible Preferred Stock
|
(M)
|
|
|
287,647 |
|
|
|
46,933 |
|
|
Series B-2 Convertible Preferred Stock
|
(M)
|
|
|
676,147 |
|
|
|
60,853 |
|
| |
|
|
|
|
|
|
|
107,786 |
|
The accompanying notes are an integral part of these consolidated financial statements.
|
HARRIS & HARRIS GROUP, INC.
CONSOLIDATED SCHEDULE OF INVESTMENTS AS OF DECEMBER 31, 2009
|
| |
Method of
|
|
Shares/
|
|
|
|
|
| |
Valuation (1)
|
|
Principal
|
|
|
Value
|
|
| |
|
|
|
|
|
|
|
|
Investments in Unaffiliated Companies (2)(3)(4) – 16.3% of net assets at value (Cont.)
|
|
|
|
|
|
|
|
| |
|
|
|
|
|
|
|
|
Private Placement Portfolio (Illiquid) – 16.1% of net assets at value (Cont.)
|
|
|
|
|
|
|
|
| |
|
|
|
|
|
|
|
|
Siluria Technologies, Inc. (5)(6)(7) — Developing next-generation nanomaterials
|
|
|
|
|
|
|
|
|
Series S-2 Convertible Preferred Stock
|
(M)
|
|
|
612,061 |
|
|
$ |
204,000 |
|
| |
|
|
|
|
|
|
|
|
|
|
TetraVitae Bioscience, Inc. (5)(6)(7)(12) — Developing methods of producing alternative chemicals and fuels through biomass fermentation
|
|
|
|
|
|
|
|
|
|
|
Series B Convertible Preferred Stock
|
(M)
|
|
|
118,804 |
|
|
|
125,000 |
|
| |
|
|
|
|
|
|
|
|
|
|
Total Unaffiliated Private Placement Portfolio (cost: $26,977,200)
|
|
|
|
|
|
|
$ |
21,656,436 |
|
| |
|
|
|
|
|
|
|
|
|
|
Publicly Traded Portfolio (Liquid) – 0.2% of net assets at value
|
|
|
|
|
|
|
|
|
|
| |
|
|
|
|
|
|
|
|
|
|
Orthovita, Inc. (6)(13) — Developing materials and devices for orthopedic medical implant applications Common Stock
|
(M)
|
|
|
64,500 |
|
|
|
226,395 |
|
| |
|
|
|
|
|
|
|
|
|
|
Total Unaffiliated Publicly Traded Portfolio (cost: $298,827)
|
|
|
|
|
|
|
$ |
226,395 |
|
| |
|
|
|
|
|
|
|
|
|
|
Total Investments in Unaffiliated Companies (cost: $27,276,027)
|
|
|
|
|
|
|
$ |
21,882,831 |
|
The accompanying notes are an integral part of these consolidated financial statements.
|
HARRIS & HARRIS GROUP, INC.
CONSOLIDATED SCHEDULE OF INVESTMENTS AS OF DECEMBER 31, 2009
|
| |
Method of
|
|
Shares/
|
|
|
|
|
| |
Valuation (1)
|
|
Principal
|
|
|
Value
|
|
| |
|
|
|
|
|
|
|
|
Investments in Non-Controlled Affiliated Companies (2)(14) –37.5% of net assets at value
|
|
|
|
|
|
|
|
| |
|
|
|
|
|
|
|
|
Private Placement Portfolio (Illiquid) – 37.5% of net assets at value
|
|
|
|
|
|
|
|
| |
|
|
|
|
|
|
|
|
Adesto Technologies Corporation (5)(6)(7) — Developing low-power,high-performance memory devices
|
|
|
|
|
|
|
|
|
Series A Convertible Preferred Stock
|
(M)
|
|
|
6,547,619 |
|
|
$ |
2,420,000 |
|
|
Series B Convertible Preferred Stock
|
(M)
|
|
|
5,952,381 |
|
|
|
2,200,000 |
|
| |
|
|
|
|
|
|
|
4,620,000 |
|
| |
|
|
|
|
|
|
|
|
|
|
Bridgelux, Inc. (5)(6) — Manufacturing high-power light emitting diodes (LEDs) and arrays
|
|
|
|
|
|
|
|
|
|
|
Series B Convertible Preferred Stock
|
(M)
|
|
|
1,861,504 |
|
|
|
1,804,914 |
|
|
Series C Convertible Preferred Stock
|
(M)
|
|
|
2,130,699 |
|
|
|
2,065,926 |
|
|
Series D Convertible Preferred Stock
|
(M)
|
|
|
833,333 |
|
|
|
807,999 |
|
|
Warrants at $0.7136 expiring 12/31/14
|
( I )
|
|
|
163,900 |
|
|
|
98,995 |
|
|
Warrants at $1.50 expiring 8/26/14
|
( I )
|
|
|
124,999 |
|
|
|
55,375 |
|
| |
|
|
|
|
|
|
|
4,833,209 |
|
| |
|
|
|
|
|
|
|
|
|
|
Cambrios Technologies Corporation (5)(6)(7) — Developing nanowire-enabled electronic materials for the display industry
|
|
|
|
|
|
|
|
|
|
|
Series B Convertible Preferred Stock
|
(M)
|
|
|
1,294,025 |
|
|
|
647,013 |
|
|
Series C Convertible Preferred Stock
|
(M)
|
|
|
1,300,000 |
|
|
|
650,000 |
|
|
Series D Convertible Preferred Stock
|
(M)
|
|
|
515,756 |
|
|
|
257,878 |
|
| |
|
|
|
|
|
|
|
1,554,891 |
|
| |
|
|
|
|
|
|
|
|
|
|
CFX Battery, Inc. (5)(6)(7)(15) — Developing batteries using nanostructured materials
|
|
|
|
|
|
|
|
|
|
|
Series A Convertible Preferred Stock
|
(M)
|
|
|
2,565,798 |
|
|
|
2,822,378 |
|
|
Series B Convertible Preferred Stock
|
(M)
|
|
|
812,500 |
|
|
|
1,300,000 |
|
| |
|
|
|
|
|
|
|
4,122,378 |
|
| |
|
|
|
|
|
|
|
|
|
|
Crystal IS, Inc. (5)(6) — Developing single-crystal aluminum nitride substrates for light-emitting diodes Common Stock
|
(M)
|
|
|
2,585,657 |
|
|
|
0 |
|
|
Warrants at $0.78 expiring 05/05/13
|
( I )
|
|
|
15,231 |
|
|
|
0 |
|
|
Warrants at $0.78 expiring 05/12/13
|
( I )
|
|
|
2,350 |
|
|
|
0 |
|
|
Warrants at $0.78 expiring 08/08/13
|
( I )
|
|
|
4,396 |
|
|
|
0 |
|
| |
|
|
|
|
|
|
|
0 |
|
The accompanying notes are an integral part of these consolidated financial statements.
|
HARRIS & HARRIS GROUP, INC.
CONSOLIDATED SCHEDULE OF INVESTMENTS AS OF DECEMBER 31, 2009
|
| |
Method of
|
|
Shares/
|
|
|
|
|
| |
Valuation (1)
|
|
Principal
|
|
|
Value
|
|
| |
|
|
|
|
|
|
|
|
Investments in Non-Controlled Affiliated Companies (2)(14) –37.5% of net assets at value (Cont.)
|
|
|
|
|
|
|
|
| |
|
|
|
|
|
|
|
|
Private Placement Portfolio (Illiquid) – 37.5% of net assets at value (Cont.)
|
|
|
|
|
|
|
|
| |
|
|
|
|
|
|
|
|
Ensemble Discovery Corporation (5)(6)(16) — Developing DNA-Programmed ChemistryTM for the discovery of new classes of therapeutics and bioassays
|
|
|
|
|
|
|
|
|
Series B Convertible Preferred Stock
|
(M)
|
|
|
1,449,275 |
|
|
$ |
1,500,000 |
|
|
Unsecured Convertible Bridge Note (including interest)
|
(M)
|
|
$ |
299,169 |
|
|
|
325,506 |
|
| |
|
|
|
|
|
|
|
1,825,506 |
|
| |
|
|
|
|
|
|
|
|
|
|
Enumeral Technologies, Inc. (5)(6)(7)(13) — Developing high-value opportunities in immunology including therapeutic discovery,immune profiling and personalized medicine
|
|
|
|
|
|
|
|
|
|
|
Unsecured Convertible Bridge Note (including interest)
|
(M)
|
|
$ |
250,000 |
|
|
|
250,438 |
|
| |
|
|
|
|
|
|
|
|
|
|
Innovalight, Inc. (5)(6)(7) — Developing solar power products enabled by silicon-based nanomaterials
|
|
|
|
|
|
|
|
|
|
|
Series B Convertible Preferred Stock
|
(M)
|
|
|
16,666,666 |
|
|
|
2,969,667 |
|
|
Series C Convertible Preferred Stock
|
(M)
|
|
|
5,810,577 |
|
|
|
1,276,457 |
|
|
Series D Convertible Preferred Stock
|
(M)
|
|
|
4,046,974 |
|
|
|
721,090 |
|
| |
|
|
|
|
|
|
|
4,967,214 |
|
| |
|
|
|
|
|
|
|
|
|
|
Kovio, Inc. (5)(6) — Developing semiconductor products using printed electronics and thin-film technologies
|
|
|
|
|
|
|
|
|
|
|
Series C Convertible Preferred Stock
|
(M)
|
|
|
2,500,000 |
|
|
|
609,943 |
|
|
Series D Convertible Preferred Stock
|
(M)
|
|
|
800,000 |
|
|
|
195,182 |
|
|
Series E Convertible Preferred Stock
|
(M)
|
|
|
1,200,000 |
|
|
|
1,500,000 |
|
|
Warrants at $1.25 expiring 12/31/12
|
( I )
|
|
|
355,880 |
|
|
|
291,466 |
|
| |
|
|
|
|
|
|
|
2,596,591 |
|
| |
|
|
|
|
|
|
|
|
|
|
Mersana Therapeutics, Inc. (5)(6)(7) — Developing treatments for cancer based on novel drug delivery polymers
|
|
|
|
|
|
|
|
|
|
|
Series A Convertible Preferred Stock
|
(M)
|
|
|
68,451 |
|
|
|
68,451 |
|
|
Series B Convertible Preferred Stock
|
(M)
|
|
|
866,500 |
|
|
|
866,500 |
|
|
Unsecured Convertible Bridge Note (including interest)
|
(M)
|
|
$ |
650,000 |
|
|
|
708,165 |
|
|
Warrants at $2.00 expiring 10/21/10
|
( I )
|
|
|
91,625 |
|
|
|
16,218 |
|
| |
|
|
|
|
|
|
|
1,659,334 |
|
The accompanying notes are an integral part of these consolidated financial statements.
|
HARRIS & HARRIS GROUP, INC.
CONSOLIDATED SCHEDULE OF INVESTMENTS AS OF DECEMBER 31, 2009
|
| |
Method of
|
|
Shares/
|
|
|
|
|
| |
Valuation (1)
|
|
Principal
|
|
|
Value
|
|
| |
|
|
|
|
|
|
|
|
Investments in Non-Controlled Affiliated Companies (2)(14) –37.5% of net assets at value (Cont.)
|
|
|
|
|
|
|
|
| |
|
|
|
|
|
|
|
|
Private Placement Portfolio (Illiquid) – 37.5% of net assets at value (Cont.)
|
|
|
|
|
|
|
|
| |
|
|
|
|
|
|
|
|
Metabolon, Inc. (5)(6) — Developing service and diagnostic products through the use of a metabolomics, or biochemical, profiling platform
|
|
|
|
|
|
|
|
|
Series B Convertible Preferred Stock
|
(M)
|
|
|
371,739 |
|
|
$ |
1,034,061 |
|
|
Series B-1 Convertible Preferred Stock
|
(M)
|
|
|
148,696 |
|
|
|
413,625 |
|
|
Series C Convertible Preferred Stock
|
(M)
|
|
|
1,000,000 |
|
|
|
1,000,000 |
|
|
Warrants at $1.15 expiring 3/25/15
|
( I )
|
|
|
74,348 |
|
|
|
112,092 |
|
| |
|
|
|
|
|
|
|
2,559,778 |
|
| |
|
|
|
|
|
|
|
|
|
|
NanoGram Corporation (5)(6) — Developing solar power products enabled by silicon-based nanomaterials
|
|
|
|
|
|
|
|
|
|
|
Series I Convertible Preferred Stock
|
(M)
|
|
|
63,210 |
|
|
|
0 |
|
|
Series II Convertible Preferred Stock
|
(M)
|
|
|
1,250,904 |
|
|
|
0 |
|
|
Series III Convertible Preferred Stock
|
(M)
|
|
|
1,242,144 |
|
|
|
0 |
|
|
Series IV Convertible Preferred Stock
|
(M)
|
|
|
432,179 |
|
|
|
0 |
|
| |
|
|
|
|
|
|
|
0 |
|
| |
|
|
|
|
|
|
|
|
|
|
Nextreme Thermal Solutions, Inc. (5)(6) — Developing thin-film thermoelectric devices for cooling and energy conversion
|
|
|
|
|
|
|
|
|
|
|
Series A Convertible Preferred Stock
|
(M)
|
|
|
17,500 |
|
|
|
1,750,000 |
|
|
Series B Convertible Preferred Stock
|
(M)
|
|
|
4,870,244 |
|
|
|
2,655,257 |
|
| |
|
|
|
|
|
|
|
4,405,257 |
|
| |
|
|
|
|
|
|
|
|
|
|
Questech Corporation (5)(6) — Manufacturing and marketing proprietary metal and stone decorative tiles
|
|
|
|
|
|
|
|
|
|
|
Common Stock
|
(M)
|
|
|
655,454 |
|
|
|
425,390 |
|
| |
|
|
|
|
|
|
|
|
|
|
Solazyme, Inc. (5)(6)(7) — Developing algal biodiesel, industrial chemicals and special ingredients based on synthetic biology
|
|
|
|
|
|
|
|
|
|
|
Series A Convertible Preferred Stock
|
(M)
|
|
|
988,204 |
|
|
|
4,978,157 |
|
|
Series B Convertible Preferred Stock
|
(M)
|
|
|
495,246 |
|
|
|
2,494,841 |
|
|
Series C Convertible Preferred Stock
|
(M)
|
|
|
651,309 |
|
|
|
3,281,021 |
|
| |
|
|
|
|
|
|
|
10,754,019 |
|
The accompanying notes are an integral part of these consolidated financial statements.
|
HARRIS & HARRIS GROUP, INC.
CONSOLIDATED SCHEDULE OF INVESTMENTS AS OF DECEMBER 31, 2009
|
| |
Method of
|
|
Shares/
|
|
|
|
|
| |
Valuation (1)
|
|
Principal
|
|
|
Value
|
|
| |
|
|
|
|
|
|
|
|
Investments in Non-Controlled Affiliated Companies (2)(14) –37.5% of net assets at value (Cont.)
|
|
|
|
|
|
|
|
| |
|
|
|
|
|
|
|
|
Private Placement Portfolio (Illiquid) – 37.5% of net assets at value (Cont.)
|
|
|
|
|
|
|
|
| |
|
|
|
|
|
|
|
|
Xradia, Inc. (5)(6) — Designing, manufacturing and selling ultra-high resolution 3D x-ray microscopes and fluorescence imaging systems
|
|
|
|
|
|
|
|
|
Series D Convertible Preferred Stock
|
(M)
|
|
|
3,121,099 |
|
|
$ |
5,723,215 |
|
| |
|
|
|
|
|
|
|
|
|
|
Total Non-Controlled Private Placement Portfolio (cost: $54,864,948)
|
|
|
|
|
|
|
$ |
50,297,220 |
|
| |
|
|
|
|
|
|
|
|
|
|
Total Investments in Non-Controlled Affiliated Companies (cost: $54,864,948)
|
|
|
|
|
|
|
$ |
50,297,220 |
|
The accompanying notes are an integral part of these consolidated financial statements.
|
HARRIS & HARRIS GROUP, INC.
CONSOLIDATED SCHEDULE OF INVESTMENTS AS OF DECEMBER 31, 2009
|
| |
|
Method of
|
|
|
Shares/
|
|
|
|
|
| |
|
Valuation (1)
|
|
|
Principal
|
|
|
Value
|
|
| |
|
|
|
|
|
|
|
|
|
|
|
Investments in Controlled Affiliated Companies (2)(17) –
|
|
|
|
|
|
|
|
|
|
|
|
4.40% of net assets at value
|
|
|
|
|
|
|
|
|
|
|
| |
|
|
|
|
|
|
|
|
|
|
|
Private Placement Portfolio (Illiquid) – 4.40% of
|
|
|
|
|
|
|
|
|
|
|
|
net assets at value
|
|
|
|
|
|
|
|
|
|
|
| |
|
|
|
|
|
|
|
|
|
|
|
Ancora Pharmaceuticals Inc. (5)(6)(7) — Developing synthetic
|
|
|
|
|
|
|
|
|
|
|
|
carbohydrates for pharmaceutical applications
|
|
|
|
|
|
|
|
|
|
|
|
Series B Convertible Preferred Stock
|
|
(M)
|
|
|
|
1,663,808 |
|
|
$ |
17,374 |
|
|
Series C Convertible Preferred Stock
|
|
(M)
|
|
|
|
2,066,051 |
|
|
|
1,239,632 |
|
| |
|
|
|
|
|
|
|
|
|
|
1,257,006 |
|
| |
|
|
|
|
|
|
|
|
|
|
|
|
|
Laser Light Engines, Inc. (5)(6)(7) — Manufacturing solid-state light
|
|
|
|
|
|
|
|
|
|
|
|
|
|
sources for digital cinema and large-venue projection displays
|
|
|
|
|
|
|
|
|
|
|
|
|
|
Series A Convertible Preferred Stock
|
|
(M)
|
|
|
|
7,499,062 |
|
|
|
1,000,000 |
|
|
Secured Convertible Bridge Note (including interest)
|
|
(M)
|
|
|
$ |
1,390,000 |
|
|
|
1,434,116 |
|
| |
|
|
|
|
|
|
|
|
|
|
2,434,116 |
|
| |
|
|
|
|
|
|
|
|
|
|
|
|
|
SiOnyx, Inc. (5)(6)(7) — Developing silicon-based optoelectronic
|
|
|
|
|
|
|
|
|
|
|
|
|
|
products enabled by its proprietary "Black Silicon"
|
|
|
|
|
|
|
|
|
|
|
|
|
|
Series A Convertible Preferred Stock
|
|
(M)
|
|
|
|
233,499 |
|
|
|
67,843 |
|
|
Series A-1 Convertible Preferred Stock
|
|
(M)
|
|
|
|
2,966,667 |
|
|
|
861,965 |
|
|
Series A-2 Convertible Preferred Stock
|
|
(M)
|
|
|
|
4,207,537 |
|
|
|
1,222,500 |
|
| |
|
|
|
|
|
|
|
|
|
|
2,152,308 |
|
| |
|
|
|
|
|
|
|
|
|
|
|
|
|
Total Controlled Private Placement Portfolio (cost: $10,248,932)
|
|
|
|
|
|
|
|
|
|
$ |
5,843,430 |
|
| |
|
|
|
|
|
|
|
|
|
|
|
|
|
Total Investments in Controlled Affiliated Companies (cost: $10,248,932)
|
|
|
|
|
|
|
|
|
|
$ |
5,843,430 |
|
| |
|
|
|
|
|
|
|
|
|
|
|
|
|
Total Private Placement and Publicly Traded Portfolio (cost: $92,389,907)
|
|
|
|
|
|
|
|
|
|
$ |
78,023,481 |
|
The accompanying notes are an integral part of these consolidated financial statements.
|
HARRIS & HARRIS GROUP, INC.
CONSOLIDATED SCHEDULE OF INVESTMENTS AS OF DECEMBER 31, 2009
|
| |
|
Method of
|
|
|
Shares/
|
|
|
|
|
| |
|
Valuation (1)
|
|
|
Principal
|
|
|
Value
|
|
| |
|
|
|
|
|
|
|
|
|
|
U.S. Government Securities (18) – 41.7% of net assets at value
|
|
|
|
|
|
|
|
|
|
|
| |
|
|
|
|
|
|
|
|
|
|
|
U.S. Treasury Bill — due date 04/22/10
|
|
(M)
|
|
|
$ |
10,000,000 |
|
|
$ |
9,997,600 |
|
|
U.S. Treasury Bill — due date 06/17/10
|
|
(M)
|
|
|
|
42,175,000 |
|
|
|
42,139,151 |
|
|
U.S. Treasury Notes — due date 02/28/10, coupon 2.000%
|
|
(M)
|
|
|
|
3,800,000 |
|
|
|
3,810,830 |
|
| |
|
|
|
|
|
|
|
|
|
|
|
|
|
Total Investments in U.S. Government Securities (cost: $55,960,024)
|
|
|
|
|
|
|
|
|
|
$ |
55,947,581 |
|
| |
|
|
|
|
|
|
|
|
|
|
|
|
|
Total Investments (cost: $148,349,931)
|
|
|
|
|
|
|
|
|
|
$ |
133,971,062 |
|
The accompanying notes are an integral part of these consolidated financial statements.
|
HARRIS & HARRIS GROUP, INC.
CONSOLIDATED SCHEDULE OF INVESTMENTS AS OF DECEMBER 31, 2009
|
Notes to Consolidated Schedule of Investments
|
(1)
|
See Footnote to Consolidated Schedule of Investments on page 102 for a description of the Valuation Procedures.
|
|
(2)
|
Investments in unaffiliated companies consist of investments in which we own less than five percent of the voting shares of the portfolio company or less than five percent of the common shares of the publicly traded company. Investments in non-controlled affiliated companies consist of investments in which we own five percent or more, but less than 25 percent, of the voting shares of the portfolio company, or where we hold one or more seats on the portfolio company’s Board of Directors but do not control the company. Investments in controlled affiliated companies consist of investments in which we own 25 percent or more of the voting shares of the portfolio company or otherwise control the company.
|
|
(3)
|
The aggregate cost for federal income tax purposes of investments in unaffiliated private companies is $26,977,200. The gross unrealized appreciation based on the tax cost for these securities is $2,338,205. The gross unrealized depreciation based on the tax cost for these securities is $7,658,969.
|
|
(4)
|
The aggregate cost for federal income tax purposes of investments in unaffiliated publicly traded companies is $298,827. The gross unrealized appreciation based on the tax cost for these securities is $0. The gross unrealized depreciation based on the tax cost for these securities is $72,432.
|
|
(5)
|
Legal restrictions on sale of investment.
|
|
(6)
|
Represents a non-income producing security. Equity investments that have not paid dividends within the last 12 months are considered to be non-income producing.
|
|
(7)
|
These investments are development-stage companies. A development-stage company is defined as a company that is devoting substantially all of its efforts to establishing a new business, and either it has not yet commenced its planned principal operations, or it has commenced such operations but has not realized significant revenue from them.
|
|
(8)
|
With our purchase of Series E Convertible Preferred Stock of BioVex, we received a warrant to purchase a number of shares of common stock of BioVex as determined by dividing 624,999.99 by the price per share at which the common stock is offered and sold to the public in connection with the IPO. The ability to exercise this warrant is, therefore, contingent on BioVex completing successfully an IPO before the expiration date of the warrant on September 27, 2012. The exercise price of this warrant shall be 110 percent of the IPO price.
|
|
(9)
|
Cobalt Technologies, Inc., does business as Cobalt Biofuels.
|
The accompanying notes are an integral part of this consolidated schedule.
|
HARRIS & HARRIS GROUP, INC.
CONSOLIDATED SCHEDULE OF INVESTMENTS AS OF DECEMBER 31, 2009
|
|
(10)
|
D-Wave Systems, Inc., is located and is doing business primarily in Canada. We invested in D-Wave Systems, Inc., through D-Wave USA, a Delaware company. Our investment is denominated in Canadian dollars and is subject to foreign currency translation. See "Note 2. Summary of Significant Accounting Policies."
|
|
(11)
|
We exercised NeoPhotonics Corporation warrants in January and February 2010.
|
|
(12)
|
With our purchase of the Series B Convertible Preferred Stock of TetraVitae Bioscience, Inc., we received the right to purchase, at a price of $2.63038528 per share, a number of shares in the Series C financing equal to the number of shares of Series B Preferred Stock purchased. The ability to exercise this right is contingent on TetraVitae Bioscience completing successfully a subsequent round of financing.
|
|
(13)
|
Initial investment was made during 2009.
|
|
(14)
|
The aggregate cost for federal income tax purposes of investments in non-controlled affiliated companies is $54,864,948. The gross unrealized appreciation based on the tax cost for these securities is $10,648,525. The gross unrealized depreciation based on the tax cost for these securities is $15,216,253.
|
|
(15)
|
On February 28, 2008, Lifco, Inc., merged with CFX Battery, Inc. The surviving entity is CFX Battery, Inc.
|
|
(16)
|
With our investment in a convertible bridge note issued by Ensemble Discovery, we received a warrant to purchase a number of shares of the class of stock sold in the next financing of Ensemble Discovery equal to $149,539.57 divided by the price per share of the class of stock sold in the next financing of Ensemble Discovery. The ability to exercise this warrant is, therefore, contingent on Ensemble Discovery completing successfully a subsequent round of financing. This warrant shall expire and no longer be exercisable on September 10, 2015. The cost basis of this warrant is $89.86.
|
|
(17)
|
The aggregate cost for federal income tax purposes of investments in controlled affiliated companies is $10,248,932. The gross unrealized appreciation based on the tax cost for these securities is $0. The gross unrealized depreciation based on the tax cost for these securities is $4,405,502.
|
|
(18)
|
The aggregate cost for federal income tax purposes of our U.S. government securities is $55,960,024. The gross unrealized appreciation on the tax cost for these securities is $0. The gross unrealized depreciation on the tax cost of these securities is $12,443.
|
The accompanying notes are an integral part of this consolidated schedule.
|
HARRIS & HARRIS GROUP, INC.
FOOTNOTE TO CONSOLIDATED SCHEDULE OF INVESTMENTS
|
VALUATION PROCEDURES
I. Determination of Net Asset Value
The 1940 Act requires periodic valuation of each investment in the portfolio of the Company to determine its net asset value. Under the 1940 Act, unrestricted securities with readily available market quotations are to be valued at the current market value; all other assets must be valued at "fair value" as determined in good faith by or under the direction of the Board of Directors.
The Board of Directors is responsible for (1) determining overall valuation guidelines and (2) ensuring that the investments of the Company are valued within the prescribed guidelines.
The Valuation Committee, comprised of all of the independent Board members, is responsible for determining the valuation of the Company’s assets within the guidelines established by the Board of Directors. The Valuation Committee receives information and recommendations from management. An independent valuation firm also reviews select portfolio company valuations. The independent valuation firm does not provide proposed valuations.
The values assigned to these investments are based on available information and do not necessarily represent amounts that might ultimately be realized when that investment is sold, as such amounts depend on future circumstances and cannot reasonably be determined until the individual investments are actually liquidated or become readily marketable.
II. Approaches to Determining Fair Value
Accounting principles generally accepted in the United States of America ("GAAP") define fair value as the price that would be received to sell an asset or paid to transfer a liability in an orderly transaction between market participants at the measurement date (exit price). In effect, GAAP applies fair value terminology to all valuations whereas the 1940 Act applies market value terminology to readily marketable assets and fair value terminology to other assets.
The main approaches to measuring fair value utilized are the market approach and the income approach.
| |
|
Market Approach (M): The market approach uses prices and other relevant information generated by market transactions involving identical or comparable assets or liabilities. For example, the market approach often uses market multiples derived from a set of comparables. Multiples might lie in ranges with a different multiple for each comparable. The selection of where within the range each appropriate multiple falls requires judgment considering factors specific to the measurement (qualitative and quantitative).
|
| |
|
Income Approach (I): The income approach uses valuation techniques to convert future amounts (for example, cash flows or earnings) to a single present value amount (discounted). The measurement is based on the value indicated by current market expectations about those future amounts. Those valuation techniques include present value techniques; option-pricing models, such as the Black-Scholes-Merton formula (a closed-form model) and a binomial model (a lattice model), which incorporate present value techniques; and the multi-period excess earnings method, which is used to measure the fair value of certain assets.
|
GAAP classifies the inputs used to measure fair value by these approaches into the following hierarchy:
|
|
·
|
Level 1: Unadjusted quoted prices in active markets for identical assets or liabilities.
|
|
|
·
|
Level 2: Quoted prices in active markets for similar assets or liabilities, or quoted prices for identical or similar assets or liabilities in markets that are not active, or inputs other than quoted prices that are observable for the asset or liability.
|
|
|
·
|
Level 3: Unobservable inputs for the asset or liability.
|
Financial assets and liabilities are classified in their entirety based on the lowest level of input that is significant to the fair value measurement and are not necessarily an indication of risks associated with the investment.
III. Investment Categories
The Company’s investments can be classified into five broad categories for valuation purposes:
|
|
·
|
Equity-related securities;
|
|
|
·
|
Long-term fixed-income securities;
|
|
|
·
|
Short-term fixed-income securities;
|
|
|
·
|
Investments in intellectual property, patents, research and development in technology or product development; and
|
The Company applies the methods for determining fair value discussed above to the valuation of investments in each of these five broad categories as follows:
|
|
A.
|
EQUITY-RELATED SECURITIES
|
Equity-related securities, including warrants, are fair valued using the market or income approaches. The following factors may be considered when the market approach is used to fair value these types of securities:
|
|
§
|
Readily available public market quotations;
|
|
|
§
|
The cost of the Company’s investment;
|
|
|
§
|
Transactions in a company's securities or unconditional firm offers by responsible parties as a factor in determining valuation;
|
|
|
§
|
The financial condition and operating results of the company;
|
|
|
§
|
The company's progress towards milestones.
|
|
|
§
|
The long-term potential of the business and technology of the company;
|
|
|
§
|
The values of similar securities issued by companies in similar businesses;
|
|
|
§
|
Multiples to revenue, net income or EBITDA that similar securities issued by companies in similar businesses receive;
|
|
|
§
|
The proportion of the company's securities we own and the nature of any rights to require the company to register restricted securities under applicable securities laws; and
|
|
|
§
|
The rights and preferences of the class of securities we own as compared with other classes of securities the portfolio company has issued.
|
When the income approach is used to value warrants, the Company uses the Black-Scholes-Merton formula.
|
|
B.
|
LONG-TERM FIXED-INCOME SECURITIES
|
|
|
1.
|
Readily Marketable: Long-term fixed-income securities for which market quotations are readily available are valued using the most recent bid quotations when available.
|
|
|
2.
|
Not Readily Marketable: Long-term fixed-income securities for which market quotations are not readily available are fair valued using the income approach. The factors that may be considered when valuing these types of securities by the income approach include:
|
|
|
·
|
Interest rate analysis;
|
|
|
·
|
Quotations from broker-dealers;
|
|
|
·
|
Prices from independent pricing services that the Board believes are reasonably reliable; and
|
|
|
·
|
Reasonable price discovery procedures and data from other sources.
|
|
|
C.
|
SHORT-TERM FIXED-INCOME SECURITIES
|
Short-term fixed-income securities are valued using the market approach in the same manner as long-term fixed-income securities until the remaining maturity is 60 days or less, after which time such securities may be valued at amortized cost if there is no concern over payment at maturity.
|
|
D.
|
INVESTMENTS IN INTELLECTUAL PROPERTY, PATENTS, RESEARCH AND DEVELOPMENT IN TECHNOLOGY OR PRODUCT DEVELOPMENT
|
Such investments are fair valued using the market approach. The Company may consider factors specific to these types of investments when using the market approach including:
|
|
·
|
The cost of the Company’s investment;
|
|
|
·
|
Investments in the same or substantially similar intellectual property or patents or research and development in technology or product development or offers by responsible third parties;
|
|
|
·
|
The results of research and development;
|
|
|
·
|
Product development and milestone progress;
|
|
|
·
|
Other subjective factors.
|
All other securities are reported at fair value as determined in good faith by the Valuation Committee using the approaches for determining valuation as described above.
For all other securities, the reported values shall reflect the Valuation Committee's judgment of fair values as of the valuation date using the outlined basic approaches of valuation discussed in Section III. They do not necessarily represent an amount of money that would be realized if we had to sell such assets in an immediate liquidation. Thus, valuations as of any particular date are not necessarily indicative of amounts that we may ultimately realize as a result of future sales or other dispositions of investments we hold.
|
NOTES TO CONSOLIDATED FINANCIAL STATEMENTS
|
NOTE 1. THE COMPANY
Harris & Harris Group, Inc. (the "Company," "us," "our" and "we"), is a venture capital company operating as a business development company ("BDC") under the Investment Company Act of 1940 (the "1940 Act") that specializes in making investments in companies commercializing and integrating products enabled by nanotechnology and microsystems. We operate as an internally managed company whereby our officers and employees, under the general supervision of our Board of Directors, conduct our operations.
Harris & Harris Enterprises, Inc.SM, ("Enterprises") is a 100 percent wholly owned subsidiary of the Company. Enterprises is taxed under Subchapter C of the Code (a "C Corporation"). Harris Partners I, L.P, is a limited partnership and, from time to time, may be used to hold certain interests in portfolio companies. The partners of Harris Partners I, L.P., are Enterprises (sole general partner) and the Company (sole limited partner). Enterprises pays taxes on any non-passive investment income generated by Harris Partners I, L.P. For the period ended December 31, 2010, there was no non-passive investment income generated by Harris
Partners I, L.P. Enterprises, as the sole general partner, consolidates Harris Partners I, L.P. The Company consolidates its wholly owned subsidiary, Enterprises, for financial reporting purposes.
NOTE 2. SUMMARY OF SIGNIFICANT ACCOUNTING POLICIES
The following is a summary of significant accounting policies followed in the preparation of the consolidated financial statements:
Principles of Consolidation. The consolidated financial statements have been prepared in accordance with accounting principles generally accepted in the United States of America ("GAAP") and include the accounts of the Company and its wholly owned subsidiary. In accordance with GAAP and Regulation S-X, the Company may only consolidate its interests in investment company subsidiaries and controlled operating companies whose business consists of providing services to the Company. Our wholly owned subsidiary, Enterprises, is a controlled operating company which provides services to us and is, therefore, consolidated. All significant inter-company accounts
and transactions have been eliminated in consolidation. Certain prior period amounts have been reclassified to conform to the current period presentation.
Use of Estimates. The preparation of the consolidated financial statements in conformity with GAAP requires management to make estimates and assumptions that affect the reported amounts of assets and liabilities and contingent assets and liabilities and the reported amounts of revenues and expenses. Actual results could differ from these estimates, and the differences could be material. The most significant estimates relate to the fair valuations of our investments.
Cash and Cash Equivalents. Cash and cash equivalents include demand deposits. Cash and cash equivalents are carried at cost which approximates fair value.
Portfolio Investment Valuations. Investments are stated at "value" as defined in the 1940 Act and in the applicable regulations of the Securities and Exchange Commission ("SEC") and in accordance with GAAP. Value, as defined in Section 2(a)(41) of the 1940 Act, is (i) the market price for those securities for which a market quotation is readily available and (ii) the fair value as determined in good faith by, or under the direction of, the Board of Directors for all other assets. (See "Valuation Procedures" in the "Footnote to Consolidated Schedule of Investments.") At December 31, 2010, our financial statements include privately held venture capital
investments valued at $106,150,422. The fair values of our private venture capital investments were determined in good faith by, or under the direction, of the Board of Directors. Upon sale of investments, the values that are ultimately realized may be different from what is presently estimated. The difference could be material.
Foreign Currency Translation. The accounting records of the Company are maintained in U.S. dollars. All assets and liabilities denominated in foreign currencies are translated into U.S. dollars based on the rate of exchange of such currencies against U.S. dollars on the date of valuation. For the twelve months ended December 31, 2010, included in the net decrease in unrealized depreciation on investments was a $178,295 unrealized gain resulting from foreign currency translation.
Securities Transactions. Securities transactions are accounted for on the date the transaction for the purchase or sale of the securities is entered into by the Company (i.e., trade date).
Interest Income Recognition. Interest income, adjusted for amortization of premium and accretion of discount, is recorded on an accrual basis. When securities are determined to be non-income producing, the Company ceases accruing interest and writes off any previously accrued interest. During the twelve months ended December 31, 2010, the Company earned $69,159 in interest on U.S. government securities, participation agreements and interest-bearing accounts. During the twelve months ended December 31, 2010, the Company recorded $346,629 of bridge note interest.
Loan Origination Fees. Upfront loan origination fees received in connection with investments are capitalized. The unearned fee income is accreted into income based on the effective interest method over the life of the investment.
Realized Gain or Loss and Unrealized Appreciation or Depreciation of Portfolio Investments. Realized gain or loss is recognized when an investment is disposed of and is computed as the difference between the Company's cost basis in the investment at the disposition date and the net proceeds received from such disposition. Realized gains and losses on investment transactions are determined by specific identification. Unrealized appreciation or depreciation is computed as the difference between the fair value of the investment and the cost basis of such investment.
Stock-Based Compensation. The Company has a stock-based employee compensation plan. The Company accounts for the Harris & Harris Group, Inc. 2006 Equity Incentive Plan (the "Stock Plan") by determining the fair value of all share-based payments to employees, including the fair value of grants of employee stock options, and records these amounts as an expense in the Consolidated Statements of Operations over the vesting period with a corresponding increase to our additional paid-in capital. At December 31, 2010, and December 31, 2009, the increase to our operating expenses was offset by the increase to our additional paid-in capital, resulting in no net impact to our net asset value. Additionally, the Company does not record the tax benefits associated with the expensing of stock options, because the Company currently intends to qualify as a regulated investment company ("RIC") under Subchapter M of the Internal Revenue Code of 1986 (the "Code"). The amount of non-cash, stock-based compensation expense recognized in the Consolidated Statements of Operations is based on the fair value of the awards the Company expects to vest, recognized over the vesting period on a straight-line basis for each award, and adjusted for actual options vested and pre-vesting forfeitures. The forfeiture rate is estimated at the time of grant and revised, if necessary, in subsequent periods if the actual forfeiture rate differs from the estimated rate and is accounted for in the current period and prospectively. See "Note 5. Stock-Based Compensation" for further discussion.
Income Taxes. As we intend to qualify as a RIC under Subchapter M of the Code, the Company does not provide for income taxes. The Company recognizes interest and penalties in income tax expense.
We pay federal, state and local income taxes on behalf of our wholly owned subsidiary, Harris & Harris Enterprises, Inc., which is a C corporation. See "Note 8. Income Taxes."
Restricted Funds. At December 31, 2010, and December 31, 2009, we held $2,751 and $2,000, respectively, in restricted funds as a security deposit for our sublessors.
Property and Equipment. Property and equipment are included in "Other Assets" and are carried at $364,202 and $69,528 at December 31, 2010, and December 31, 2009, respectively, representing cost, less accumulated depreciation. Depreciation is provided using the straight-line method over the estimated useful lives of the premises and equipment. We estimate the useful lives to be five to ten years for furniture and fixtures, three years for computer equipment, and ten years for leasehold improvements.
Rent expense. Our lease at 1450 Broadway, New York, New York, commenced on January 21, 2010. The lease expires on December 31, 2019. The base rent is $36 per square foot with a 2.5 percent increase per year over the 10 years of the lease, subject to a full abatement of rent for four months and a rent credit for six months throughout the lease term. Certain leasehold improvements were also paid for on our behalf by the landlord, the cost of which is accounted for as property and equipment and deferred rent in the accompanying Consolidated Statements of Assets and Liabilities. These leasehold improvements are depreciated over the lease term. We apply these rent abatements, credits,
escalations and landlord payments on a straight-line basis in the determination of rent expense over the lease term.
Lease Termination Costs. During the twelve months ended December 31, 2010, we recognized a loss of $56,540 for costs associated with vacating our offices at 111 West 57th Street, New York, New York, prior to the end of our lease in April 2010.
Post Retirement Plan Liabilities. Unrecognized actuarial gains and losses are recognized as net periodic benefit cost pursuant to the Company's historical accounting policy for amortizing such amounts. Actuarial gains and losses that arise that are not recognized as net periodic benefit cost in the same periods will be recognized as a component of net assets.
Concentration of Credit Risk. The Company places its cash and cash equivalents with financial institutions and, at times, cash held in checking accounts may exceed the Federal Deposit Insurance Corporation insured limit.
Recent Accounting Pronouncements. In January 2010, the FASB issued ASU 2010-06, "Improving Disclosures About Fair Value Measurements." ASU 2010-06 requires the separate disclosure of significant transfers into and out of the Level 1 and Level 2 categories; requires fair value measurement disclosures for each class of assets and liabilities; and requires disclosures about valuation techniques and inputs used in Level 2 and Level 3 fair value measurements. These disclosure requirements became effective at the beginning of 2010. In addition, effective in fiscal years beginning after December 15, 2010, ASU 2010-06 also requires Level 3 disclosures of activity on a gross rather than a net basis. We
do not anticipate that the remaining disclosures under ASU 2010-06 will have a material impact on our Consolidated Financial Statements.
NOTE 3. BUSINESS RISKS AND UNCERTAINTIES
We have invested a substantial portion of our assets in privately held companies, the securities of which are inherently illiquid. We also seek to invest in small publicly traded companies that we believe have exceptional growth potential. Although these companies are publicly traded, their stock may not trade at high volumes and prices can be volatile, which may restrict our ability to sell our positions. These privately held and publicly traded businesses tend to lack management depth, to have limited or no history of operations and to not have attained profitability. Because of the speculative nature of our investments and the lack of a public market for privately held investments, there is greater risk of loss than is
the case with traditional investment securities.
We do not choose investments based on a strategy of diversification. We also do not rebalance the portfolio should one of our portfolio companies increase in value substantially relative to the rest of the portfolio. Therefore, the value of our portfolio may be more vulnerable to events affecting a single sector, industry or portfolio company and, therefore, subject to greater volatility than a company that follows a diversification strategy. As of December 31, 2010, our largest ten investments by value accounted for approximately 72 percent of the value of our venture capital portfolio. Our largest investment, by value, accounted for approximately 22 percent of our venture capital portfolio at December 31, 2010.
Because there is typically no public or readily ascertainable market for our interests in the small privately held companies in which we invest, the valuation of the equity, bridge note and participation agreement interests in that portion of our portfolio is determined in good faith by our Valuation Committee, comprised of all of the independent members of our Board of Directors, in accordance with our Valuation Procedures and is subject to significant estimates and judgments. The determined value of our portfolio of equity interests, bridge notes and participation agreements may differ significantly from the values that would be placed on the portfolio if a ready market for the equity interests, bridge notes and participation agreements existed. Any changes in valuation are recorded in
our Consolidated Statements of Operations as "Net decrease (increase) in unrealized depreciation on investments." Changes in valuation of any of our investments in privately held companies from one period to another may be volatile.
NOTE 4. INVESTMENTS
At December 31, 2010, our financial assets were categorized as follows in the fair value hierarchy:
| |
|
|
|
|
Fair Value Measurement at Reporting Date Using:
|
|
|
Description
|
|
December 31, 2010
|
|
|
Quoted Prices in Active
Markets for Identical
Assets (Level 1)
|
|
|
Significant Other
Observable Inputs
(Level 2)
|
|
|
Significant
Unobservable Inputs
(Level 3)
|
|
| |
|
|
|
|
|
|
|
|
|
|
|
|
|
U.S. Government Securities
|
|
$ |
38,274,617 |
|
|
$ |
38,274,617 |
|
|
$ |
0 |
|
|
$ |
0 |
|
| |
|
|
|
|
|
|
|
|
|
|
|
|
|
|
|
|
|
Privately Held Portfolio Companies:
|
|
|
|
|
|
|
|
|
|
|
|
|
|
|
|
|
|
|
|
$ |
100,451,746 |
|
|
$ |
0 |
|
|
$ |
0 |
|
|
$ |
100,451,746 |
|
|
|
|
$ |
3,565,062 |
|
|
$ |
0 |
|
|
$ |
0 |
|
|
$ |
3,565,062 |
|
|
|
|
$ |
977,414 |
|
|
$ |
0 |
|
|
$ |
0 |
|
|
$ |
977,414 |
|
|
|
|
$ |
684,780 |
|
|
$ |
0 |
|
|
$ |
0 |
|
|
$ |
684,780 |
|
|
Participation Agreement
|
|
$ |
471,420 |
|
|
$ |
0 |
|
|
$ |
0 |
|
|
$ |
471,420 |
|
|
|
|
|
|
|
|
|
|
|
|
|
|
|
|
|
|
|
|
Total
|
|
$ |
144,425,039 |
|
|
$ |
38,274,617 |
|
|
$ |
0 |
|
|
$ |
106,150,422 |
|
The following chart shows the components of change in the financial assets categorized as Level 3 for the twelve months ended December 31, 2010.
| |
|
Beginning
Balance
1/1/2010
|
|
|
Total
Realized
Losses
Included in
Changes in
Net Assets
|
|
|
Total
Unrealized
Gains
(Losses)
Included in
Changes in
Net Assets
|
|
|
Investments
in Private
Placements
and Interest
on Bridge
Notes, Net
|
|
|
Disposals
|
|
|
Ending
Balance
12/31/2010
|
|
|
Amount of Total
Gains for the Period
Included in Changes
in Net Assets
Attributable to the
Change in
Unrealized Gains or
Losses Relating to
Assets Still Held at
the Reporting Date
|
|
| |
|
|
|
|
|
|
|
|
|
|
|
|
|
|
|
|
|
|
|
|
|
|
Preferred Stock
|
|
$ |
73,134,661 |
|
|
$ |
(3,136,552 |
) |
|
$ |
21,786,178 |
|
|
$ |
8,667,459 |
|
|
$ |
0 |
|
|
$ |
100,451,746 |
|
|
$ |
18,649,627 |
|
| |
|
|
|
|
|
|
|
|
|
|
|
|
|
|
|
|
|
|
|
|
|
|
|
|
|
|
|
|
|
Bridge Notes
|
|
|
2,718,225 |
|
|
|
0 |
|
|
|
0 |
|
|
|
846,837 |
|
|
|
0 |
|
|
|
3,565,062 |
|
|
|
0 |
|
| |
|
|
|
|
|
|
|
|
|
|
|
|
|
|
|
|
|
|
|
|
|
|
|
|
|
|
|
|
|
Common Stock
|
|
|
1,164,599 |
|
|
|
0 |
|
|
|
(196,063 |
) |
|
|
8,878 |
|
|
|
0 |
|
|
|
977,414 |
|
|
|
(196,063 |
) |
| |
|
|
|
|
|
|
|
|
|
|
|
|
|
|
|
|
|
|
|
|
|
|
|
|
|
|
|
|
|
Warrants
|
|
|
779,601 |
|
|
|
(447,909 |
) |
|
|
218,746 |
|
|
|
134,342 |
|
|
|
0 |
|
|
|
684,780 |
|
|
|
218,746 |
|
| |
|
|
|
|
|
|
|
|
|
|
|
|
|
|
|
|
|
|
|
|
|
|
|
|
|
|
|
|
|
Participation Agreement
|
|
|
0 |
|
|
|
0 |
|
|
|
(11,830 |
) |
|
|
483,250 |
|
|
|
0 |
|
|
|
471,420 |
|
|
|
(11,830 |
) |
| |
|
|
|
|
|
|
|
|
|
|
|
|
|
|
|
|
|
|
|
|
|
|
|
|
|
|
|
|
|
Total
|
|
$ |
77,797,086 |
|
|
$ |
(3,584,461 |
) |
|
$ |
21,797,031 |
|
|
$ |
10,140,766 |
|
|
$ |
0
|
|
|
$ |
106,150,422 |
|
|
$ |
18,660,480 |
|
At December 31, 2009, our financial assets were categorized as follows in the fair value hierarchy:
| |
|
|
|
|
Fair Value Measurement at Reporting Date Using:
|
|
|
Description
|
|
December 31, 2009
|
|
|
Quoted Prices in Active
Markets for Identical
Assets (Level 1)
|
|
|
Significant Other
Observable Inputs
(Level 2)
|
|
|
Significant
Unobservable Inputs
(Level 3)
|
|
| |
|
|
|
|
|
|
|
|
|
|
|
|
|
U.S. Government Securities
|
|
$ |
55,947,581 |
|
|
$ |
52,136,751 |
|
|
$ |
3,810,830 |
|
|
$ |
0 |
|
| |
|
|
|
|
|
|
|
|
|
|
|
|
|
|
|
|
|
Private Portfolio Companies:
|
|
|
|
|
|
|
|
|
|
|
|
|
|
|
|
|
|
|
|
$ |
73,134,661 |
|
|
$ |
0 |
|
|
$ |
0 |
|
|
$ |
73,134,661 |
|
|
|
|
$ |
2,718,225 |
|
|
$ |
0 |
|
|
$ |
0 |
|
|
$ |
2,718,225 |
|
|
|
|
$ |
1,164,599 |
|
|
$ |
0 |
|
|
$ |
0 |
|
|
$ |
1,164,599 |
|
|
Warrants
|
|
$ |
779,601 |
|
|
$ |
0 |
|
|
$ |
0 |
|
|
$ |
779,601 |
|
|
|
|
$ |
77,797,086 |
|
|
$ |
0 |
|
|
$ |
0
|
|
|
$ |
77,797,086
|
|
Publicly Traded Portfolio Companies
|
|
$ |
226,395 |
|
|
$ |
226,395 |
|
|
$ |
0 |
|
|
$ |
0 |
|
| |
|
|
|
|
|
|
|
|
|
|
|
|
|
|
|
|
|
Total
|
|
$ |
133,971,062 |
|
|
$ |
52,363,146 |
|
|
$ |
3,810,830 |
|
|
$ |
77,797,086 |
|
The following chart shows the components of change in the financial assets categorized as Level 3, for the twelve months ended December 31, 2009.
| |
|
Fair Value Measurements Using Significant
|
|
| |
|
Unobservable Inputs (Level 3)
|
|
| |
|
|
|
| |
|
Portfolio Companies
|
|
| |
|
|
|
|
Beginning Balance, January 1, 2009
|
|
$ |
56,965,153 |
|
|
Total realized losses included in change in net assets
|
|
|
(11,106,005 |
) |
|
Total unrealized gains included in change in net assets
|
|
|
19,830,852 |
|
|
Investments in private placements and interest on bridge notes
|
|
|
12,212,789 |
|
|
Disposals and write-offs of bridge note interest
|
|
|
(105,703 |
) |
|
Ending Balance, December 31, 2009
|
|
$ |
77,797,086 |
|
|
The amount of total gains for the period included in changes in net assets attributable to the change in unrealized gains or losses relating to assets still held at the reporting date
|
|
$ |
8,786,290 |
|
NOTE 5. STOCK-BASED COMPENSATION
On March 23, 2006, the Board of Directors of the Company voted to terminate the Employee Profit-Sharing Plan and to establish the Harris & Harris Group, Inc. 2006 Equity Incentive Plan (the "Stock Plan"), subject to shareholder approval. This proposal was approved at the May 4, 2006, Annual Meeting of Shareholders. The Stock Plan provides for the grant of equity-based awards of stock options to our officers, employees and directors (subject to receipt of an exemptive order described below) and restricted stock (subject to receipt of an exemptive order described below) to our officers and employees who are selected by our Compensation Committee for participation in the plan and subject to compliance with the 1940 Act.
On July 11, 2006, the Company filed an application with the SEC regarding certain provisions of the Stock Plan, and the Company has responded to comments from the SEC on the application. On May 28, 2010, we filed an amended application. We expect to receive formal written comments on the amended application. In the event that the SEC provides the exemptive relief requested by the application, and we receive stockholder approval for such provisions, the Compensation Committee may, in the future, authorize awards of stock options under an amended Stock Plan to non-employee directors of the Company and authorize grants of restricted stock to officers and employees.
A maximum of 20 percent of our total shares of our common stock issued and outstanding are available for awards under the Stock Plan. Under the Stock Plan, no more than 25 percent of the shares of stock reserved for the grant of the awards under the Stock Plan may be restricted stock awards at any time during the term of the Stock Plan. If any shares of restricted stock are awarded, such awards will reduce on a percentage basis the total number of shares of stock for which options may be awarded. If the Company does not receive exemptive relief from the SEC to issue restricted stock, all shares granted under the Stock Plan must be subject to stock options. No more than 1,000,000 shares of our common stock may be made
subject to awards under the Stock Plan to any individual in any year.
During the years ended December 31, 2010, 2009, and 2008, the Compensation Committee of the Board of Directors of the Company approved individual non-qualified stock option ("NQSO") awards for certain officers and employees of the Company. The terms and conditions of the stock options granted were determined by the Compensation Committee and set forth in award agreements between the Company and each award recipient.
The option grants during the years ended December 31, 2010, 2009, and 2008 were as follows:
|
Grant Date
|
|
No. of Options
Granted
|
|
Option Type
|
|
Vesting Period
|
|
Exercise Price1
|
|
| |
|
|
|
|
|
|
|
|
|
|
May 12, 2010
|
|
150,000 |
|
NQSO
|
|
05/11 to 05/13
|
|
$ |
4.84 |
|
|
March 18, 2010
|
|
150,000 |
|
NQSO
|
|
03/11 to 03/13
|
|
$ |
4.75 |
|
|
November 11, 2009
|
|
200,000 |
|
NQSO
|
|
11/10 to 11/12
|
|
$ |
4.49 |
|
|
May 13, 2009
|
|
200,000 |
|
NQSO
|
|
11/09 to 05/13
|
|
$ |
4.46 |
|
|
March 18, 2009
|
|
329,999 |
|
NQSO
|
|
03/10 to 03/13
|
|
$ |
3.75 |
|
|
August 13, 2008
|
|
1,163,724 |
|
NQSO
|
|
12/08 to 08/12
|
|
$ |
6.92 |
|
|
March 19, 2008
|
|
348,032 |
|
NQSO
|
|
03/09 to 03/12
|
|
$ |
6.18 |
|
1 The exercise price for the May 12, 2010, March 18, 2010, November 11, 2009, May 13, 2009, and March 18, 2009, grants was the closing price of our shares of common stock as quoted on the Nasdaq Global Market on the date of grant. The exercise price for the August 13, 2008, and March 19, 2008, grants was the volume weighted average price as quoted on the Nasdaq Global Market on the date of the grant.
The 2009 and 2010 option awards may become fully vested and exercisable prior to the date or dates in the vesting schedule if the Board of Directors accepts an offer for the sale of all or substantially all of the Company's assets. Upon exercise, the shares would be issued from our previously authorized but unissued shares. In addition, with respect to the grant on March 18, 2009, the awards were to become fully vested and exercisable prior to the date or dates in the vesting schedule if (1) the market price of the shares of our stock reached $6.00 per share at the close of business on three consecutive trading days on the Nasdaq Global Market or (2) the Board of Directors accepted an offer for the sale of substantially all of the Company's assets.
At the close of business on July 28, 2009, the price of our stock reached $6.00 for the third consecutive trading day on the Nasdaq Global Market. Accordingly, the vesting schedule accelerated and all 329,999 options became immediately vested and exercisable. The remaining compensation cost of $364,839 was recognized in the quarter ended September 30, 2009. This expense has no impact on the net asset value as the non-cash compensation cost is offset by an increase to our additional paid-in capital.
The fair value of the options was determined on the date of grant using the Black-Scholes-Merton or lattice models based on the following factors.
An option's expected term is the estimated period between the grant date and the exercise date of the option. As the expected term period increases, the fair value of the option and the non-cash compensation cost will also increase. The expected term assumption is generally calculated using historical stock option exercise data. Management has performed an analysis and has determined that historical exercise data does not provide a sufficient basis to calculate the expected term of the option. In cases where companies do not have historical data and where the options meet certain criteria, SEC Staff Accounting Bulletin 107 ("SAB 107") provides the use of a simplified expected term calculation. Accordingly, the Company calculated the expected term used in the
Black-Scholes-Merton model using the SAB 107 simplified method.
Expected volatility is the measure of how the stock's price is expected to fluctuate over a period of time. An increase in the expected volatility assumption yields a higher fair value of the stock option. The expected volatility factor for the Black-Scholes-Merton and lattice models were based on the historical fluctuations in the Company’s stock price over a period commensurate with the expected term and contractual term, respectively, of the options, adjusted for stock splits and dividends.
The expected exercise factor in the lattice model is an estimate of when options will be exercised when they are in the money. An expected exercise factor of two assumes that options will be exercised when they reach two times their strike price.
The expected dividend yield assumption is traditionally calculated based on a company's historical dividend yield. An increase to the expected dividend yield results in a decrease in the fair value of options and resulting compensation cost. Although the Company has declared deemed dividends in previous years, most recently in 2005, the amounts and timing of any future dividends cannot be reasonably estimated. Therefore, for purposes of calculating fair value, the Company has assumed an expected dividend yield of zero percent.
The risk-free interest rate assumption used in the Black-Scholes-Merton model is based on the annual yield on the measurement date of a zero-coupon U.S. Treasury bond the maturity of which equals the option’s expected term. The lattice model uses interest rates commensurate with the contractual term of the options. Higher assumed interest rates yield higher fair values.
The assumptions used in the calculation of fair value of the stock options granted during 2008 using the Black-Scholes-Merton model for the contract term were as follows:
| |
|
|
|
|
|
|
|
|
|
|
|
|
|
|
|
Weighted
|
|
| |
|
|
|
|
|
|
|
|
|
|
|
|
|
|
|
Average
|
|
| |
|
|
|
Number
|
|
|
Expected
|
|
|
Expected
|
|
Expected
|
|
Risk-free
|
|
Fair
|
|
| |
|
|
|
of Options
|
|
|
Term
|
|
|
Volatility
|
|
Dividend
|
|
Interest
|
|
Value
|
|
|
Type of Award
|
|
Term
|
|
Granted
|
|
|
in Yrs
|
|
|
Factor
|
|
Yield
|
|
Rates
|
|
Per Share
|
|
| |
|
|
|
|
|
|
|
|
|
|
|
|
|
|
|
|
|
|
Non-qualified stock options
|
|
9.78 Years
|
|
|
348,032 |
|
|
6.14 |
|
|
57.1% |
|
0% |
|
2.62% |
|
$3.45 |
|
| |
|
|
|
|
|
|
|
|
|
|
|
|
|
|
|
|
|
|
|
Non-qualified stock options
|
|
9.38 Years
|
|
|
1,163,724 |
|
|
Ranging
From 4.88
to 5.94
|
|
|
Ranging
From 50.6%
to 55.1%
|
|
0% |
|
Ranging
From 3.24%
to 3.40%
|
|
Ranging
From $3.25
to $3.79
|
|
| |
|
|
|
|
|
|
|
|
|
|
|
|
|
|
|
|
|
|
|
Total
|
|
|
|
|
1,511,756 |
|
|
|
|
|
|
|
|
|
|
|
|
|
The assumptions used in the calculation of fair value using the Black-Scholes model for each contract term for grants in 2009 were as follows:
| |
|
|
|
Number
|
|
|
Expected
|
|
|
Expected
|
|
Expected
|
|
Risk-free
|
|
Fair
|
|
| |
|
Contractual
|
|
of Options
|
|
|
Term
|
|
|
Volatility
|
|
Dividend
|
|
Interest
|
|
Value
|
|
|
Type of Award
|
|
Term
|
|
Granted
|
|
|
in Yrs
|
|
|
Factor
|
|
Yield
|
|
Rate
|
|
Per Share
|
|
| |
|
|
|
|
|
|
|
|
|
|
|
|
|
|
|
|
|
|
Non-qualified stock options
|
|
2 Years
|
|
|
394,570 |
|
|
Ranging
from 1.375
to 1.5
|
|
|
Ranging
from 71.7%
to 105.5%
|
|
|
0%
|
|
Ranging
from 0.52%
to 0.71%
|
|
Ranging
from $1.29
to $2.08
|
|
| |
|
|
|
|
|
|
|
|
|
|
|
|
|
|
|
|
|
|
|
|
|
Non-qualified stock options
|
|
5 Years
|
|
|
200,000 |
|
|
3.5 |
|
|
64.6% |
|
|
0%
|
|
|
1.64% |
|
$2.11 |
|
| |
|
|
|
|
|
|
|
|
|
|
|
|
|
|
|
|
|
|
|
|
|
Non-qualified stock options
|
|
10 Years
|
|
|
51,200 |
|
|
6.25 |
|
|
60.6% |
|
|
0%
|
|
|
2.35% |
|
$2.60 |
|
| |
|
|
|
|
|
|
|
|
|
|
|
|
|
|
|
|
|
|
|
|
|
Total
|
|
|
|
|
645,770 |
|
|
|
|
|
|
|
|
|
|
|
|
|
|
|
For the March 2009 grant of 10-year stock options, we used a Lattice model to calculate fair value. The assumptions used in the lattice model for the March 2009 grant of 10-year stock options were as follows:
| |
|
|
|
Number
|
|
|
|
|
Expected
|
|
Expected
|
|
Risk-free
|
Fair
|
|
| |
|
Contractual
|
|
of Options
|
|
|
Suboptimal
|
|
Volatility
|
|
Dividend
|
|
Interest
|
Value
|
|
|
Type of Award
|
|
Term
|
|
Granted
|
|
|
Factor
|
|
Factor
|
|
Yield
|
|
Rate
|
Per Share
|
|
| |
|
|
|
|
|
|
|
|
|
|
|
|
|
|
|
|
Non-qualified stock options
|
|
10 Years
|
|
84,229 |
|
|
2 |
|
73.1% |
|
0% |
|
2.59% |
$ 1.97 |
|
The assumptions used in the calculation of fair value of the NQSOs granted on March 18, 2010, and May 12, 2010, using the Black-Scholes-Merton model for the expected term was as follows:
| |
|
|
|
|
|
|
Expected
|
|
Expected
|
|
Expected
|
|
Risk-Free
|
|
Weighted
Average
Fair
|
|
| |
|
|
|
Number of
|
|
|
Term in
|
|
Volatility
|
|
Dividend
|
|
Interest
|
|
Value Per
|
|
|
Type of Award
|
|
Term
|
|
Options Granted
|
|
|
Yrs
|
|
Factor
|
|
Yield
|
|
Rates
|
|
Share
|
|
| |
|
|
|
|
|
|
|
|
|
|
|
|
|
|
|
|
|
March 18, 2010 Non-qualified stock options
|
|
5 Years
|
|
150,000 |
|
|
3.50 |
|
63.1% |
|
|
0% |
|
|
1.77% |
|
$2.20 |
|
| |
|
|
|
|
|
|
|
|
|
|
|
|
|
|
|
|
|
|
|
May 12, 2010 Non-qualified stock options
|
|
5 Years
|
|
150,000 |
|
|
3.50 |
|
62.3% |
|
|
0% |
|
|
1.64% |
|
$2.21 |
|
| |
|
|
|
|
|
|
|
|
|
|
|
|
|
|
|
|
|
|
|
Total
|
|
|
|
300,000 |
|
|
|
|
|
|
|
|
|
|
|
|
$2.21 |
|
For the years ended December 31, 2010, December 31, 2009, and December 31, 2008, the Company recognized $2,088,091, $3,089,520 and $5,965,769 of compensation expense in the Consolidated Statement of Operations, respectively. As of December 31, 2010, there was approximately $3,698,345 of unrecognized compensation cost related to unvested stock option awards. This cost is expected to be recognized over a weighted-average period of approximately 1.4 years.
For the year ended December 31, 2010, a total of 18,571 options were exercised for total proceeds to the Company of $69,641. For the year ended December 31, 2009, a total of 112,520 options were exercised for total proceeds to the Company of $421,950. For the year ended December 31, 2008, no stock options were exercised.
The grant date fair value of options vested during the years ended December 31, 2010, December 31, 2009, and December 31, 2008, was $2,144,123, $3,821,871 and $6,779,996, respectively.
A summary of the changes in outstanding stock options for the year ended December 31, 2010, is as follows:
| |
|
|
|
|
|
|
|
Weighted
|
|
|
| |
|
|
|
Weighted
|
|
Weighted
|
|
Average
|
|
|
| |
|
|
|
Average
|
|
Average
|
|
Remaining
|
|
Aggregate
|
| |
|
|
|
Exercise
|
|
Grant Date
|
|
Contractual
|
|
Intrinsic
|
| |
|
Shares
|
|
Price
|
|
Fair Value
|
|
Term (Yrs)
|
|
Value
|
| |
|
|
|
|
|
|
|
|
|
|
|
Options Outstanding at January 1, 2010
|
|
4,184,503 |
|
$8.20 |
|
$4.79 |
|
6.24 |
|
$216,333 |
| |
|
|
|
|
|
|
|
|
|
|
|
Granted
|
|
300,000 |
|
$4.80 |
|
$2.21 |
|
4.29 |
|
|
| |
|
|
|
|
|
|
|
|
|
|
|
Exercised
|
|
(18,571) |
|
$3.75 |
|
$1.29 |
|
|
|
|
| |
|
|
|
|
|
|
|
|
|
|
|
Forfeited or Expired
|
|
(605,184) |
|
$11.48 |
|
$5.14 |
|
|
|
|
| |
|
|
|
|
|
|
|
|
|
|
|
Options Outstanding at December 31, 2010
|
|
3,860,748 |
|
$7.81 |
|
$4.76 |
|
5.60 |
|
$125,208 |
| |
|
|
|
|
|
|
|
|
|
|
|
Options Exercisable at December 31, 2010
|
|
2,638,005 |
|
$8.23 |
|
$5.05 |
|
5.51 |
|
$125,208 |
| |
|
|
|
|
|
|
|
|
|
|
|
Options Exercisable and Expected to be Exercisable at December 31, 2010
|
|
3,832,249 |
|
$7.79 |
|
$4.74 |
|
5.60 |
|
$125,208 |
The aggregate intrinsic value in the table above with respect to options outstanding, exercisable and expected to be exercisable, is calculated as the difference between the Company's closing stock price of $4.38 on the last trading day of 2010 and the exercise price, multiplied by the number of in-the-money options. This amount represents the total pre-tax intrinsic value that would have been received by the option holders had all options been fully vested and all option holders exercised their awards on December 31, 2010.
At December 31, 2010, there were 1,222,743 unvested options with a weighted average grant date fair value of $4.14. At December 31, 2009, there were 1,742,155 unvested options with a weighted average grant date fair value of $4.31. At December 31, 2008, there were 2,170,626 unvested options with a weighted average grant date fair value of $4.60.
During the year ended December 31, 2010, a total of 552,751 options vested having a weighted average grant date fair value of $3.88.
For the twelve months ended December 31, 2010, the aggregate intrinsic value of the 18,571 options exercised was $13,836. For the twelve months ended December 31, 2009, the aggregate intrinsic value of the 112,520 options exercised was $295,671. No options were exercised during 2008.
Unless earlier terminated by our Board of Directors, the Stock Plan will expire on May 4, 2016. The expiration of the Stock Plan will not by itself adversely affect the rights of plan participants under awards that are outstanding at the time the Stock Plan expires. Our Board of Directors may terminate, modify or suspend the plan at any time, provided that no modification of the plan will be effective unless and until any required shareholder approval has been obtained. The Compensation Committee may terminate, modify or amend any outstanding award under the Stock Plan at any time, provided that in such event, the award holder may exercise any vested options prior to such termination of the Stock Plan or award.
On June 2, 2010, the Company announced that its Compensation Committee has cancelled its previously scheduled meetings for the purpose of awarding stock options pursuant to the Stock Plan in 2010, and it will not award stock options for at least one year from the date of the announcement. The Compensation Committee also decided that any future grants of options, if they occur, will not be awarded at a price below net asset value per share.
NOTE 6. DISTRIBUTABLE EARNINGS
As of December 31, 2010, December 31, 2009, and December 31, 2008, there were no distributable earnings. The difference between the book basis and tax basis components of distributable earnings is primarily nondeductible deferred compensation and net operating losses.
The Company did not declare dividends for the years ended December 31, 2010, 2009 or 2008.
NOTE 7. EMPLOYEE BENEFITS
401(k) Plan
We adopted a 401(k) Plan covering substantially all of our employees. Matching contributions to the plan are at the discretion of the Compensation Committee. For the year ended December 31, 2010, the Compensation Committee approved a 100 percent match which amounted to $176,000. The 401(k) Company match for the years ended December 31, 2009, and 2008 was $181,200 and $180,500, respectively.
Medical Benefit Retirement Plan
We adopted a plan to provide medical and dental insurance for retirees and their spouses who, at the time of their retirement, have 10 years of service with us and have attained 50 years of age or have attained 45 years of age and have 15 years of service with us. The coverage is secondary to any government or subsequent employer provided health insurance plans. The annual premium cost to us with respect to the entitled retiree shall not exceed $12,000, subject to an index for inflation. On December 8, 2003, the Medicare Prescription Drug, Improvement and Modernization Act of 2003 (the "Act") was signed into law. The Act introduced a prescription drug benefit under Medicare (Medicare Part D) as well as a federal subsidy
to sponsors of retiree health care benefit plans that provide a benefit that is at least actuarially equivalent to Medicare Part D. The Act, which went into effect January 1, 2006, provides a 28 percent subsidy for post-65 prescription drug benefits. Our liability assumes our plan is actuarially equivalent under the Act.
The stock options of retirees who qualify for the Medical Benefit Retirement Plan will remain exercisable (to the extent exercisable at the time of the optionee’s termination) post retirement until the expiration of their term, if such retiree executes a post-termination non-solicitation agreement in a form reasonably acceptable to the Company.
The plan is unfunded and has no assets. The following disclosures about changes in the benefit obligation under our plan to provide medical and dental insurance for retirees are as of the measurement date of December 31:
| |
|
2010
|
|
|
2009
|
|
| |
|
|
|
|
|
|
|
Accumulated Postretirement Benefit Obligation at Beginning of Year
|
|
$ |
993,641 |
|
|
$ |
853,679 |
|
| |
|
|
|
|
|
|
|
|
|
Service Cost
|
|
|
119,939 |
|
|
|
113,450 |
|
| |
|
|
|
|
|
|
|
|
|
Interest Cost
|
|
|
55,662 |
|
|
|
47,629 |
|
| |
|
|
|
|
|
|
|
|
|
Actuarial (Gain)/Loss
|
|
|
(85,027 |
) |
|
|
7,285 |
|
| |
|
|
|
|
|
|
|
|
|
Benefits Paid
|
|
|
(29,340 |
) |
|
|
(28,402 |
) |
| |
|
|
|
|
|
|
|
|
Accumulated Postretirement Benefit Obligation at End of Year
|
|
$ |
1,054,875 |
|
|
$ |
993,641 |
|
In accounting for the plan, the assumption made for the discount rate was 5.68 percent and 5.72 percent for the years ended December 31, 2010, and 2009, respectively. The assumed health care cost trend rates in 2010 were nine percent grading to five percent over eight years for medical and five percent per year for dental. The assumed health care cost trend rates in 2009 were nine percent grading to six percent over three years for medical and five percent per year for dental. The effect on disclosure information of a one percentage point change in the assumed health care cost trend rate for each future year is shown below.
| |
|
1% Decrease
|
|
|
Assumed
|
|
|
1% Increase
|
|
| |
|
in Rates
|
|
|
Rates
|
|
|
in Rates
|
|
| |
|
|
|
|
|
|
|
|
|
|
Aggregated Service and Interest Cost
|
|
$ |
135,010 |
|
|
$ |
175,601 |
|
|
$ |
231,328 |
|
| |
|
|
|
|
|
|
|
|
|
|
|
|
|
Accumulated Postretirement Benefit Obligation
|
|
$ |
863,967 |
|
|
$ |
1,054,875 |
|
|
$ |
1,305,785 |
|
The net periodic postretirement benefit cost for the year is determined as the sum of service cost for the year, interest on the accumulated postretirement benefit obligation and amortization of the transition obligation (asset) less previously accrued expenses over the average remaining service period of employees expected to receive plan benefits. The following is the net periodic postretirement benefit cost for the years ended December 31, 2010, 2009, and 2008:
| |
|
2010
|
|
|
2009
|
|
|
2008
|
|
| |
|
|
|
|
|
|
|
|
|
|
Service Cost
|
|
$ |
119,939 |
|
|
$ |
113,450 |
|
|
$ |
86,497 |
|
| |
|
|
|
|
|
|
|
|
|
|
|
|
|
Interest Cost on Accumulated Postretirement Benefit Obligation
|
|
|
55,662 |
|
|
|
47,629 |
|
|
|
39,972 |
|
| |
|
|
|
|
|
|
|
|
|
|
|
|
|
Amortization of Transition Obligation
|
|
|
0 |
|
|
|
0 |
|
|
|
0 |
|
| |
|
|
|
|
|
|
|
|
|
|
|
|
|
Amortization of Net (Gain)/Loss
|
|
|
(2,863 |
) |
|
|
(4,103 |
) |
|
|
(11,215 |
) |
| |
|
|
|
|
|
|
|
|
|
|
|
|
|
Net Periodic Post Retirement Benefit Cost
|
|
$ |
172,738 |
|
|
$ |
156,976 |
|
|
$ |
115,254 |
|
The Company estimates the following benefits to be paid in each of the following years:
|
2011
|
|
$ |
16,129 |
|
|
2012
|
|
$ |
17,754 |
|
|
2013
|
|
$ |
19,435 |
|
|
2014
|
|
$ |
21,149 |
|
|
2015
|
|
$ |
23,727 |
|
|
2016 through 2020
|
|
$ |
189,461 |
|
For the year ended December 31, 2010, net unrecognized actuarial gains, which resulted from demographic changes, increased by $82,164, which represents $85,027 of actuarial gains arising during the year, net of a $2,863 reclassification adjustment which decreased the net periodic benefit cost for the year.
For the year ended December 31, 2009, net unrecognized actuarial losses, which resulted from the increase in the discount rate, decreased by $11,388, which represents $7,285 of actuarial losses arising during the year, net of a $4,103 reclassification adjustment which decreased the net periodic benefit cost for the year.
For the year ended December 31, 2008, net unrecognized actuarial losses, which resulted from the decrease in the discount rate, decreased by $120,527, which represents $109,312 of actuarial losses arising during the year, net of an $11,215 reclassification adjustment which decreased the net periodic benefit cost for the year.
Executive Mandatory Retirement Benefit Plan
On March 20, 2003, in order to begin planning for eventual management succession, the Board of Directors voted to establish the Executive Mandatory Retirement Benefit Plan for individuals who are employed by us in a bona fide executive or high policy-making position. The plan was amended and restated effective January 1, 2005, to comply with certain provisions of the Code. On an annual basis beginning in the year in which the designated individual attains the age of 65, a committee of the Board of Directors consisting of non-interested directors may determine for our benefit to postpone the mandatory retirement date for that individual for one additional year.
Under applicable law prohibiting discrimination in employment on the basis of age, we can impose a mandatory retirement age of 65 for our executives or employees in high policy-making positions only if each employee subject to the mandatory retirement age is entitled to an immediate retirement benefit at retirement age of at least $44,000 per year. The plan was established to provide the difference between the benefit required under the age discrimination laws and that provided under our existing plans. For individuals retiring after January 1, 2009, the benefit under the plan is paid to the qualifying individual in the form of a lump sum within 60 days after the participant's separation from service.
There are currently two individuals that qualify under the plan: Douglas W. Jamison, the Chairman and Chief Executive Officer, and Daniel B. Wolfe, the President. Under this plan, mandatory retirement takes place effective December 31 of the year in which the eligible individuals attain the age of 65.
Our former President, Mel Melsheimer, and our former Chief Executive Officer, Charles E. Harris, accrued benefits under this plan prior to their retirements. This benefit is unfunded, and the expense as it relates to Mr. Melsheimer and Mr. Harris was amortized over the fiscal periods through the years ended December 31, 2004, and 2008, respectively. On December 31, 2004, Mr. Melsheimer retired pursuant to the Executive Mandatory Retirement Benefit Plan. His annual benefit under the plan is $22,915. On December 31, 2008, Mr. Harris retired pursuant to the Executive Mandatory Retirement Benefit Plan. Mr. Harris's mandatory benefit was $151,443 and was paid as a lump sum on July 10, 2009.
At December 31, 2010, and 2009, we had accrued $216,622 and $222,958, respectively, for benefits under this plan. At December 31, 2010, $216,622 was accrued for Mr. Melsheimer. As of December 31, 2010, there is no accrual for Mr. Jamison or Mr. Wolfe.
NOTE 8. INCOME TAXES
We filed for the 1999 tax year to elect treatment as a RIC under Subchapter M of the Code and qualified for the same treatment for the years 2000 through 2009. However, there can be no assurance that we will qualify as a RIC for 2010 or subsequent years.
In the case of a RIC which furnishes capital to development corporations, there is an exception to the rule relating to the diversification of investments required to qualify for RIC treatment. This exception is available only to registered investment companies that the SEC determines to be principally engaged in the furnishing of capital to other corporations which are principally engaged in the development or exploitation of inventions, technological improvements, new processes, or products not previously generally available ("SEC Certification"). We have received SEC Certification since 1999, including for 2009, but it is possible that we may not receive SEC Certification in future years.
In addition, under certain circumstances, even if we qualified for Subchapter M treatment for a given year, we might take action in a subsequent year to ensure that we would be taxed in that subsequent year as a C Corporation, rather than as a RIC. As a RIC, we must, among other things, distribute at least 90 percent of our investment company taxable income and may either distribute or retain our realized net capital gains on investments.
Provided that a proper election is made, a corporation taxable under Subchapter C of the Code or a C Corporation that elects to qualify as a RIC continues to be taxable as a C Corporation on any gains realized within 10 years of its qualification as a RIC (the "Inclusion Period") from sales of assets that were held by the corporation on the effective date of the RIC election ("C Corporation Assets"), to the extent of any gain built into the assets on such date ("Built-In Gain"). If the corporation fails to make a proper election, it is taxable on its Built-In Gain as of the effective date of its RIC election. We had Built-In Gains at the time of our qualification as a RIC and made the election to be taxed on any Built-In Gain realized during
the Inclusion Period.
For federal tax purposes, the Company’s 2007 through 2010 tax years remain open for examination by the tax authorities under the normal three year statute of limitations. Generally, for state tax purposes, the Company’s 2006 through 2010 tax years remain open for examination by the tax authorities under a four year statute of limitations.
During 2010, the Company recorded a consolidated expense of $4,461 in federal, state and local income taxes. At December 31, 2010, we had $0 accrued for federal, state and local taxes payable by the Company.
We pay federal, state and local taxes on behalf of our wholly owned subsidiary, Harris & Harris Enterprises, Inc., which is taxed as a C Corporation. For the years ended December 31, 2010, 2009, and 2008, our income tax expense (benefit) for Harris & Harris Enterprises, Inc., was $2,660, $(2,960), and $16,528, respectively.
Tax (benefit) expense included in the Consolidated Statement of Operations consists of the following:
| |
|
2010
|
|
|
2009
|
|
|
2008
|
|
| |
|
|
|
|
|
|
|
|
|
|
Current
|
|
$ |
4,461 |
|
|
$ |
(753 |
) |
|
$ |
34,121 |
|
| |
|
|
|
|
|
|
|
|
|
|
|
|
|
Total income tax expense (benefit)
|
|
$ |
4,461 |
|
|
$ |
(753 |
) |
|
$ |
34,121 |
|
For the years ended December 31, 2010, 2009, and 2008, we paid $0, $0 and $706, respectively, in interest and penalties. At December 31, 2010, we had capital loss carryforwards of $27,958,518, of which $5,386,947 expire in 2016, $12,610,867 expire in 2017 and $9,960,704 expire in 2018. As of December 31, 2010, we also had post-October capital loss deferrals of $190,902.
Continued qualification as a RIC requires us to satisfy certain investment asset diversification requirements in future years. Our ability to satisfy those requirements may not be controllable by us. There can be no assurance that we will qualify as a RIC in subsequent years.
NOTE 9. COMMITMENTS AND CONTINGENCIES
On January 21, 2010, we moved our corporate headquarters from 111 West 57th Street in New York City to 1450 Broadway in New York City. The lease and sublease for our offices at 111 West 57th Street expired on April 17, 2010 and on April 29, 2010, respectively. Total rent expense for the office space at 111 West 57th Street was $57,951 in 2010, $191,399 in 2009 and $186,698 in 2008. Our rent expense in 2010 of $57,951 includes $47,094 of real estate tax escalation charges from 2003 to 2010 paid on the
office space at 111 West 57th Street.
On July 1, 2008, we signed a five-year lease for office space at 420 Florence Street, Suite 200, Palo Alto, California, commencing on August 1, 2008, and expiring on August 31, 2013. Total rent expense for our office space in Palo Alto was $128,962 in 2010, $125,205 in 2009 and $51,525 in 2008. Future minimum lease payments in each of the following years are: 2011 - $132,831; 2012 - $136,816 and 2013 - $93,135.
On September 24, 2009, we signed a ten-year lease for approximately 6,900 square feet of office space located at 1450 Broadway, New York, New York. The lease commenced on January 21, 2010, with these offices replacing our corporate headquarters previously located at 111 West 57th Street in New York City. The base rent is $36 per square foot with a 2.5 percent increase per year over the 10 years of the lease, subject to a full abatement of rent for four months and a rent credit for six months throughout the lease term. The lease expires on December 31, 2019. Total rent expense for this office space in New York City was $215,319 in
2010. Future minimum lease payments in each of the following years are: 2011 - $188,756; 2012 - $236,768; 2013 - $242,688; 2014 - $248,755; 2015 - $278,394; and thereafter for the remaining term – an aggregate of $1,184,689.
We have one option to extend the lease term for a five-year period, provided that we are not in default under the lease. Annual rent during the renewal period will equal 95 percent of the fair market value of the leased premises, as determined in accordance with the lease. Upon an event of default, the lease provides that the landlord may terminate the lease and require us to pay all rent that would have been payable during the remainder of the lease or until the date the landlord re-enters the premises.
In the ordinary course of business, we indemnify our officers and directors, subject to certain regulatory limitations, for loss or liability related to their service on behalf of the Company, including serving on the Boards of Directors or as officers of portfolio companies. At December 31, 2010, and 2009, we believe our estimated exposure is minimal, and accordingly we have no liability recorded.
NOTE 10. CAPITAL TRANSACTIONS
On June 20, 2008, we completed the sale of 2,545,000 shares of our common stock for gross proceeds of $15,651,750; net proceeds of this offering, after placement agent fees and offering costs of $1,268,253, were $14,383,497.
On October 9, 2009, we closed a public follow-on offering of 4,887,500 shares of our common stock at a price of $4.75 per share to the public. The net proceeds of this offering, after deducting underwriting discounts and offering costs of $2,000,413, were $21,215,212.
NOTE 11. CHANGE IN NET ASSETS PER SHARE
The following table sets forth the computation of basic and diluted per share net increases (decreases) in net assets resulting from operations for the twelve months ended December 31, 2010, 2009, and 2008.
| |
|
2010
|
|
|
2009
|
|
|
2008
|
|
|
Numerator for increase (decrease) in net assets per share
|
|
$ |
10,586,850 |
|
|
$ |
(148,465 |
) |
|
$ |
(49,181,497 |
) |
| |
|
|
|
|
|
|
|
|
|
|
|
|
|
Denominator for basic weighted average shares
|
|
|
30,866,239 |
|
|
|
27,025,995 |
|
|
|
24,670,516 |
|
| |
|
|
|
|
|
|
|
|
|
|
|
|
|
Basic net increase (decrease) in net assets per share resulting from operations
|
|
$ |
0.34 |
|
|
$ |
(0.01 |
) |
|
$ |
(1.99 |
) |
| |
|
|
|
|
|
|
|
|
|
|
|
|
|
Denominator for diluted weighted average shares
|
|
|
30,896,630 |
|
|
|
27,025,995 |
|
|
|
24,670,516 |
|
| |
|
|
|
|
|
|
|
|
|
|
|
|
|
Diluted net increase (decrease) in net assets per share resulting from operations
|
|
$ |
0.34 |
|
|
$ |
(0.01 |
) |
|
$ |
(1.99 |
) |
For the twelve months ended December 31, 2010, the calculation of net increase in net assets resulting from operations per diluted share includes 30,391 stock options from the March 2009 grant because such options were dilutive. All other options granted in the period from June 2006 through May 2010 were anti-dilutive. Stock options may be dilutive in future periods in which there is a net increase in net assets resulting from operations, or in the event that there are significant increases in the average stock price in the stock market or significant decreases in the amount of unrecognized compensation cost.
NOTE 12. SUBSEQUENT EVENTS
On January 13, 2011, the Company received a warrant to purchase 86,102 shares of Series G Preferred Stock of BioVex Group, Inc., in connection with a contingent equity facility.
On January 24, 2011, BioVex Group, Inc., entered into a definitive acquisition agreement with Amgen, Inc., for the acquisition of BioVex Group, Inc. On March 4, 2011, the transaction was completed. On March 11, 2011, the Company received its upfront payment of $7,702,470, which did not include $958,296 held in escrow. On December 31, 2010, the value of our investment in BioVex was $11,430,062, which included the upfront payment and certain discounts applied to future escrow and milestone payments BioVex may be eligible to receive.
On January 26, 2011, the Company made an $813,805 follow-on investment in a privately held tiny technology portfolio company.
On February 2, 2011, NeoPhotonics Corporation priced its IPO of 7,500,000 shares of common stock at $11 per share. Our investment was converted into 400,907 shares of common stock. These shares are subject to a lock-up period of 180 days. We purchased an additional 50,000 shares of common stock in the IPO. At December 31, 2010, the value of our investment in NeoPhotonics was $4,249,615. On March 14, 2011, the closing price of NeoPhotonics' common stock was $9.88 per share on the New York Stock Exchange.
On February 22, 2011, the Company made a $750,000 investment in a senior secured non-convertible debt security of Nano-Terra, Inc., that included warrants for the purchase of 446,248 shares of Series A-2 Preferred Stock of Nano-Terra, Inc.
On February 24, 2011, the Company established a new $10 million three-year revolving credit facility with TD Bank, N.A., to be used in conjunction with its investments in venture debt. The facility, which matures on February 24, 2014, generally bears interest, at the Company’s option, based on (1) LIBOR plus 1.25 percent or (2) the higher of the federal funds rate plus fifty basis points (0.50 percent) or the U.S. prime rate as published in the Wall Street Journal.
On February 28, 2011, the Company completed a draw down of $1,250,000 from its $10 million credit facility to fund our investments in venture debt. As of March 15, 2011, we had $1,400,000 in outstanding principal in venture debt investments.
On February 28, 2011, the Company sold its 612,061 shares of Series S-2 Convertible Preferred Stock of Siluria Technologies, Inc., for an amount not materially different from the value of the shares as of December 31, 2010.
On March 1, 2011, the Company made a $150,000 follow-on investment in a subordinated secured non-convertible debt security of GEO Semiconductor, Inc., that included warrants for the purchase of 10,000 shares of Series A Preferred Stock.
On March 3, 2011, the Company made a $272,369 follow-on investment in a privately held tiny technology portfolio company.
On March 11, 2011, Solazyme, Inc., filed a registration statement on Form S-1 to register its shares of common stock for an IPO. There can be no assurance that this company will successfully complete an IPO, and a variety of factors, including stock market and general business conditions, could lead it to terminate such efforts to complete an IPO.
NOTE 13. SELECTED QUARTERLY DATA (UNAUDITED)
| |
|
2010
|
|
| |
|
1st Quarter
|
|
|
2nd Quarter
|
|
|
3rd Quarter
|
|
|
4th Quarter
|
|
| |
|
|
|
|
|
|
|
|
|
|
|
|
|
Total investment (loss) income
|
|
$ |
79,073 |
|
|
$ |
129,208 |
|
|
$ |
140,445 |
|
|
$ |
97,312 |
|
| |
|
|
|
|
|
|
|
|
|
|
|
|
|
|
|
|
|
Net operating loss
|
|
$ |
(2,112,678 |
) |
|
$ |
(1,953,949 |
) |
|
$ |
(1,768,864 |
) |
|
$ |
(1,720,316 |
) |
| |
|
|
|
|
|
|
|
|
|
|
|
|
|
|
|
|
|
Net increase (decrease) in net assets resulting from operations
|
|
$ |
1,687,731 |
|
|
$ |
2,150,952 |
|
|
$ |
(454,032 |
) |
|
$ |
7,202,199 |
|
| |
|
|
|
|
|
|
|
|
|
|
|
|
|
|
|
|
|
Net increase (decrease) in net assets resulting from operations per average outstanding share
|
|
$ |
0.05 |
|
|
$ |
0.07 |
|
|
$ |
(0.01 |
) |
|
$ |
0.23 |
|
| |
|
|
|
|
|
|
|
|
|
|
|
|
|
|
|
|
| |
|
2009
|
|
| |
|
1st Quarter
|
|
|
2nd Quarter
|
|
|
3rd Quarter
|
|
|
4th Quarter
|
|
| |
|
|
|
|
|
|
|
|
|
|
|
|
|
|
|
|
|
Total investment (loss) income
|
|
$ |
(23,561 |
) |
|
$ |
83,834 |
|
|
$ |
105,677 |
|
|
$ |
81,898 |
|
| |
|
|
|
|
|
|
|
|
|
|
|
|
|
|
|
|
|
Net operating loss
|
|
$ |
(2,098,879 |
) |
|
$ |
(1,998,271 |
) |
|
$ |
(2,242,953 |
) |
|
$ |
(2,421,112 |
) |
| |
|
|
|
|
|
|
|
|
|
|
|
|
|
|
|
|
|
Net (decrease) increase in net assets resulting from operations
|
|
$ |
(951,424 |
) |
|
$ |
421,367 |
|
|
$ |
(296,319 |
) |
|
$ |
677,911 |
|
| |
|
|
|
|
|
|
|
|
|
|
|
|
|
|
|
|
|
Net (decrease) increase in net assets resulting from operations per average outstanding share
|
|
$ |
(0.04 |
) |
|
$ |
0.02 |
|
|
$ |
(0.01 |
) |
|
$ |
0.02 |
|
|
HARRIS & HARRIS GROUP, INC.
FINANCIAL HIGHLIGHTS
|
| |
|
Year Ended
|
|
|
Year Ended
|
|
|
Year Ended
|
|
| |
|
December 31, 2010
|
|
|
December 31, 2009
|
|
|
December 31, 2008
|
|
| |
|
|
|
|
|
|
|
|
|
|
Per Share Operating Performance
|
|
|
|
|
|
|
|
|
|
| |
|
|
|
|
|
|
|
|
|
|
Net asset value per share, beginning of year
|
|
$ |
4.35 |
|
|
$ |
4.24 |
|
|
$ |
5.93 |
|
| |
|
|
|
|
|
|
|
|
|
|
|
|
|
Net operating loss*
|
|
|
(0.25 |
) |
|
|
(0.32 |
) |
|
|
(0.43 |
) |
|
Net realized loss on investments*
|
|
|
(0.12 |
) |
|
|
(0.42 |
) |
|
|
(0.34 |
) |
|
Net decrease in unrealized depreciation as a result of sales*
|
|
|
0.12 |
|
|
|
0.41 |
|
|
|
0.34 |
|
|
Net decrease (increase) in unrealized depreciation on investments held*(1)
|
|
|
0.59 |
|
|
|
0.32 |
|
|
|
(1.49 |
) |
|
Total from investment operations*
|
|
|
0.34 |
|
|
|
(0.01 |
) |
|
|
(1.92 |
) |
| |
|
|
|
|
|
|
|
|
|
|
|
|
|
Net increase as a result of stock-based compensation expense*
|
|
|
0.07 |
|
|
|
0.11 |
|
|
|
0.24 |
|
|
Net increase as a result of proceeds from exercise of options
|
|
|
0.00 |
|
|
|
0.00 |
|
|
|
0.00 |
|
|
Net increase (decrease) as a result of stock offering, net of offering expenses
|
|
|
0.00 |
|
|
|
0.01 |
|
|
|
(0.01 |
) |
|
Total increase from capital stock transactions
|
|
|
0.07 |
|
|
|
0.12 |
|
|
|
0.23 |
|
| |
|
|
|
|
|
|
|
|
|
|
|
|
|
Net asset value per share, end of year
|
|
$ |
4.76 |
|
|
$ |
4.35 |
|
|
$ |
4.24 |
|
| |
|
|
|
|
|
|
|
|
|
|
|
|
|
Stock price per share, end of year
|
|
$ |
4.38 |
|
|
$ |
4.57 |
|
|
$ |
3.95 |
|
| |
|
|
|
|
|
|
|
|
|
|
|
|
|
Total return based on stock price
|
|
|
(4.16 |
)% |
|
|
15.7 |
% |
|
|
(55.06 |
)% |
| |
|
|
|
|
|
|
|
|
|
|
|
|
|
Supplemental Data:
|
|
|
|
|
|
|
|
|
|
|
|
|
| |
|
|
|
|
|
|
|
|
|
|
|
|
|
Net assets, end of year
|
|
$ |
146,853,912 |
|
|
$ |
134,158,258 |
|
|
$ |
109,531,113 |
|
| |
|
|
|
|
|
|
|
|
|
|
|
|
|
Ratio of expenses to average net assets
|
|
|
5.7 |
% |
|
|
7.8 |
% |
|
|
9.6 |
% |
| |
|
|
|
|
|
|
|
|
|
|
|
|
|
Ratio of net operating loss to average net assets
|
|
|
(5.4 |
)% |
|
|
(7.6 |
)% |
|
|
(8.1 |
)% |
| |
|
|
|
|
|
|
|
|
|
|
|
|
|
Cash dividends paid per share
|
|
$ |
0.00 |
|
|
$ |
0.00 |
|
|
$ |
0.00 |
|
| |
|
|
|
|
|
|
|
|
|
|
|
|
|
Taxes payable on behalf of shareholders on the deemed dividend per share
|
|
$ |
0.00 |
|
|
$ |
0.00 |
|
|
$ |
0.00 |
|
| |
|
|
|
|
|
|
|
|
|
|
|
|
|
Number of shares outstanding, end of year
|
|
|
30,878,164 |
|
|
|
30,859,593 |
|
|
|
25,859,573 |
|
*Based on average shares outstanding.
(1) Net unrealized gains (losses) includes rounding adjustments to reconcile change in net asset value per share. See Item 7. "Management's Discussion and Analysis of Financial Condition and Results of Operations" for a description of unrealized losses on investments.
The accompanying notes are an integral part of this schedule.
Item 9. Changes in and Disagreements With Accountants on Accounting and Financial Disclosure.
Item 9A. Controls and Procedures.
Disclosure Controls and Procedures
As of the end of the period covered by this report, the Company’s management, under the supervision and with the participation of our chief executive officer and chief financial officer, conducted an evaluation of the effectiveness of the design and operation of our disclosure controls and procedures (as required by Rules 13a-15 of the Exchange Act). Disclosure controls and procedures means controls and other procedures of an issuer that are designed to ensure that information required to be disclosed by the issuer in the reports that it files or submits under the Exchange Act is recorded, processed, summarized and reported, within time periods specified in the SEC's rules and forms, and that such information is accumulated and communicated to the
issuer's management, as appropriate, to allow timely decisions regarding required disclosures. As of December 31, 2010, based upon this evaluation of our disclosure controls and procedures, our chief executive officer and chief financial officer concluded that our disclosure controls and procedures were effective.
Internal Control Over Financial Reporting
Management's Report on Internal Control Over Financial Reporting and the Report of Independent Registered Public Accounting Firm, on the Company’s internal control over financial reporting, is included in Item 8 of this Annual Report on Form 10-K.
Changes in Internal Control Over Financial Reporting
There have not been any changes in the Company's internal control over financial reporting (as such term is defined in Rules 13a-15(f) and 15d-15(f) under the Exchange Act) during the fourth quarter of 2010 to which this report relates that have materially affected, or are reasonably likely to materially affect, the Company’s internal control over financial reporting.
Item 9B. Other Information.
None.
PART III
Item 10. Directors, Executive Officers and Corporate Governance.
The information set forth under the captions "Nominees," "Executive Officers," "Section 16(a) Beneficial Ownership Reporting Compliance" and "Audit Committee" in our Proxy Statement for the Annual Meeting of Shareholders to be held May 5, 2011, to be filed pursuant to Regulation 14A under the Exchange Act (the "2011 Proxy Statement"), is herein incorporated by reference.
We have adopted a Code of Conduct for Directors and Employees, which also applies to our Chief Executive Officer, Chief Financial Officer, Chief Accounting Officer, Treasurer and Controller, which is posted on our website at http://www.hhvc.com/shareholder_information/Code_of_ Conduct.html.
The Board of Directors has determined that Dugald A. Fletcher, James E. Roberts and Richard P. Shanley are all "Audit Committee Financial Experts" serving on our Audit Committee. Messrs. Fletcher, Roberts and Shanley are independent as defined under Section 2(a)(19) of the 1940 Act and under the rules of the Nasdaq Stock Market.
Item 11. Executive Compensation.
The information set forth under the captions "Executive Compensation," "Compensation Committee Interlocks and Insider Participation" and "Compensation Committee Report on Executive Compensation" in the 2011 Proxy Statement is herein incorporated by reference.
|
Item 12.
|
Security Ownership of Certain Beneficial Owners and Management and Related Stockholder Matters.
|
The information set forth under the caption "How Many Shares Do the Company's Principal Shareholders, Directors and Executive Officers Own?" in the 2011 Proxy Statement is herein incorporated by reference. The "Equity Compensation Plan Information" chart is set forth herein under Item 5.
Item 13. Certain Relationships and Related Transactions, and Director Independence.
The information set forth under the captions "Nominees" and "Related Party Transactions" in the 2011 Proxy Statement is herein incorporated by reference.
Item 14. Principal Accountant Fees and Services.
The information set forth under the captions "Audit Committee's Pre-Approval Policies" and "Fees Paid to PwC for 2010 and 2009" in the 2011 Proxy Statement is herein incorporated by reference.
PART IV
Item 15. Exhibits and Financial Statements Schedules.
|
(a)
|
The following documents are filed as a part of this report:
|
| |
(1)
|
Listed below are the financial statements which are filed as part of this report:
|
|
|
·
|
Consolidated Statements of Assets and Liabilities as of December 31, 2010, and 2009;
|
|
|
·
|
Consolidated Statement of Operations for the years ended December 31, 2010, 2009, and 2008;
|
|
|
·
|
Consolidated Statements of Cash Flows for the years ended December 31, 2010, 2009, and 2008;
|
|
|
·
|
Consolidated Statements of Changes in Net Assets for the years ended December 31, 2010, 2009, and 2008;
|
|
|
·
|
Consolidated Schedule of Investments as of December 31, 2010;
|
|
|
·
|
Consolidated Schedule of Investments as of December 31, 2009;
|
|
|
·
|
Footnote to Consolidated Schedule of Investments;
|
|
|
·
|
Notes to Consolidated Financial Statements; and
|
|
|
·
|
Financial Highlights for the years ended December 31, 2010, 2009, and 2008.
|
|
|
(2)
|
No financial statement schedules are required to be filed herewith because (i) such schedules are not required or (ii) the information has been presented in the above financial statements.
|
|
|
(3)
|
The following exhibits are filed with this report or are incorporated herein by reference to a prior filing, in accordance with Rule 12b-32 under the Exchange Act.
|
|
|
3.1(a)*
|
Restated Certificate of Incorporation of Harris & Harris Group, Inc.
|
|
|
3.1(b)
|
Certificate of Amendment of the Certificate of Incorporation of Harris & Harris Group, Inc., dated May 19, 2006, incorporated by reference as Exhibit 3.1 to the Company's Form 10-Q (File No. 814-00176) filed on August 9, 2006.
|
|
|
3.1(c)
|
Certificate of Change of the Certificate of Incorporation of Harris & Harris Group, Inc., dated August 5, 2010, incorporated by reference as Exhibit 3 to Form 8-K (File No. 814-00176) filed on August 6, 2010.
|
|
|
3.2
|
Restated By-laws, incorporated by reference as Exhibit 3.2 to the Company's Annual Report on Form 10-K for the year ended December 31, 2008 (File No. 814-00176) filed on March 16, 2009.
|
|
|
4
|
Form of Specimen Certificate of Common Stock, incorporated by reference as Exhibit 4 to the Company's Annual Report on Form 10-K for the year ended December 31, 2008 (File No. 814-00176) filed on March 16, 2009.
|
|
|
10.1
|
Harris & Harris Group, Inc. Form of Custody Agreement with The Bank of New York Mellon, incorporated by reference as Exhibit 10.1 to the Company's Annual Report on Form 10-K for the year ended December 31, 2008 (File No. 814-00176) filed on March 16, 2009.
|
|
|
10.2
|
Form of Indemnification Agreement which has been established with all directors and executive officers of the Company, incorporated by reference as Exhibit 10.2 to the Company's Annual Report on Form 10-K for the year ended December 31, 2008 (File No. 814-00176) filed on March 16, 2009.
|
|
|
10.3
|
Harris & Harris Group, Inc. 2006 Equity Incentive Plan, incorporated by reference as Appendix B to the Company's Proxy Statement for the 2006 Annual Meeting of Shareholders filed on April 3, 2006.
|
|
|
10.4
|
Form of Incentive Stock Option Agreement incorporated by reference as Exhibit 10.1 to the Company's Form 8-K (File No. 814-00176) filed on June 26, 2006.
|
|
|
10.5
|
Form of Non-Qualified Stock Option Agreement, incorporated by reference as Exhibit 10.11 to the Company's Annual Report on Form 10-K for the year ended December 31, 2008 (File No. 814-00176) filed on March 16, 2009.
|
|
|
10.6
|
Amended and Restated Harris & Harris Group, Inc. Executive Mandatory Retirement Benefit Plan, dated November 5, 2009, incorporated by reference as Exhibit 10.1 to the Company’s Form 8-K (File No. 814-00176) filed on November 12, 2009.
|
|
|
10.7
|
Agreement of Sub-Sublease, dated April 18, 2003, by and between Prominent USA, Inc. and Harris & Harris Group, Inc., incorporated by reference as Exhibit 10.17 to the Company's Form 10-K for the year ended December 31, 2007 (File No. 814-00176) filed on March 13, 2008.
|
|
|
10.8
|
Amendment to Agreement of Sub-Sublease, dated May 9, 2003, by and between Prominent USA, Inc., and Harris & Harris Group, Inc., incorporated by reference as Exhibit 10.18 to the Company's Form 10-K for the year ended December 31, 2007 (File No. 814-00176) filed on March 13, 2008.
|
|
|
10.9
|
Assignment and Assumption, Modification and Extension of Sublease Agreement, dated December 17, 2004, by and among the Economist Newspaper Group, Inc., National Academy of Television Arts & Sciences, and Harris & Harris Group, Inc., incorporated by reference as Exhibit 10.19 to the Company's Form 10-K for the year ended December 31, 2007 (File No. 814-00176) filed on March 13, 2008.
|
|
|
10.10
|
Lease dated July 1, 2008 by and between Jack Rominger, Tommie Plemons and Dale Denson as Lessor and Harris & Harris Group, Inc., a New York corporation, as Lessee, incorporated by reference as Exhibit 10.1 to the Company's Form 10-Q (File No. 814-00176) filed on November 7, 2008.
|
|
|
10.11
|
Lease Agreement, dated September 24, 2009, between Rosh 1450 Properties LLC and Harris & Harris Group, Inc., incorporated by reference as Exhibit 10.1 to the Company’s Form 8-K (File No. 814-00176) filed on September 24, 2009.
|
|
|
10.12
|
Harris & Harris Group, Inc. Employee Stock Purchase Plan, incorporated by reference as Exhibit 10.14 to the Company's Form 10-K for the year ended December 31, 2009 (File No. 814-00176) filed on March 15, 2010.
|
|
|
14.1
|
Code of Conduct for Directors and Employees of Harris & Harris Group, Inc., incorporated by reference as Exhibit 14.1 to the Company's Form 10-K for the year ended December 31, 2009 (File No. 814-00176) filed on March 15, 2010.
|
|
|
31.01*
|
Certification of CEO pursuant to Section 302 of the Sarbanes-Oxley Act of 2002.
|
|
|
31.02*
|
Certification of CFO pursuant to Section 302 of the Sarbanes-Oxley Act of 2002.
|
|
|
32.01*
|
Certification of CEO and CFO pursuant to 18 U.S.C. Section 1350, as adopted pursuant to Section 906 of the Sarbanes-Oxley Act of 2002.
|
*Filed herewith
SIGNATURES
Pursuant to the requirements of Section 13 or 15(d) of the Securities Exchange Act of 1934, the Company has duly caused this report to be signed on its behalf by the undersigned, thereunto duly authorized.
| |
HARRIS & HARRIS GROUP, INC.
|
| |
|
|
Date: March 15, 2011
|
By:
|
/s/ Douglas W. Jamison
|
| |
|
Douglas W. Jamison
|
| |
|
Chairman of the Board and
|
| |
|
Chief Executive Officer
|
Pursuant to the requirements of the Securities Exchange Act of 1934, this report has been signed below by the following persons on behalf of the Company and in the capacities and on the dates indicated.
|
Signatures
|
|
Title
|
|
Date
|
| |
|
|
|
|
|
/s/ Douglas W. Jamison
|
|
Chairman of the Board
|
|
March 15, 2011
|
|
Douglas W. Jamison
|
|
and Chief Executive Officer
|
|
|
| |
|
|
|
|
|
/s/ Daniel B. Wolfe
|
|
Chief Financial Officer
|
|
March 15, 2011
|
|
Daniel B. Wolfe
|
|
|
|
|
| |
|
|
|
|
|
/s/ Patricia N. Egan
|
|
Chief Accounting Officer
|
|
March 15, 2011
|
|
Patricia N. Egan
|
|
and Senior Controller
|
|
|
| |
|
|
|
|
|
/s/ W. Dillaway Ayres, Jr.
|
|
Director
|
|
March 15, 2011
|
|
W. Dillaway Ayres, Jr.
|
|
|
|
|
| |
|
|
|
|
|
/s/ C. Wayne Bardin
|
|
Director
|
|
March 15, 2011
|
|
C. Wayne Bardin
|
|
|
|
|
|
|
|
Director
|
|
March 15, 2011
|
|
Phillip A. Bauman
|
|
|
|
|
| |
|
|
|
|
|
/s/ G. Morgan Browne
|
|
Director
|
|
March 15, 2011
|
|
G. Morgan Browne
|
|
|
|
|
| |
|
|
|
|
|
/s/ Dugald A. Fletcher
|
|
Director
|
|
March 15, 2011
|
|
Dugald A. Fletcher
|
|
|
|
|
| |
|
|
|
|
|
/s/ Lucio L. Lanza
|
|
Director
|
|
March 15, 2011
|
|
Lucio L. Lanza
|
|
|
|
|
| |
|
|
|
|
|
/s/ Lori D. Pressman
|
|
Director
|
|
March 15, 2011
|
|
Lori D. Pressman
|
|
|
|
|
| |
|
|
|
|
|
/s/ Charles E. Ramsey
|
|
Director
|
|
March 15, 2011
|
|
Charles E. Ramsey
|
|
|
|
|
| |
|
|
|
|
|
/s/ James E. Roberts
|
|
Director
|
|
March 15, 2011
|
|
James E. Roberts
|
|
|
|
|
| |
|
|
|
|
|
/s/ Richard P. Shanley
|
|
Director
|
|
March 15, 2011
|
|
Richard P. Shanley
|
|
|
|
|