UNITED STATES
SECURITIES AND EXCHANGE COMMISSION
WASHINGTON, D. C. 20549
Form 10-Q
x QUARTERLY REPORT PURSUANT TO SECTION 13 OR 15(d) OF THE SECURITIES EXCHANGE ACT OF 1934
For the quarterly period ended March 31, 2011
¨ TRANSITION REPORT PURSUANT TO SECTION 13 OR 15(d) OF THE SECURITIES EXCHANGE ACT OF 1934
For the transition period from ____________ to _____________
Commission file number: 0-11576
|
HARRIS & HARRIS GROUP, INC.
|
|
(Exact Name of Registrant as Specified in Its Charter)
|
|
New York
|
13-3119827
|
|
(State or Other Jurisdiction of
|
(I.R.S. Employer Identification No.)
|
|
Incorporation or Organization)
|
|
|
1450 Broadway, New York, New York
|
10018
|
|
(Address of Principal Executive Offices)
|
(Zip Code)
|
|
(212) 582-0900
|
|
(Registrant's Telephone Number, Including Area Code)
|
Indicate by check mark whether the registrant: (1) has filed all reports required to be filed by Section 13 or 15(d) of the Securities Exchange Act of 1934 during the preceding 12 months (or for such shorter period that the registrant was required to file such reports), and (2) has been subject to such filing requirements for the past 90 days.
Yes x No ¨
Indicate by check mark whether the registrant has submitted electronically and posted on its corporate Web site, if any, every Interactive Data File required to be submitted and posted pursuant to Rule 405 of Regulation S-T during the preceding 12 months (or for such shorter period that the registrant was required to submit and post such files).
Yes x No ¨
Indicate by check mark whether the registrant is a large accelerated filer, an accelerated filer, a non-accelerated filer, or a smaller reporting company. See the definitions of "large accelerated filer," "accelerated filer" and "smaller reporting company" in Rule 12b-2 of the Exchange Act. (Check one):
|
Large accelerated filer ¨
|
Accelerated filer x
|
|
Non-accelerated filer ¨
|
Smaller reporting company ¨
|
(Do not check if a smaller reporting company)
Indicate by check mark whether the registrant is a shell company (as defined in Rule 12b-2 of the Exchange Act).
Yes ¨ No x
Indicate the number of shares outstanding of each of the issuer's classes of common stock, as of the latest practicable date.
|
Class
|
Outstanding at May 10, 2011
|
|
Common Stock, $0.01 par value per share
|
31,000,601 shares
|
Harris & Harris Group, Inc.
Form 10-Q, March 31, 2011
| |
Page Number
|
|
PART I. FINANCIAL INFORMATION
|
|
|
| |
|
|
|
Item 1. Consolidated Financial Statements
|
1
|
|
| |
|
|
|
Consolidated Statements of Assets and Liabilities
|
2
|
|
|
Consolidated Statements of Operations
|
3
|
|
|
Consolidated Statements of Cash Flows
|
4
|
|
|
Consolidated Statements of Changes in Net Assets
|
5
|
|
|
Consolidated Schedule of Investments
|
6
|
|
|
Notes to Consolidated Financial Statements
|
33
|
|
|
Financial Highlights
|
44
|
|
| |
|
|
|
Item 2. Management's Discussion and Analysis of Financial Condition and Results of Operations
|
45
|
|
| |
|
|
|
Background
|
45
|
|
|
Overview
|
45
|
|
|
Investment Strategy
|
47
|
|
|
Involvement with Portfolio Companies
|
47
|
|
|
Historical Investments and Current Investment Pace
|
48
|
|
|
Importance of Availability of Liquid Capital
|
49
|
|
|
Our Sources of Liquid Capital
|
49
|
|
|
Recent and Pending Potential Liquidity Events from our Portfolio as of March 31, 2011
|
50
|
|
|
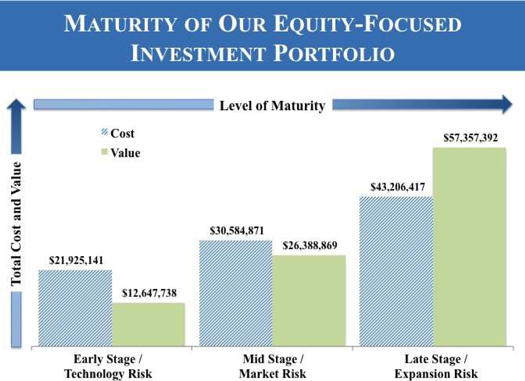
Maturity of Current Equity-Focused Venture Capital Portfolio
|
50
|
|
|
Current Business Environment
|
52
|
|
|
Valuation of Investments
|
53
|
|
|
Assessment of Venture Capital Investment Portfolio as of March 31, 2011
|
56
|
|
|
Investment Objective
|
63
|
|
|
Results of Operations
|
64
|
|
|
Financial Condition
|
68
|
|
|
Liquidity
|
69
|
|
|
Borrowings
|
70
|
|
|
Contractual Obligations
|
71
|
|
|
Capital Resources
|
71
|
|
|
Critical Accounting Policies
|
71
|
|
|
Recent Developments – Portfolio Companies
|
74
|
|
|
Forward-Looking Statements
|
75
|
|
| |
|
|
|
Item 3. Quantitative and Qualitative Disclosures About Market Risk
|
75
|
|
| |
|
|
|
Item 4. Controls and Procedures
|
77
|
|
| |
|
|
|
PART II. OTHER INFORMATION
|
|
|
| |
|
|
|
Item 1A. Risk Factors
|
78
|
|
| |
|
|
|
Item 5. Exhibits
|
78
|
|
| |
|
|
|
Signatures
|
79
|
|
| |
|
|
|
Exhibit Index
|
80
|
|
PART I. FINANCIAL INFORMATION
Item 1. Consolidated Financial Statements
The information furnished in the accompanying consolidated financial statements reflects all adjustments that are, in the opinion of management, necessary for a fair statement of the results for the interim period presented.
Harris & Harris Group, Inc.® (the "Company," "us," "our" and "we"), is an internally managed venture capital company that has elected to operate as a business development company ("BDC") under the Investment Company Act of 1940 (the "1940 Act"). Certain information and disclosures normally included in the consolidated financial statements in accordance with accounting principles generally accepted in the United States of America ("GAAP") have been condensed or omitted as permitted by Regulation S-X and Regulation S-K. Accordingly, they do not include all information and disclosures necessary for a presentation of our financial position, results of operations and cash flows in conformity with GAAP. The results of operations for any interim period are not necessarily indicative of the results for the full year. The accompanying consolidated financial statements should be read in conjunction with the audited consolidated financial statements and notes thereto contained in our Annual Report on Form 10-K for the year ended December 31, 2010.
|
HARRIS & HARRIS GROUP, INC.
CONSOLIDATED STATEMENTS OF ASSETS AND LIABILITIES
|
ASSETS
| |
|
March 31, 2011
|
|
|
December 31, 2010
|
|
| |
|
(Unaudited)
|
|
|
|
|
|
Investments in portfolio securities, at value:
|
|
|
|
|
|
|
|
Unaffiliated privately held companies (cost: $28,274,450 and $37,480,266, respectively)
|
|
$ |
44,311,705 |
|
|
$ |
56,315,330 |
|
|
Unaffiliated publicly traded securities (cost: $7,299,590 and $0, respectively)
|
|
|
4,447,843 |
|
|
|
0 |
|
|
Non-controlled affiliated privately held companies (cost: $51,752,650 and $51,451,965, respectively)
|
|
|
42,541,213 |
|
|
|
42,775,415 |
|
|
Controlled affiliated privately held companies (cost: $9,750,660 and $9,715,153, respectively)
|
|
|
6,458,228 |
|
|
|
7,059,677 |
|
|
Total investments in private portfolio companies and public securities, at value (cost: $97,077,350 and $98,647,384, respectively)
|
|
$ |
97,758,989 |
|
|
$ |
106,150,422 |
|
|
Investments in U.S. Treasury obligations, at value (cost: $39,196,567 and $38,273,349, respectively)
|
|
|
39,196,328 |
|
|
|
38,274,617 |
|
|
Cash
|
|
|
7,054,254 |
|
|
|
3,756,919 |
|
|
Restricted funds (Note 3)
|
|
|
1,252,752 |
|
|
|
2,751 |
|
|
Milestone payments from sale of investment, at value (Note 3)
|
|
|
3,291,750 |
|
|
|
0 |
|
|
Funds held in escrow from sale of investment, at value (Note 3)
|
|
|
477,568 |
|
|
|
0 |
|
|
Receivable from unsettled trade
|
|
|
115,143 |
|
|
|
0 |
|
|
Receivable from portfolio company
|
|
|
14,500 |
|
|
|
10,000 |
|
|
Interest receivable
|
|
|
7,958 |
|
|
|
5,924 |
|
|
Prepaid expenses
|
|
|
322,071 |
|
|
|
379,705 |
|
|
Other assets
|
|
|
682,962 |
|
|
|
708,830 |
|
|
Total assets
|
|
$ |
150,174,275 |
|
|
$ |
149,289,168 |
|
| |
|
|
|
|
|
|
|
|
|
LIABILITIES & NET ASSETS
|
| |
|
|
|
|
|
|
|
|
|
Post retirement plan liabilities
|
|
$ |
1,536,315 |
|
|
$ |
1,506,906 |
|
|
Revolving loan (Note 5)
|
|
|
1,250,000 |
|
|
|
0 |
|
|
Accounts payable and accrued liabilities
|
|
|
418,770 |
|
|
|
589,592 |
|
|
Deferred rent
|
|
|
333,361 |
|
|
|
338,758 |
|
|
Debt interest and other payable
|
|
|
3,084 |
|
|
|
0 |
|
|
Total liabilities
|
|
|
3,541,530 |
|
|
|
2,435,256 |
|
| |
|
|
|
|
|
|
|
|
|
Net assets
|
|
$ |
146,632,745 |
|
|
$ |
146,853,912 |
|
| |
|
|
|
|
|
|
|
|
|
Net assets are comprised of:
|
|
|
|
|
|
|
|
|
|
Preferred stock, $0.10 par value, 2,000,000 shares authorized; none issued
|
|
$ |
0 |
|
|
$ |
0 |
|
|
Common stock, $0.01 par value, 45,000,000 shares authorized at 03/31/11 and 12/31/10; 32,826,341 issued at 03/31/11 and 32,706,904 issued at 12/31/10
|
|
|
328,264 |
|
|
|
327,070 |
|
|
Additional paid in capital
|
|
|
208,989,533 |
|
|
|
208,085,735 |
|
|
Accumulated net operating and realized loss
|
|
|
(59,960,921 |
) |
|
|
(65,657,668 |
) |
|
Accumulated unrealized appreciation of investments
|
|
|
681,400 |
|
|
|
7,504,306 |
|
|
Treasury stock, at cost (1,828,740 shares at 03/31/11 and 12/31/10)
|
|
|
(3,405,531 |
) |
|
|
(3,405,531 |
) |
| |
|
|
|
|
|
|
|
|
|
Net assets
|
|
$ |
146,632,745 |
|
|
$ |
146,853,912 |
|
|
Shares outstanding
|
|
|
30,997,601 |
|
|
|
30,878,164 |
|
|
Net asset value per outstanding share
|
|
$ |
4.73 |
|
|
$ |
4.76 |
|
The accompanying notes are an integral part of these consolidated financial statements.
|
HARRIS & HARRIS GROUP, INC.
CONSOLIDATED STATEMENTS OF OPERATIONS
(Unaudited)
|
| |
|
Three Months Ended
|
|
|
Three Months Ended
|
|
| |
|
March 31, 2011
|
|
|
March 31, 2010
|
|
|
Investment income:
|
|
|
|
|
|
|
|
Interest from:
|
|
|
|
|
|
|
|
Fixed-income securities and bridge notes (Note 3)
|
|
$ |
121,777 |
|
|
$ |
73,073 |
|
|
Miscellaneous income
|
|
|
15,047 |
|
|
|
6,000 |
|
|
Total investment income
|
|
|
136,824 |
|
|
|
79,073 |
|
| |
|
|
|
|
|
|
|
|
|
Expenses:
|
|
|
|
|
|
|
|
|
|
Salaries, benefits and stock-based compensation (Note 7)
|
|
|
1,239,098 |
|
|
|
1,389,277 |
|
|
Administration and operations
|
|
|
256,558 |
|
|
|
282,522 |
|
|
Professional fees
|
|
|
247,848 |
|
|
|
243,369 |
|
|
Rent (Note 3)
|
|
|
89,500 |
|
|
|
77,215 |
|
|
Directors' fees and expenses
|
|
|
98,781 |
|
|
|
95,361 |
|
|
Custody fees
|
|
|
24,000 |
|
|
|
24,000 |
|
|
Depreciation
|
|
|
12,564 |
|
|
|
11,969 |
|
|
Interest and other debt expenses
|
|
|
3,778 |
|
|
|
0 |
|
|
Lease termination costs (Note 3)
|
|
|
0 |
|
|
|
68,038 |
|
|
Total expenses
|
|
|
1,972,127 |
|
|
|
2,191,751 |
|
| |
|
|
|
|
|
|
|
|
|
Net operating loss
|
|
|
(1,835,303 |
) |
|
|
(2,112,678 |
) |
| |
|
|
|
|
|
|
|
|
|
Net realized gain (loss):
|
|
|
|
|
|
|
|
|
|
Realized gain (loss) from investments:
|
|
|
|
|
|
|
|
|
|
Unaffiliated companies
|
|
|
7,534,340 |
|
|
|
0 |
|
|
U.S. Treasury obligations/other
|
|
|
0 |
|
|
|
(11,523 |
) |
|
Realized gain (loss) from investments
|
|
|
7,534,340 |
|
|
|
(11,523 |
) |
| |
|
|
|
|
|
|
|
|
|
Income tax expense (Note 8)
|
|
|
2,290 |
|
|
|
2,632 |
|
|
Net realized gain (loss) from investments
|
|
|
7,532,050 |
|
|
|
(14,155 |
) |
| |
|
|
|
|
|
|
|
|
|
Net (decrease) increase in unrealized appreciation on investments:
|
|
|
|
|
|
|
|
|
|
Change as a result of investment sales
|
|
|
(7,467,614 |
) |
|
|
0 |
|
|
Change on investments held
|
|
|
644,708 |
|
|
|
3,814,564 |
|
|
Net (decrease) increase in unrealized appreciation on investments
|
|
|
(6,822,906 |
) |
|
|
3,814,564 |
|
| |
|
|
|
|
|
|
|
|
|
Net (decrease) increase in net assets resulting from operations:
|
|
|
|
|
|
|
|
|
| |
|
|
|
|
|
|
|
|
|
Total
|
|
$ |
(1,126,159 |
) |
|
$ |
1,687,731 |
|
| |
|
|
|
|
|
|
|
|
|
Per average basic and diluted outstanding share
|
|
$ |
(0.04 |
) |
|
$ |
0.05 |
|
| |
|
|
|
|
|
|
|
|
|
Average outstanding shares
|
|
|
30,918,981 |
|
|
|
30,859,888 |
|
The accompanying notes are an integral part of these consolidated financial statements.
|
HARRIS & HARRIS GROUP, INC.
CONSOLIDATED STATEMENTS OF CASH FLOWS
(Unaudited)
|
| |
|
Three Months Ended
|
|
|
Three Months Ended
|
|
| |
|
March 31, 2011
|
|
|
March 31, 2010
|
|
|
Cash flows (used in) providedA by operating activities:
|
|
|
|
|
|
|
|
Net (decrease) increase in net assets resulting from operations
|
|
$ |
(1,126,159 |
) |
|
$ |
1,687,731 |
|
|
Adjustments to reconcile net (decrease) increase in net assets resulting from operations to net cash used in operating activities:
|
|
|
|
|
|
|
|
|
|
Net realized gain and unrealized appreciation on investments
|
|
|
(711,434 |
) |
|
|
(3,803,041 |
) |
|
Depreciation of fixed assets, amortization of premium or discount on securities, and bridge note interest
|
|
|
(69,815 |
) |
|
|
(41,107 |
) |
|
Stock-based compensation expense
|
|
|
427,314 |
|
|
|
553,272 |
|
| |
|
|
|
|
|
|
|
|
|
Changes in assets and liabilities:
|
|
|
|
|
|
|
|
|
|
Restricted funds
|
|
|
(1,250,001 |
) |
|
|
0 |
|
|
Receivable from unsettled trade
|
|
|
(115,143 |
) |
|
|
0 |
|
|
Receivable from portfolio company
|
|
|
(4,500 |
) |
|
|
28,247 |
|
|
Interest receivable
|
|
|
17,198 |
|
|
|
12,589 |
|
|
Receivable from investments sold
|
|
|
0 |
|
|
|
(799,925 |
) |
|
Prepaid expenses
|
|
|
57,634 |
|
|
|
(244,413 |
) |
|
Other assets
|
|
|
13,067 |
|
|
|
(260,892 |
) |
|
Post retirement plan liabilities
|
|
|
29,409 |
|
|
|
33,051 |
|
|
Accounts payable and accrued liabilities
|
|
|
(167,738 |
) |
|
|
93,740 |
|
|
Deferred rent
|
|
|
(5,397 |
) |
|
|
319,534 |
|
|
Net cash used in operating activities
|
|
|
(2,905,565 |
) |
|
|
(2,421,214 |
) |
| |
|
|
|
|
|
|
|
|
|
Cash flows from investing activities:
|
|
|
|
|
|
|
|
|
|
Purchase of U.S. government securities
|
|
|
(59,188,063 |
) |
|
|
(2,399,293 |
) |
|
Sale of U.S. government securities
|
|
|
58,245,613 |
|
|
|
5,199,533 |
|
|
Investment in affiliated portfolio companies
|
|
|
(272,369 |
) |
|
|
(1,171,975 |
) |
|
Investment in unaffiliated portfolio companies
|
|
|
(2,262,305 |
) |
|
|
(503,083 |
) |
|
Proceeds from conversion of bridge note
|
|
|
0 |
|
|
|
1,356 |
|
|
Purchase of fixed assets
|
|
|
0 |
|
|
|
(80,516 |
) |
|
Principal payments received on debt investments
|
|
|
20,876 |
|
|
|
0 |
|
|
Proceeds from sale of investments
|
|
|
7,931,470 |
|
|
|
0 |
|
|
Net cash provided by investing activities
|
|
|
4,475,222 |
|
|
|
1,046,022 |
|
| |
|
|
|
|
|
|
|
|
|
Cash flows from financing activities:
|
|
|
|
|
|
|
|
|
|
Proceeds from stock option exercises
|
|
|
477,678 |
|
|
|
9,949 |
|
|
Payment of offering costs
|
|
|
0 |
|
|
|
(48,928 |
) |
|
Proceeds from drawdown of credit facility
|
|
|
1,250,000 |
|
|
|
0 |
|
|
Net cash provided by (used in) financing activities
|
|
|
1,727,678 |
|
|
|
(38,979 |
) |
| |
|
|
|
|
|
|
|
|
|
Net increase (decrease) in cash:
|
|
|
|
|
|
|
|
|
|
Cash at beginning of the period
|
|
|
3,756,919 |
|
|
|
1,611,465 |
|
|
Cash at end of the period
|
|
|
7,054,254 |
|
|
|
197,294 |
|
|
Net increase (decrease) in cash
|
|
$ |
3,297,335 |
|
|
$ |
(1,414,171 |
) |
| |
|
|
|
|
|
|
|
|
|
Supplemental disclosures of cash flow information:
|
|
|
|
|
|
|
|
|
|
Income taxes paid
|
|
$ |
2,290 |
|
|
$ |
2,632 |
|
The accompanying notes are an integral part of these consolidated financial statements.
|
HARRIS & HARRIS GROUP, INC.
CONSOLIDATED STATEMENTS OF CHANGES IN NET ASSETS
|
| |
|
Three Months Ended
|
|
|
Year Ended
|
|
| |
|
March 31, 2011
|
|
|
December 31, 2010
|
|
| |
|
(Unaudited)
|
|
|
|
|
| |
|
|
|
|
|
|
|
Changes in net assets from operations:
|
|
|
|
|
|
|
| |
|
|
|
|
|
|
|
Net operating loss
|
|
$ |
(1,835,303 |
) |
|
$ |
(7,555,807 |
) |
|
Net realized gain (loss) on investments
|
|
|
7,532,050 |
|
|
|
(3,740,518 |
) |
|
Net (decrease) increase in unrealized appreciation on investments as a result of sales
|
|
|
(7,467,614 |
) |
|
|
3,608,205 |
|
|
Net increase in unrealized appreciation on investments held
|
|
|
644,708 |
|
|
|
18,274,970 |
|
| |
|
|
|
|
|
|
|
|
|
Net (decrease) increase in net assets resulting from operations
|
|
|
(1,126,159 |
) |
|
|
10,586,850 |
|
| |
|
|
|
|
|
|
|
|
|
Changes in net assets from capital stock transactions:
|
|
|
|
|
|
|
|
|
| |
|
|
|
|
|
|
|
|
|
Issuance of common stock upon the exercise of stock options
|
|
|
1,194 |
|
|
|
186 |
|
|
Additional paid-in capital on common stock issued net of offering expenses
|
|
|
476,484 |
|
|
|
20,527 |
|
|
Stock-based compensation expense
|
|
|
427,314 |
|
|
|
2,088,091 |
|
| |
|
|
|
|
|
|
|
|
|
Net increase in net assets resulting from capital stock transactions
|
|
|
904,992 |
|
|
|
2,108,804 |
|
| |
|
|
|
|
|
|
|
|
|
Net (decrease) increase in net assets
|
|
|
(221,167 |
) |
|
|
12,695,654 |
|
| |
|
|
|
|
|
|
|
|
|
Net assets:
|
|
|
|
|
|
|
|
|
| |
|
|
|
|
|
|
|
|
|
Beginning of the period
|
|
|
146,853,912 |
|
|
|
134,158,258 |
|
| |
|
|
|
|
|
|
|
|
|
End of the period
|
|
$ |
146,632,745 |
|
|
$ |
146,853,912 |
|
The accompanying notes are an integral part of these consolidated financial statements.
|
HARRIS & HARRIS GROUP, INC.
CONSOLIDATED SCHEDULE OF INVESTMENTS AS OF MARCH 31, 2011
(Unaudited)
|
| |
Method of
|
|
|
|
|
|
Shares/
|
|
|
|
|
| |
Valuation (1)
|
Industry (2)
|
|
Cost
|
|
|
Principal
|
|
|
Value
|
|
|
Investments in Unaffiliated Companies (3)(4)(5) –
33.3% of net assets at value
|
|
|
|
|
|
|
|
|
|
|
|
| |
|
|
|
|
|
|
|
|
|
|
|
|
Private Placement Portfolio (Illiquid) –
30.2% of net assets at value
|
|
|
|
|
|
|
|
|
|
|
|
| |
|
|
|
|
|
|
|
|
|
|
|
| |
|
|
|
|
|
|
|
|
|
|
|
|
Bridgelux, Inc. (6)(7)(9)
|
|
Cleantech
|
|
|
|
|
|
|
|
|
|
|
Manufacturing high-power light emitting diodes (LEDs) and arrays
|
|
|
|
|
|
|
|
|
|
|
|
|
Series B Convertible Preferred Stock
|
(M)
|
|
|
$ |
1,000,000 |
|
|
|
1,861,504 |
|
|
$ |
2,345,495 |
|
|
Series C Convertible Preferred Stock
|
(M)
|
|
|
|
1,352,196 |
|
|
|
2,130,699 |
|
|
|
2,684,681 |
|
|
Series D Convertible Preferred Stock
|
(M)
|
|
|
|
1,371,622 |
|
|
|
999,999 |
|
|
|
1,259,998 |
|
|
Warrants for Series C Convertible Preferred Stock expiring 12/31/14
|
( I )
|
|
|
|
168,270 |
|
|
|
163,900 |
|
|
|
124,728 |
|
|
Warrants for Series D Convertible Preferred
|
|
|
|
|
|
|
|
|
|
|
|
|
|
|
|
Stock expiring 8/26/14
|
( I )
|
|
|
|
128,543 |
|
|
|
166,665 |
|
|
|
84,832 |
|
|
Secured Convertible Bridge Note (including interest)
|
(M)
|
|
|
|
826,648 |
|
|
$ |
813,805 |
|
|
|
826,648 |
|
| |
|
|
|
|
4,847,279 |
|
|
|
|
|
|
|
7,326,382 |
|
| |
|
|
|
|
|
|
|
|
|
|
|
|
|
|
|
Cobalt Technologies, Inc. (6)(7)(10)
|
|
Cleantech
|
|
|
|
|
|
|
|
|
|
|
|
|
|
Developing processes for making bio-butanol through biomass fermentation
|
|
|
|
|
|
|
|
|
|
|
|
|
|
|
|
Series C Convertible Preferred Stock
|
(M)
|
|
|
|
749,998 |
|
|
|
352,112 |
|
|
|
880,280 |
|
| |
|
|
|
|
|
|
|
|
|
|
|
|
|
|
|
Ensemble Therapeutics Corporation (6)(7)(11)
|
|
Healthcare
|
|
|
|
|
|
|
|
|
|
|
|
|
|
Developing DNA-Programmed ChemistryTM for the discovery of new classes of therapeutics
|
|
|
|
|
|
|
|
|
|
|
|
|
|
|
|
Series B Convertible Preferred Stock
|
(M)
|
|
|
|
2,000,000 |
|
|
|
1,449,275 |
|
|
|
2,000,000 |
|
|
Secured Convertible Bridge Notes (including interest)
|
(M)
|
|
|
|
355,407 |
|
|
$ |
299,169 |
|
|
|
355,407 |
|
| |
|
|
|
|
2,355,407 |
|
|
|
|
|
|
|
2,355,407 |
|
| |
|
|
|
|
|
|
|
|
|
|
|
|
|
|
|
GEO Semiconductor Inc. (8) Developing programmable, high-performance video and geometry processing solutions
|
|
Electronics
|
|
|
|
|
|
|
|
|
|
|
|
|
|
Participation Agreement with Montage
|
|
|
|
|
|
|
|
|
|
|
|
|
|
|
|
Capital relating to the following assets:
|
|
|
|
|
|
|
|
|
|
|
|
|
|
|
|
Senior secured debt, 13.75%, maturing on 06/30/12
|
( I )
|
|
|
|
441,719 |
|
|
$ |
500,000 |
|
|
|
427,300 |
|
|
Warrants for Series A Pref. Stock expiring on 09/17/17
|
( I )
|
|
|
|
44,624 |
|
|
|
100,000 |
|
|
|
55,800 |
|
|
Loan and Security Agreement with GEO Semiconductor relating to the following assets:
|
|
|
|
|
|
|
|
|
|
|
|
|
|
|
|
Subordinated secured debt, 15.75%, maturing on 06/29/11
|
( I )
|
|
|
|
137,375 |
|
|
$ |
150,000 |
|
|
|
144,490 |
|
|
Warrants for Series A Pref. Stock expiring on 03/01/18
|
( I )
|
|
|
|
8,079 |
|
|
|
10,000 |
|
|
|
5,700 |
|
| |
|
|
|
|
631,797 |
|
|
|
|
|
|
|
633,290 |
|
The accompanying notes are an integral part of these consolidated financial statements.
|
HARRIS & HARRIS GROUP, INC.
CONSOLIDATED SCHEDULE OF INVESTMENTS AS OF MARCH 31, 2011
(Unaudited)
|
| |
Method of
|
|
|
|
|
|
Shares/
|
|
|
|
|
| |
Valuation (1)
|
Industry (2)
|
|
Cost
|
|
|
Principal
|
|
|
Value
|
|
| |
|
|
|
|
|
|
|
|
|
|
|
|
Investments in Unaffiliated Companies (3)(4)(5) –
33.3% of net assets at value (Cont.)
|
|
|
|
|
|
|
|
|
|
|
|
| |
|
|
|
|
|
|
|
|
|
|
|
|
Private Placement Portfolio (Illiquid) –
30.2% of net assets at value (Cont.)
|
|
|
|
|
|
|
|
|
|
|
|
| |
|
|
|
|
|
|
|
|
|
|
|
|
Molecular Imprints, Inc. (6)(7)
|
|
Electronics
|
|
|
|
|
|
|
|
|
|
|
Manufacturing nanoimprint lithography capital equipment
|
|
|
|
|
|
|
|
|
|
|
|
|
Series B Convertible Preferred Stock
|
(M)
|
|
|
$ |
2,000,000 |
|
|
|
1,333,333 |
|
|
$ |
1,861,111 |
|
|
Series C Convertible Preferred Stock
|
(M)
|
|
|
|
2,309,098 |
|
|
|
1,250,000 |
|
|
|
2,013,889 |
|
|
Warrants for Series C Convertible Preferred
|
|
|
|
|
|
|
|
|
|
|
|
|
|
|
|
Stock expiring 12/31/11
|
( I )
|
|
|
|
190,902 |
|
|
|
125,000 |
|
|
|
58,250 |
|
| |
|
|
|
|
4,500,000 |
|
|
|
|
|
|
|
3,933,250 |
|
| |
|
|
|
|
|
|
|
|
|
|
|
|
|
|
|
Nanosys, Inc. (6)(7)
|
|
Cleantech
|
|
|
|
|
|
|
|
|
|
|
|
|
|
Developing inorganic nanowires and quantum dots for use in batteries and LED-backlit devices
|
|
|
|
|
|
|
|
|
|
|
|
|
|
|
|
Series C Convertible Preferred Stock
|
(M)
|
|
|
|
1,500,000 |
|
|
|
803,428 |
|
|
|
916,225 |
|
|
Series D Convertible Preferred Stock
|
(M)
|
|
|
|
3,000,003 |
|
|
|
1,016,950 |
|
|
|
1,239,680 |
|
|
Series E Convertible Preferred Stock
|
(M)
|
|
|
|
496,573 |
|
|
|
433,688 |
|
|
|
745,076 |
|
| |
|
|
|
|
4,996,576 |
|
|
|
|
|
|
|
2,900,981 |
|
| |
|
|
|
|
|
|
|
|
|
|
|
|
|
|
|
NanoTerra, Inc. (8)(12)
|
|
Cleantech
|
|
|
|
|
|
|
|
|
|
|
|
|
|
Developing surface chemistry and nano-manufacturing solutions
|
|
|
|
|
|
|
|
|
|
|
|
|
|
|
|
Senior secured debt, 12.0%, maturing on 02/22/14
|
( I )
|
|
|
|
442,062 |
|
|
$ |
500,000 |
|
|
|
443,888 |
|
|
Senior secured debt, 12.0%, maturing on 02/22/13
|
( I )
|
|
|
|
217,894 |
|
|
$ |
250,000 |
|
|
|
218,644 |
|
|
Warrants for Series A Pref. Stock expiring on 02/22/21
|
( I )
|
|
|
|
69,168 |
|
|
|
446,248 |
|
|
|
69,168 |
|
| |
|
|
|
|
729,124 |
|
|
|
|
|
|
|
731,700 |
|
| |
|
|
|
|
|
|
|
|
|
|
|
|
|
|
|
Nantero, Inc. (6)(7)(8)
|
|
Electronics
|
|
|
|
|
|
|
|
|
|
|
|
|
|
Developing a high-density, nonvolatile, random access memory chip, enabled by carbon nanotubes
|
|
|
|
|
|
|
|
|
|
|
|
|
|
|
|
Series A Convertible Preferred Stock
|
(M)
|
|
|
|
489,999 |
|
|
|
345,070 |
|
|
|
1,046,908 |
|
|
Series B Convertible Preferred Stock
|
(M)
|
|
|
|
323,000 |
|
|
|
207,051 |
|
|
|
628,172 |
|
|
Series C Convertible Preferred Stock
|
(M)
|
|
|
|
571,329 |
|
|
|
188,315 |
|
|
|
571,329 |
|
| |
|
|
|
|
1,384,328 |
|
|
|
|
|
|
|
2,246,409 |
|
The accompanying notes are an integral part of these consolidated financial statements.
|
HARRIS & HARRIS GROUP, INC.
CONSOLIDATED SCHEDULE OF INVESTMENTS AS OF MARCH 31, 2011
(Unaudited)
|
| |
Method of
|
|
|
|
|
|
Shares/
|
|
|
|
|
| |
Valuation (1)
|
Industry (2)
|
|
Cost
|
|
|
Principal
|
|
|
Value
|
|
| |
|
|
|
|
|
|
|
|
|
|
|
|
Investments in Unaffiliated Companies (3)(4)(5) –
33.3% of net assets at value (Cont.)
|
|
|
|
|
|
|
|
|
|
|
|
| |
|
|
|
|
|
|
|
|
|
|
|
|
Private Placement Portfolio (Illiquid) –
30.2% of net assets at value (Cont.)
|
|
|
|
|
|
|
|
|
|
|
|
| |
|
|
|
|
|
|
|
|
|
|
|
|
Polatis, Inc. (6)(7)(8)
|
|
Electronics
|
|
|
|
|
|
|
|
|
|
|
Developing MEMS-based optical networking components and systems
|
|
|
|
|
|
|
|
|
|
|
|
|
|
|
|
Common Stock
|
(M)
|
|
|
$ |
135,105 |
|
|
|
16,438 |
|
|
$ |
0 |
|
|
Series A-1 Convertible Preferred Stock
|
(M)
|
|
|
|
1,000,000 |
|
|
|
16,775 |
|
|
|
0 |
|
|
Series A-2 Convertible Preferred Stock
|
(M)
|
|
|
|
839,000 |
|
|
|
71,611 |
|
|
|
0 |
|
|
Series A-4 Convertible Preferred Stock
|
(M)
|
|
|
|
44,183 |
|
|
|
4,774 |
|
|
|
0 |
|
| |
|
|
|
|
2,018,288 |
|
|
|
|
|
|
|
0 |
|
| |
|
|
|
|
|
|
|
|
|
|
|
|
|
|
|
PolyRemedy, Inc. (6)(7)(8)
|
|
Healthcare
|
|
|
|
|
|
|
|
|
|
|
|
|
|
Developing a platform for producing and tracking the use of wound treatment patches
|
|
|
|
|
|
|
|
|
|
|
|
|
|
|
|
Series B-1 Convertible Preferred Stock
|
(M)
|
|
|
|
244,500 |
|
|
|
287,647 |
|
|
|
23,466 |
|
|
Series B-2 Convertible Preferred Stock
|
(M)
|
|
|
|
121,706 |
|
|
|
676,147 |
|
|
|
30,427 |
|
| |
|
|
|
|
366,206 |
|
|
|
|
|
|
|
53,893 |
|
| |
|
|
|
|
|
|
|
|
|
|
|
|
|
|
|
Solazyme, Inc. (6)(7)
|
|
Cleantech
|
|
|
|
|
|
|
|
|
|
|
|
|
|
Developing algal biodiesel, industrial chemicals and specialty ingredients using synthetic biology
|
|
|
|
|
|
|
|
|
|
|
|
|
|
|
|
Series A Convertible Preferred Stock
|
(M)
|
|
|
|
385,400 |
|
|
|
988,204 |
|
|
|
9,970,978 |
|
|
Series B Convertible Preferred Stock
|
(M)
|
|
|
|
500,000 |
|
|
|
495,246 |
|
|
|
4,997,032 |
|
|
Series C Convertible Preferred Stock
|
(M)
|
|
|
|
3,058,806 |
|
|
|
651,309 |
|
|
|
6,571,708 |
|
|
Series D Convertible Preferred Stock
|
(M)
|
|
|
|
1,499,991 |
|
|
|
169,390 |
|
|
|
1,709,145 |
|
| |
|
|
|
|
5,444,197 |
|
|
|
|
|
|
|
23,248,863 |
|
| |
|
|
|
|
|
|
|
|
|
|
|
|
|
|
|
TetraVitae Bioscience, Inc. (6)(7)(8)
|
|
Cleantech
|
|
|
|
|
|
|
|
|
|
|
|
|
|
Developing methods of producing alternative chemicals and fuels through biomass fermentation
|
|
|
|
|
|
|
|
|
|
|
|
|
|
|
|
Common Stock
|
(M)
|
|
|
|
250,000 |
|
|
|
118,804 |
|
|
|
0 |
|
The accompanying notes are an integral part of these consolidated financial statements.
|
HARRIS & HARRIS GROUP, INC.
CONSOLIDATED SCHEDULE OF INVESTMENTS AS OF MARCH 31, 2011
(Unaudited)
|
| |
Method of
|
|
|
|
|
|
Shares/
|
|
|
|
|
| |
Valuation (1)
|
Industry (2)
|
|
Cost
|
|
|
Principal
|
|
|
Value
|
|
| |
|
|
|
|
|
|
|
|
|
|
|
|
Investments in Unaffiliated Companies (3)(4)(5) –
33.3% of net assets at value (Cont.)
|
|
|
|
|
|
|
|
|
|
|
|
| |
|
|
|
|
|
|
|
|
|
|
|
|
Private Placement Portfolio (Illiquid) –
30.2% of net assets at value (Cont.)
|
|
|
|
|
|
|
|
|
|
|
|
| |
|
|
|
|
|
|
|
|
|
|
|
| |
|
|
|
|
|
|
|
|
|
|
|
|
Ultora, Inc. (6)(7)(8)
|
|
Cleantech
|
|
|
|
|
|
|
|
|
|
|
Developing energy-storage devices enabled by carbon nanotubes
|
|
|
|
|
|
|
|
|
|
|
|
|
|
|
|
Secured Convertible Bridge Note
|
(M)
|
|
|
$ |
1,250 |
|
|
$ |
1,250 |
|
|
$ |
1,250 |
|
| |
|
|
|
|
|
|
|
|
|
|
|
|
|
|
|
Total Unaffiliated Private Placement Portfolio (cost: $28,274,450)
|
|
|
|
|
|
|
|
|
|
|
$ |
44,311,705 |
|
| |
|
|
|
|
|
|
|
|
|
|
|
|
|
|
| |
Method of
|
|
|
|
|
|
|
Shares/
|
|
|
|
|
|
| |
Valuation (1)
|
Industry(2)
|
|
Cost
|
|
|
Principal
|
|
|
Value
|
|
| |
|
|
|
|
|
|
|
|
|
|
|
|
|
|
|
Publicly Traded Portfolio (Illiquid) –
3.1% of net assets at value
|
|
|
|
|
|
|
|
|
|
|
|
|
|
|
| |
|
|
|
|
|
|
|
|
|
|
|
|
|
|
|
NeoPhotonics Corporation (6)(7)(13)
|
|
Electronics
|
|
|
|
|
|
|
|
|
|
|
|
|
|
Developing and manufacturing optical devices and components
|
|
|
|
|
|
|
|
|
|
|
|
|
|
|
|
Common Stock
|
(M)
|
|
|
$ |
7,299,590 |
|
|
|
450,907 |
|
|
$ |
4,447,843 |
|
| |
|
|
|
|
|
|
|
|
|
|
|
|
|
|
|
Total Unaffiliated Publicly Traded Portfolio (cost: $7,299,590)
|
|
|
|
|
|
|
|
|
|
|
|
$ |
4,447,843
|
|
| |
|
|
|
|
|
|
|
|
|
|
|
|
|
|
|
Total Investments in Unaffiliated Companies (cost: $35,574,040)
|
|
|
|
|
|
|
|
|
|
|
$ |
48,759,548 |
|
The accompanying notes are an integral part of these consolidated financial statements.
|
HARRIS & HARRIS GROUP, INC.
CONSOLIDATED SCHEDULE OF INVESTMENTS AS OF MARCH 31, 2011
(Unaudited)
|
| |
Method of
|
|
|
|
|
|
Shares/
|
|
|
|
|
| |
Valuation (1)
|
Industry (2)
|
|
Cost
|
|
|
Principal
|
|
|
Value
|
|
| |
|
|
|
|
|
|
|
|
|
|
|
|
Investments in Non-Controlled Affiliated Companies (3)(14) –
29.0% of net assets at value
|
|
|
|
|
|
|
|
|
|
|
|
| |
|
|
|
|
|
|
|
|
|
|
|
|
Private Placement Portfolio (Illiquid) –
29.0% of net assets at value
|
|
|
|
|
|
|
|
|
|
|
|
| |
|
|
|
|
|
|
|
|
|
|
|
|
ABS Materials, Inc. (6)(7)
|
|
Cleantech
|
|
|
|
|
|
|
|
|
|
|
Developing nano-structured absorbent materials for environmental remediation and for the petroleum industry
|
|
|
|
|
|
|
|
|
|
|
|
|
Series A Convertible Preferred Stock
|
(M)
|
|
|
$ |
375,000 |
|
|
|
375,000 |
|
|
$ |
375,000 |
|
| |
|
|
|
|
|
|
|
|
|
|
|
|
|
|
| |
|
|
|
|
|
|
|
|
|
|
|
|
|
|
|
Adesto Technologies Corporation (6)(7)(8)
|
|
Electronics
|
|
|
|
|
|
|
|
|
|
|
|
|
Developing low-power, high- performance memory devices
|
|
|
|
|
|
|
|
|
|
|
|
|
|
|
|
Series A Convertible Preferred Stock
|
(M)
|
|
|
|
2,200,000 |
|
|
|
6,547,619 |
|
|
|
2,420,000 |
|
|
Series B Convertible Preferred Stock
|
(M)
|
|
|
|
2,200,000 |
|
|
|
5,952,381 |
|
|
|
2,200,000 |
|
| |
|
|
|
|
4,400,000 |
|
|
|
|
|
|
|
4,620,000 |
|
| |
|
|
|
|
|
|
|
|
|
|
|
|
|
|
| |
|
|
|
|
|
|
|
|
|
|
|
|
|
|
|
Cambrios Technologies Corporation (6)(7)(8)
|
|
Electronics
|
|
|
|
|
|
|
|
|
|
|
|
|
Developing nanowire-enabled electronic materials for the display industry
|
|
|
|
|
|
|
|
|
|
|
|
|
|
|
|
Series B Convertible Preferred Stock
|
(M)
|
|
|
|
1,294,025 |
|
|
|
1,294,025 |
|
|
|
323,506 |
|
|
Series C Convertible Preferred Stock
|
(M)
|
|
|
|
1,300,000 |
|
|
|
1,300,000 |
|
|
|
586,690 |
|
|
Series D Convertible Preferred Stock
|
(M)
|
|
|
|
515,756 |
|
|
|
515,756 |
|
|
|
644,695 |
|
|
Unsecured Convertible Bridge Note (including interest)
|
(M)
|
|
|
|
95,154 |
|
|
$ |
92,400 |
|
|
|
95,154 |
|
| |
|
|
|
|
3,204,935 |
|
|
|
|
|
|
|
1,650,045 |
|
| |
|
|
|
|
|
|
|
|
|
|
|
|
|
|
| |
|
|
|
|
|
|
|
|
|
|
|
|
|
|
|
Contour Energy Systems, Inc. (6)(7)(8)
|
|
Cleantech
|
|
|
|
|
|
|
|
|
|
|
|
Developing batteries using nanostructured materials
|
|
|
|
|
|
|
|
|
|
|
|
|
|
|
|
Series A Convertible Preferred Stock
|
(M)
|
|
|
|
2,009,995 |
|
|
|
2,565,798 |
|
|
|
2,681,260 |
|
|
Series B Convertible Preferred Stock
|
(M)
|
|
|
|
1,300,000 |
|
|
|
812,500 |
|
|
|
1,254,919 |
|
| |
|
|
|
|
3,309,995 |
|
|
|
|
|
|
|
3,936,179 |
|
The accompanying notes are an integral part of these consolidated financial statements.
|
HARRIS & HARRIS GROUP, INC.
CONSOLIDATED SCHEDULE OF INVESTMENTS AS OF MARCH 31, 2011
(Unaudited)
|
| |
Method of
|
|
|
|
|
|
Shares/
|
|
|
|
|
| |
Valuation (1)
|
Industry (2)
|
|
Cost
|
|
|
Principal
|
|
|
Value
|
|
|
Investments in Non-Controlled Affiliated Companies (3)(14) –
29.0% of net assets at value (Cont.)
|
|
|
|
|
|
|
|
|
|
|
|
| |
|
|
|
|
|
|
|
|
|
|
|
|
Private Placement Portfolio (Illiquid) –
29.0% of net assets at value (Cont.)
|
|
|
|
|
|
|
|
|
|
|
|
| |
|
|
|
|
|
|
|
|
|
|
|
| |
|
|
|
|
|
|
|
|
|
|
|
|
Crystal IS, Inc. (6)(7)
|
|
Cleantech
|
|
|
|
|
|
|
|
|
|
|
Developing single-crystal aluminum nitride substrates for light-emitting diodes
|
|
|
|
|
|
|
|
|
|
|
|
|
|
|
|
Common Stock
|
(M)
|
|
|
$ |
1,734,199 |
|
|
|
3,994,468 |
|
|
$ |
0 |
|
|
Warrants for Series A-1 Pref. Stock expiring 05/05/13
|
( I )
|
|
|
|
8,746 |
|
|
|
15,231 |
|
|
|
0 |
|
|
Warrants for Series A-1 Pref. Stock expiring 05/12/13
|
( I )
|
|
|
|
1,351 |
|
|
|
2,350 |
|
|
|
0 |
|
|
Warrants for Series A-1 Pref. Stock expiring 08/08/13
|
( I )
|
|
|
|
2,543 |
|
|
|
4,396 |
|
|
|
0 |
|
| |
|
|
|
|
1,746,839 |
|
|
|
|
|
|
|
0 |
|
| |
|
|
|
|
|
|
|
|
|
|
|
|
|
|
|
D-Wave Systems, Inc. (6)(7)(8)(15)
|
|
Electronics
|
|
|
|
|
|
|
|
|
|
|
|
|
|
Developing high- performance quantum computing systems
|
|
|
|
|
|
|
|
|
|
|
|
|
|
|
|
Series B Convertible Preferred Stock
|
(M)
|
|
|
|
1,002,074 |
|
|
|
1,144,869 |
|
|
|
1,380,483 |
|
|
Series C Convertible Preferred Stock
|
(M)
|
|
|
|
487,804 |
|
|
|
450,450 |
|
|
|
543,153 |
|
|
Series D Convertible Preferred Stock
|
(M)
|
|
|
|
1,484,492 |
|
|
|
1,533,395 |
|
|
|
1,848,968 |
|
|
Series E Convertible Preferred Stock
|
(M)
|
|
|
|
248,049 |
|
|
|
269,280 |
|
|
|
324,698 |
|
|
Series F Convertible Preferred Stock
|
(M)
|
|
|
|
238,323 |
|
|
|
258,721 |
|
|
|
311,966 |
|
|
Warrants for Common Stock expiring 06/30/15
|
( I )
|
|
|
|
98,644 |
|
|
|
153,890 |
|
|
|
72,482 |
|
| |
|
|
|
|
3,559,386 |
|
|
|
|
|
|
|
4,481,750 |
|
| |
|
|
|
|
|
|
|
|
|
|
|
|
|
|
|
Enumeral Biomedical Corp. (6)(7)(8)
|
|
Healthcare
|
|
|
|
|
|
|
|
|
|
|
|
|
|
Developing therapeutics and diagnostics through functional assaying of single cells
|
|
|
|
|
|
|
|
|
|
|
|
|
|
|
|
Unsecured Convertible Bridge Note (including interest)
|
(M)
|
|
|
|
275,425 |
|
|
$ |
250,000 |
|
|
|
358,758 |
|
| |
|
|
|
|
|
|
|
|
|
|
|
|
|
|
| |
|
|
|
|
|
|
|
|
|
|
|
|
|
|
| |
|
|
|
|
|
|
|
|
|
|
|
|
|
|
|
Innovalight, Inc. (6)(7)(8)
|
|
Cleantech
|
|
|
|
|
|
|
|
|
|
|
|
|
|
Developing silicon-based nanomaterials for use in the solar energy industry
|
|
|
|
|
|
|
|
|
|
|
|
|
|
|
|
Series B Convertible Preferred Stock
|
(M)
|
|
|
|
2,500,000 |
|
|
|
16,666,666 |
|
|
|
1,235,515 |
|
|
Series C Convertible Preferred Stock
|
(M)
|
|
|
|
1,993,568 |
|
|
|
5,810,577 |
|
|
|
1,728,843 |
|
|
Series D Convertible Preferred Stock
|
(M)
|
|
|
|
721,090 |
|
|
|
4,046,974 |
|
|
|
672,820 |
|
|
Warrants for Series D Preferred Stock expiring 03/03/18
|
( I )
|
|
|
|
37,196 |
|
|
|
304,194 |
|
|
|
10,951 |
|
|
Unsecured Convertible Bridge Note (including interest)
|
(M)
|
|
|
|
236,465 |
|
|
$ |
271,007 |
|
|
|
272,299 |
|
| |
|
|
|
|
5,488,319 |
|
|
|
|
|
|
|
3,920,428 |
|
The accompanying notes are an integral part of these consolidated financial statements.
|
HARRIS & HARRIS GROUP, INC.
CONSOLIDATED SCHEDULE OF INVESTMENTS AS OF MARCH 31, 2011
(Unaudited)
|
| |
Method of
|
|
|
|
|
|
Shares/
|
|
|
|
|
| |
Valuation (1)
|
Industry (2)
|
|
Cost
|
|
|
Principal
|
|
|
Value
|
|
|
Investments in Non-Controlled Affiliated Companies (3)(14) –
29.0% of net assets at value (Cont.)
|
|
|
|
|
|
|
|
|
|
|
|
| |
|
|
|
|
|
|
|
|
|
|
|
|
Private Placement Portfolio (Illiquid) –
29.0% of net assets at value (Cont.)
|
|
|
|
|
|
|
|
|
|
|
|
| |
|
|
|
|
|
|
|
|
|
|
|
|
Kovio, Inc. (6)(7)
|
|
Electronics
|
|
|
|
|
|
|
|
|
|
|
Developing semiconductor products using printed electronics and thin-film technologies
|
|
|
|
|
|
|
|
|
|
|
|
|
Series A' Convertible Preferred Stock
|
(M)
|
|
|
$ |
5,242,993 |
|
|
|
2,160,000 |
|
|
$ |
1,439,620 |
|
|
Series A3X Convertible Preferred Stock
|
(M)
|
|
|
|
526,225 |
|
|
|
526,225 |
|
|
|
526,225 |
|
| |
|
|
|
|
5,769,218 |
|
|
|
|
|
|
|
1,965,845 |
|
| |
|
|
|
|
|
|
|
|
|
|
|
|
|
|
|
Mersana Therapeutics, Inc. (6)(7)(8)
|
|
Healthcare
|
|
|
|
|
|
|
|
|
|
|
|
|
|
Developing treatments for cancer based on novel drug delivery polymers
|
|
|
|
|
|
|
|
|
|
|
|
|
|
|
|
Series A Convertible Preferred Stock
|
(M)
|
|
|
|
700,000 |
|
|
|
68,451 |
|
|
|
136,902 |
|
|
Series B Convertible Preferred Stock
|
(M)
|
|
|
|
1,542,098 |
|
|
|
866,500 |
|
|
|
1,733,000 |
|
|
Unsecured Convertible Bridge Notes (including interest)
|
(M)
|
|
|
|
981,217 |
|
|
$ |
821,975 |
|
|
|
981,217 |
|
| |
|
|
|
|
3,223,315 |
|
|
|
|
|
|
|
2,851,119 |
|
| |
|
|
|
|
|
|
|
|
|
|
|
|
|
|
|
Metabolon, Inc. (6)(7)
|
|
Healthcare
|
|
|
|
|
|
|
|
|
|
|
|
|
|
Developing service and diagnostic products through the use of a metabolomics, or biochemical, profiling platform
|
|
|
|
|
|
|
|
|
|
|
|
|
|
|
|
Series B Convertible Preferred Stock
|
(M)
|
|
|
|
2,500,000 |
|
|
|
371,739 |
|
|
|
1,087,608 |
|
|
Series B-1 Convertible Preferred Stock
|
(M)
|
|
|
|
706,214 |
|
|
|
148,696 |
|
|
|
435,043 |
|
|
Series C Convertible Preferred Stock
|
(M)
|
|
|
|
1,000,000 |
|
|
|
1,000,000 |
|
|
|
1,000,000 |
|
|
Warrants for Series B-1 Convertible Preferred
|
|
|
|
|
|
|
|
|
|
|
|
|
|
|
|
Stock expiring 3/25/15
|
( I )
|
|
|
|
293,786 |
|
|
|
74,348 |
|
|
|
90,076 |
|
| |
|
|
|
|
4,500,000 |
|
|
|
|
|
|
|
2,612,727 |
|
| |
|
|
|
|
|
|
|
|
|
|
|
|
|
|
|
Nextreme Thermal Solutions, Inc. (6)(7)
|
|
Cleantech
|
|
|
|
|
|
|
|
|
|
|
|
|
|
Developing thin-film thermoelectric devices for cooling and energy conversion
|
|
|
|
|
|
|
|
|
|
|
|
|
|
|
|
Series A Convertible Preferred Stock
|
(M)
|
|
|
|
1,750,000 |
|
|
|
17,500 |
|
|
|
5,940 |
|
|
Series B Convertible Preferred Stock
|
(M)
|
|
|
|
2,634,762 |
|
|
|
4,870,244 |
|
|
|
269,389 |
|
| |
|
|
|
|
4,384,762 |
|
|
|
|
|
|
|
275,329 |
|
The accompanying notes are an integral part of these consolidated financial statements.
|
HARRIS & HARRIS GROUP, INC.
CONSOLIDATED SCHEDULE OF INVESTMENTS AS OF MARCH 31, 2011
(Unaudited)
|
| |
Method of
|
|
|
|
|
|
Shares/
|
|
|
|
|
| |
Valuation (1)
|
Industry (2)
|
|
Cost
|
|
|
Principal
|
|
|
Value
|
|
| |
|
|
|
|
|
|
|
|
|
|
|
|
Investments in Non-Controlled Affiliated Companies (3)(14) –
29.0% of net assets at value (Cont.)
|
|
|
|
|
|
|
|
|
|
|
|
| |
|
|
|
|
|
|
|
|
|
|
|
|
Private Placement Portfolio (Illiquid) –
29.0% of net assets at value (Cont.)
|
|
|
|
|
|
|
|
|
|
|
|
| |
|
|
|
|
|
|
|
|
|
|
|
|
Questech Corporation (6)(7)
|
|
Other
|
|
|
|
|
|
|
|
|
|
|
Manufacturing and marketing proprietary metal and stone products for home decoration
|
|
|
|
|
|
|
|
|
|
|
|
|
|
|
|
Common Stock
|
(M)
|
|
|
$ |
2,130,456 |
|
|
|
655,454 |
|
|
$ |
436,642 |
|
| |
|
|
|
|
|
|
|
|
|
|
|
|
|
|
|
SiOnyx, Inc. (6)(7)(8)
|
|
Electronics
|
|
|
|
|
|
|
|
|
|
|
|
|
|
Developing silicon-based optoelectronic products enabled by its proprietary Black Silicon
|
|
|
|
|
|
|
|
|
|
|
|
|
|
|
|
Series A Convertible Preferred Stock
|
(M)
|
|
|
|
750,000 |
|
|
|
233,499 |
|
|
|
160,367 |
|
|
Series A-1 Convertible Preferred Stock
|
(M)
|
|
|
|
890,000 |
|
|
|
2,966,667 |
|
|
|
2,037,507 |
|
|
Series A-2 Convertible Preferred Stock
|
(M)
|
|
|
|
2,445,000 |
|
|
|
4,207,537 |
|
|
|
2,889,736 |
|
|
Series B-1 Convertible Preferred Stock
|
(M)
|
|
|
|
1,169,561 |
|
|
|
1,892,836 |
|
|
|
1,300,000 |
|
|
Warrants for Series B-1 Convertible Preferred Stock expiring 2/23/17
|
( I )
|
|
|
|
130,439 |
|
|
|
247,350 |
|
|
|
139,505 |
|
| |
|
|
|
|
5,385,000 |
|
|
|
|
|
|
|
6,527,115 |
|
| |
|
|
|
|
|
|
|
|
|
|
|
|
|
|
|
Xradia, Inc. (6)(7)
|
|
Electronics
|
|
|
|
|
|
|
|
|
|
|
|
|
Designing, manufacturing and selling ultra- high resolution 3D x-ray microscopes and fluorescence imaging systems Series D Convertible Preferred Stock
|
(M)
|
|
|
|
4,000,000 |
|
|
|
3,121,099 |
|
|
|
8,530,276 |
|
| |
|
|
|
|
|
|
|
|
|
|
|
|
|
|
|
Total Non-Controlled Private Placement Portfolio (cost: $51,752,650)
|
|
|
|
|
|
|
|
|
|
$ |
42,541,213 |
|
| |
|
|
|
|
|
|
|
|
|
|
|
|
|
|
|
Total Investments in Non-Controlled Affiliated Companies (cost: $51,752,650)
|
|
|
|
|
|
|
|
|
|
$ |
42,541,213 |
|
The accompanying notes are an integral part of these consolidated financial statements.
|
HARRIS & HARRIS GROUP, INC.
CONSOLIDATED SCHEDULE OF INVESTMENTS AS OF MARCH 31, 2011
(Unaudited)
|
| |
Method of
|
|
|
|
|
|
Shares/
|
|
|
|
|
| |
Valuation (1)
|
Industry (2)
|
|
Cost
|
|
|
Principal
|
|
|
Value
|
|
| |
|
|
|
|
|
|
|
|
|
|
|
|
Investments in Controlled Affiliated Companies (3)(16) –
4.4% of net assets at value
|
|
|
|
|
|
|
|
|
|
|
|
| |
|
|
|
|
|
|
|
|
|
|
|
|
Private Placement Portfolio (Illiquid) –
4.4% of net assets at value
|
|
|
|
|
|
|
|
|
|
|
|
| |
|
|
|
|
|
|
|
|
|
|
|
|
Ancora Pharmaceuticals Inc. (6)(7)(8)
|
|
Healthcare
|
|
|
|
|
|
|
|
|
|
|
Developing synthetic carbohydrates for pharmaceutical applications
|
|
|
|
|
|
|
|
|
|
|
|
|
Series B Convertible Preferred Stock
|
(M)
|
|
|
$ |
1,600,000 |
|
|
|
1,663,808 |
|
|
$ |
3,258 |
|
|
Series C Convertible Preferred Stock
|
(M)
|
|
|
|
1,129,817 |
|
|
|
2,066,051 |
|
|
|
315,220 |
|
|
Secured Convertible Bridge Notes (including interest)
|
(M)
|
|
|
|
1,925,041 |
|
|
$ |
1,800,000 |
|
|
|
1,925,041 |
|
| |
|
|
|
|
4,654,858 |
|
|
|
|
|
|
|
2,243,519 |
|
| |
|
|
|
|
|
|
|
|
|
|
|
|
|
|
|
Laser Light Engines, Inc. (6)(7)(8)
|
|
Cleantech
|
|
|
|
|
|
|
|
|
|
|
|
|
|
Manufacturing solid-state light sources for digital cinema and large-venue projection displays
|
|
|
|
|
|
|
|
|
|
|
|
|
|
|
|
Series A Convertible Preferred Stock
|
(M)
|
|
|
|
2,000,000 |
|
|
|
7,499,062 |
|
|
|
1,273,774 |
|
|
Series B Convertible Preferred Stock
|
(M)
|
|
|
|
3,095,802 |
|
|
|
13,571,848 |
|
|
|
2,940,935 |
|
| |
|
|
|
|
5,095,802 |
|
|
|
|
|
|
|
4,214,709 |
|
| |
|
|
|
|
|
|
|
|
|
|
|
|
|
|
|
Total Controlled Private Placement Portfolio (cost: $9,750,660)
|
|
|
|
|
|
|
|
|
|
$ |
6,458,228 |
|
| |
|
|
|
|
|
|
|
|
|
|
|
|
|
|
|
Total Investments in Controlled Affiliated Companies (cost: $9,750,660)
|
|
|
|
|
|
|
|
|
|
$ |
6,458,228 |
|
| |
|
|
|
|
|
|
|
|
|
|
|
|
|
|
|
Total Private Placement and Publicly Traded Portfolio (cost: $97,077,350)
|
|
|
|
|
|
|
|
|
|
$ |
97,758,989 |
|
The accompanying notes are an integral part of these consolidated financial statements.
|
HARRIS & HARRIS GROUP, INC.
CONSOLIDATED SCHEDULE OF INVESTMENTS AS OF MARCH 31, 2011
(Unaudited)
|
| |
Method of
|
|
|
|
|
|
Shares/
|
|
|
|
|
| |
Valuation (1)
|
|
|
Cost
|
|
|
Principal
|
|
|
Value
|
|
| |
|
|
|
|
|
|
|
|
|
|
|
|
U.S. Government Securities (17) – 26.7% of net assets at value
|
|
|
|
|
|
|
|
|
|
|
|
| |
|
|
|
|
|
|
|
|
|
|
|
|
U.S. Treasury Bill — due date 04/14/11
|
(M)
|
|
|
$ |
17,999,204 |
|
|
$ |
18,000,000 |
|
|
$ |
17,999,820 |
|
|
U.S. Treasury Bill — due date 05/12/11
|
(M)
|
|
|
|
6,999,192 |
|
|
|
7,000,000 |
|
|
|
6,999,650 |
|
|
U.S. Treasury Bill — due date 06/09/11
|
(M)
|
|
|
|
7,099,466 |
|
|
|
7,100,000 |
|
|
|
7,099,077 |
|
|
U.S. Treasury Bill — due date 07/21/11
|
(M)
|
|
|
|
7,098,705 |
|
|
|
7,100,000 |
|
|
|
7,097,781 |
|
| |
|
|
|
|
|
|
|
|
|
|
|
|
|
|
|
Total Investments in U.S. Government Securities (cost: $39,196,567)
|
|
|
|
|
|
|
|
|
|
|
$ |
39,196,328 |
|
| |
|
|
|
|
|
|
|
|
|
|
|
|
|
|
|
Total Investments (cost: $136,273,917)
|
|
|
|
|
|
|
|
|
|
|
|
$ |
136,955,317 |
|
The accompanying notes are an integral part of these consolidated financial statements.
|
HARRIS & HARRIS GROUP, INC.
CONSOLIDATED SCHEDULE OF INVESTMENTS AS OF MARCH 31, 2011
(Unaudited)
|
Notes to Consolidated Schedule of Investments
|
(1)
|
See "Footnote to Consolidated Schedule of Investments" on page 29 for a description of the "Valuation Procedures."
|
|
(2)
|
We classify "Cleantech" companies as those that seek to improve performance, productivity or efficiency, and to reduce environmental impact, waste, cost, energy consumption or raw materials using nanotechnology-enabled solutions. We classify "Electronics" companies as those that use nanotechnology to address problems in electronics-related industries, including semiconductors. We classify "Healthcare" companies as those that use nanotechnology to address problems in healthcare-related industries, including biotechnology, pharmaceuticals and medical devices. We use the term "Other" for companies that operate primarily in industries other than those within "Cleantech," "Electronics" and "Healthcare." These industries include mining, decorative products and personal care products. In the first quarter of 2011, we renamed the sector classification "Electronics/Semiconductors" to "Electronics" and reclassified three companies, NeoPhotonics Corporation, Polatis, Inc., and Xradia, Inc., from a sector classification of "Other" to "Electronics" to reflect a broader definition of electronics to include photonics, metrology, and test and measurement. We also renamed the sector classification "Healthcare/Biotech" to "Healthcare."
|
|
(3)
|
Investments in unaffiliated companies consist of investments in which we own less than five percent of the voting shares of the portfolio company. Investments in non-controlled affiliated companies consist of investments in which we own five percent or more, but less than 25 percent, of the voting shares of the portfolio company, or where we hold one or more seats on the portfolio company’s Board of Directors but do not control the company. Investments in controlled affiliated companies consist of investments in which we own 25 percent or more of the voting shares of the portfolio company or otherwise control the company.
|
|
(4)
|
The aggregate cost for federal income tax purposes of investments in unaffiliated privately held companies is $28,274,450. The gross unrealized appreciation based on the tax cost for these securities is $21,280,201. The gross unrealized depreciation based on the tax cost for these securities is $5,242,946.
|
|
(5)
|
The aggregate cost for federal income tax purposes of investments in unaffiliated publicly traded companies is $7,299,590. The gross unrealized appreciation based on the tax cost for these securities is $0. The gross unrealized depreciation based on the tax cost for these securities is $2,851,747.
|
|
(6)
|
We are subject to legal restrictions on the sale of this investment.
|
|
(7)
|
Represents a non-income producing security. Investments that have not paid dividends or interest within the last 12 months are considered to be non-income producing.
|
|
(8)
|
These investments are development-stage companies. A development-stage company is defined as a company that is devoting substantially all of its efforts to establishing a new business, and either it has not yet commenced its planned principal operations, or it has commenced such operations but has not realized significant revenue from them.
|
|
(9)
|
With our investment in a convertible bridge note issued by Bridgelux, Inc., we received a warrant to purchase a number of shares of the class of stock sold in the next financing of Bridgelux, Inc., of up to 40 percent of the loan amount at the price per share sold in a financing or the price per share of the Series D Preferred Stock, whichever is lower. This warrant is exercisable commencing with the earlier of a financing of the company or December 31, 2011. This warrant is, therefore, a contingent asset as of March 31, 2011.
|
The accompanying notes are an integral part of this consolidated schedule.
|
HARRIS & HARRIS GROUP, INC.
CONSOLIDATED SCHEDULE OF INVESTMENTS AS OF MARCH 31, 2011
(Unaudited)
|
|
(10)
|
Cobalt Technologies, Inc., also does business as Cobalt Biofuels.
|
|
(11)
|
With our investment in a convertible bridge note issued by Ensemble Therapeutics Corporation we received a warrant to purchase a number of shares of the class of stock sold in the next financing of Ensemble Therapeutics Corporation equal to $149,539.57 divided by the price per share of the class of stock sold in the next financing of Ensemble Therapeutics Corporation. The ability to exercise this warrant is, therefore, contingent on Ensemble Therapeutics Corporation completing successfully a subsequent round of financing. This warrant shall expire and no longer be exercisable on September 10, 2015. The cost basis of this warrant is $89.86.
|
|
(12)
|
Initial investment was made during 2011.
|
|
(13)
|
The lock-up period on 400,907 of our shares of NeoPhotonics Corporation expires on August 1, 2011. Our remaining 50,000 shares are free of lock-up restrictions as of the date of this filing.
|
|
(14)
|
The aggregate cost for federal income tax purposes of investments in non-controlled affiliated companies is $51,752,650. The gross unrealized appreciation based on the tax cost for these securities is $7,524,273. The gross unrealized depreciation based on the tax cost for these securities is $16,735,710.
|
|
(15)
|
D-Wave Systems, Inc., is located and is doing business primarily in Canada. We invested in D-Wave Systems, Inc., through D-Wave USA, a Delaware company, which has changed its name to Parallel Universes, Inc. Our investment is denominated in Canadian dollars and is subject to foreign currency translation. See "Note 3. Summary of Significant Accounting Policies."
|
|
(16)
|
The aggregate cost for federal income tax purposes of investments in controlled affiliated companies is $9,750,660. The gross unrealized appreciation based on the tax cost for these securities is $0. The gross unrealized depreciation based on the tax cost for these securities is $3,292,432.
|
|
(17)
|
The aggregate cost for federal income tax purposes of our U.S. government securities is $39,196,567. The gross unrealized appreciation on the tax cost for these securities is $0. The gross unrealized depreciation on the tax cost of these securities is $239.
|
The accompanying notes are an integral part of this consolidated schedule.
|
HARRIS & HARRIS GROUP, INC.
CONSOLIDATED SCHEDULE OF INVESTMENTS AS OF DECEMBER 31, 2010
|
| |
Method of
|
|
|
Shares/
|
|
|
|
|
| |
Valuation (1)
|
Industry (2)
|
|
Principal
|
|
|
Value
|
|
| |
|
|
|
|
|
|
|
|
|
Investments in Unaffiliated Companies (3)(4) – 38.3% of net assets at value
|
|
|
|
|
|
|
|
|
| |
|
|
|
|
|
|
|
|
|
Private Placement Portfolio (Illiquid) – 38.3% of net assets at value
|
|
|
|
|
|
|
|
|
| |
|
|
|
|
|
|
|
|
|
BioVex Group, Inc. (5)(6)(7)(8) — Developing novel biologics for treatment of cancer and infectious disease
|
|
Healthcare/
Biotech
|
|
|
|
|
|
|
|
Series E Convertible Preferred Stock
|
(M)
|
|
|
|
2,799,552 |
|
|
$ |
5,839,158 |
|
|
Series G Convertible Preferred Stock
|
(M)
|
|
|
|
6,964,034 |
|
|
|
5,431,430 |
|
|
Warrants for Series G Convertible Preferred
|
|
|
|
|
|
|
|
|
|
|
|
Stock expiring 11/5/16
|
(M)
|
|
|
|
285,427 |
|
|
|
159,474 |
|
| |
|
|
|
|
|
|
|
|
11,430,062 |
|
| |
|
|
|
|
|
|
|
|
|
|
| |
|
|
|
|
|
|
|
|
|
|
|
Bridgelux, Inc. (5)(6) — Manufacturing high-power light emitting diodes (LEDs) and arrays
|
|
Cleantech
|
|
|
|
|
|
|
|
|
|
Series B Convertible Preferred Stock
|
(M)
|
|
|
|
1,861,504 |
|
|
|
1,759,121 |
|
|
Series C Convertible Preferred Stock
|
(M)
|
|
|
|
2,130,699 |
|
|
|
2,013,510 |
|
|
Series D Convertible Preferred Stock
|
(M)
|
|
|
|
999,999 |
|
|
|
945,000 |
|
|
Warrants for Series C Convertible Preferred
|
|
|
|
|
|
|
|
|
|
|
|
Stock expiring 12/31/14
|
( I )
|
|
|
|
163,900 |
|
|
|
86,867 |
|
|
Warrants for Series D Convertible Preferred
|
|
|
|
|
|
|
|
|
|
|
|
Stock expiring 8/26/14
|
( I )
|
|
|
|
166,665 |
|
|
|
58,500 |
|
| |
|
|
|
|
|
|
|
|
4,862,998 |
|
| |
|
|
|
|
|
|
|
|
|
|
|
Cobalt Technologies, Inc. (5)(6)(7)(9) — Developing processes for making biobutanol through biomass fermentation
|
|
Cleantech
|
|
|
|
|
|
|
|
|
|
Series C Convertible Preferred Stock
|
(M)
|
|
|
|
352,112 |
|
|
|
375,000 |
|
| |
|
|
|
|
|
|
|
|
|
|
| |
|
|
|
|
|
|
|
|
|
|
|
Ensemble Therapeutics Corporation (5)(6)(10) — Developing DNA-Programmed ChemistryTM for the discovery of new classes of therapeutics
|
|
Healthcare/ Biotech
|
|
|
|
|
|
|
|
|
|
Series B Convertible Preferred Stock
|
(M)
|
|
|
|
1,449,275 |
|
|
|
2,000,000 |
|
|
Unsecured Convertible Bridge Notes (including interest)
|
(M)
|
|
|
$ |
299,169 |
|
|
|
349,505 |
|
| |
|
|
|
|
|
|
|
|
2,349,505 |
|
| |
|
|
|
|
|
|
|
|
|
|
|
GEO Semiconductor Inc. (7)(11) — Developing programmable, high-performance video and geometry processing solutions Participation Agreement with Montage Capital relating to the following assets:
|
|
Electronics/
Semi-conductors
|
|
|
|
|
|
|
|
|
|
Senior Secured Debt, 13.75%, maturing on 06/30/12
|
( I )
|
|
|
$ |
500,000 |
|
|
|
424,920 |
|
|
Warrants for Series A Preferred Stock expiring on 09/17/17
|
( I )
|
|
|
|
100,000 |
|
|
|
46,500 |
|
| |
|
|
|
|
|
|
|
|
471,420 |
|
The accompanying notes are an integral part of these consolidated financial statements.
|
HARRIS & HARRIS GROUP, INC.
CONSOLIDATED SCHEDULE OF INVESTMENTS AS OF DECEMBER 31, 2010
|
| |
Method of
|
|
|
Shares/
|
|
|
|
|
| |
Valuation (1)
|
Industry (2)
|
|
Principal
|
|
|
Value
|
|
| |
|
|
|
|
|
|
|
|
|
Investments in Unaffiliated Companies (3)(4) –
38.3% of net assets at value (Cont.)
|
|
|
|
|
|
|
|
|
| |
|
|
|
|
|
|
|
|
|
Private Placement Portfolio (Illiquid) – 38.3% of net assets at value (Cont.)
|
|
|
|
|
|
|
|
|
| |
|
|
|
|
|
|
|
|
|
Molecular Imprints, Inc. (5)(6) — Manufacturing nanoimprint lithography capital equipment
|
|
Electronics/
Semi-conductors
|
|
|
|
|
|
|
|
Series B Convertible Preferred Stock
|
(M)
|
|
|
|
1,333,333 |
|
|
$ |
1,861,111 |
|
|
Series C Convertible Preferred Stock
|
(M)
|
|
|
|
1,250,000 |
|
|
|
2,013,889 |
|
|
Warrants for Series C Convertible Preferred
|
|
|
|
|
|
|
|
|
|
|
|
Stock expiring 12/31/11
|
( I )
|
|
|
|
125,000 |
|
|
|
69,375 |
|
| |
|
|
|
|
|
|
|
|
3,944,375 |
|
| |
|
|
|
|
|
|
|
|
|
|
|
Nanosys, Inc. (5)(6) — Developing inorganic nanowires and quantum dots for use in batteries and LED-backlit devices
|
|
Cleantech
|
|
|
|
|
|
|
|
|
|
Series C Convertible Preferred Stock
|
(M)
|
|
|
|
803,428 |
|
|
|
916,225 |
|
|
Series D Convertible Preferred Stock
|
(M)
|
|
|
|
1,016,950 |
|
|
|
1,239,680 |
|
|
Series E Convertible Preferred Stock
|
(M)
|
|
|
|
433,688 |
|
|
|
745,076 |
|
| |
|
|
|
|
|
|
|
|
2,900,981 |
|
|
Nantero, Inc. (5)(6)(7) — Developing a high-density, nonvolatile, random access memory chip, enabled by carbon nanotubes
|
|
Electronics/
Semi-conductors
|
|
|
|
|
|
|
|
|
|
Series A Convertible Preferred Stock
|
(M)
|
|
|
|
345,070 |
|
|
|
1,046,908 |
|
|
Series B Convertible Preferred Stock
|
(M)
|
|
|
|
207,051 |
|
|
|
628,172 |
|
|
Series C Convertible Preferred Stock
|
(M)
|
|
|
|
188,315 |
|
|
|
571,329 |
|
| |
|
|
|
|
|
|
|
|
2,246,409 |
|
| |
|
|
|
|
|
|
|
|
|
|
|
NeoPhotonics Corporation (5)(6)(12) — Developing and manufacturing optical devices and components
|
|
Other
|
|
|
|
|
|
|
|
|
|
Common Stock
|
(M)
|
|
|
|
45,214 |
|
|
|
479,269 |
|
|
Series 1 Convertible Preferred Stock
|
(M)
|
|
|
|
73,250 |
|
|
|
776,450 |
|
|
Series 2 Convertible Preferred Stock
|
(M)
|
|
|
|
29,675 |
|
|
|
314,555 |
|
|
Series 3 Convertible Preferred Stock
|
(M)
|
|
|
|
110,000 |
|
|
|
1,166,000 |
|
|
Series X Convertible Preferred Stock
|
(M)
|
|
|
|
142,768 |
|
|
|
1,513,341 |
|
| |
|
|
|
|
|
|
|
|
4,249,615 |
|
| |
|
|
|
|
|
|
|
|
|
|
|
Polatis, Inc. (5)(6)(7) — Developing MEMS-based optical networking components
|
|
Other
|
|
|
|
|
|
|
|
|
|
Common Stock
|
(M)
|
|
|
|
16,438 |
|
|
|
0 |
|
|
Series A-1 Convertible Preferred Stock
|
(M)
|
|
|
|
16,775 |
|
|
|
0 |
|
|
Series A-2 Convertible Preferred Stock
|
(M)
|
|
|
|
71,611 |
|
|
|
0 |
|
|
Series A-4 Convertible Preferred Stock
|
(M)
|
|
|
|
4,774 |
|
|
|
0 |
|
| |
|
|
|
|
|
|
|
|
0 |
|
The accompanying notes are an integral part of these consolidated financial statements.
|
HARRIS & HARRIS GROUP, INC.
CONSOLIDATED SCHEDULE OF INVESTMENTS AS OF DECEMBER 31, 2010
|
| |
Method of
|
|
|
Shares/
|
|
|
|
|
| |
Valuation (1)
|
Industry (2)
|
|
Principal
|
|
|
Value
|
|
| |
|
|
|
|
|
|
|
|
|
Investments in Unaffiliated Companies (3)(4) –
38.3% of net assets at value (Cont.)
|
|
|
|
|
|
|
|
|
| |
|
|
|
|
|
|
|
|
|
Private Placement Portfolio (Illiquid) – 38.3% of net assets at value (Cont.)
|
|
|
|
|
|
|
|
|
| |
|
|
|
|
|
|
|
|
| |
|
|
|
|
|
|
|
|
|
PolyRemedy, Inc. (5)(6)(7) — Developing a platform for producing and tracking the use of wound treatment patches
|
|
Healthcare/
Biotech
|
|
|
|
|
|
|
|
Series B-1 Convertible Preferred Stock
|
(M)
|
|
|
|
287,647 |
|
|
$ |
23,466 |
|
|
Series B-2 Convertible Preferred Stock
|
(M)
|
|
|
|
676,147 |
|
|
|
30,427 |
|
| |
|
|
|
|
|
|
|
|
53,893 |
|
| |
|
|
|
|
|
|
|
|
|
|
|
Siluria Technologies, Inc. (5)(6)(7)(13) — Developing nanomaterials for manufacturing of chemicals
|
|
Cleantech
|
|
|
|
|
|
|
|
|
|
Series S-2 Convertible Preferred Stock
|
(M)
|
|
|
|
612,061 |
|
|
|
204,000 |
|
| |
|
|
|
|
|
|
|
|
|
|
|
Solazyme, Inc. (5)(6)(7) — Developing algal biodiesel, industrial chemicals and specialty ingredients using synthetic biology
|
|
Cleantech
|
|
|
|
|
|
|
|
|
|
Series A Convertible Preferred Stock
|
(M)
|
|
|
|
988,204 |
|
|
|
9,961,096 |
|
|
Series B Convertible Preferred Stock
|
(M)
|
|
|
|
495,246 |
|
|
|
4,992,080 |
|
|
Series C Convertible Preferred Stock
|
(M)
|
|
|
|
651,309 |
|
|
|
6,565,195 |
|
|
Series D Convertible Preferred Stock
|
(M)
|
|
|
|
169,390 |
|
|
|
1,707,451 |
|
| |
|
|
|
|
|
|
|
|
23,225,822 |
|
| |
|
|
|
|
|
|
|
|
|
|
|
TetraVitae Bioscience, Inc. (5)(6)(7)(14) — Developing methods of producing alternative chemicals and fuels through biomass fermentation
|
|
Cleantech
|
|
|
|
|
|
|
|
|
|
Common Stock
|
(M)
|
|
|
|
118,804 |
|
|
|
0 |
|
| |
|
|
|
|
|
|
|
|
|
|
|
Ultora, Inc. (5)(6)(7)(11) — Developing energy-storage devices enabled by carbon nanotubes
|
|
Cleantech
|
|
|
|
|
|
|
|
|
|
Secured Convertible Bridge Note (including interest)
|
(M)
|
|
|
$ |
1,250 |
|
|
|
1,250 |
|
| |
|
|
|
|
|
|
|
|
|
|
|
Total Unaffiliated Private Placement Portfolio (cost: $37,480,266)
|
|
|
|
|
|
|
|
$ |
56,315,330 |
|
| |
|
|
|
|
|
|
|
|
|
|
| |
|
|
|
|
|
|
|
|
|
|
|
Total Investments in Unaffiliated Companies (cost: $37,480,266)
|
|
|
|
|
|
|
|
$ |
56,315,330 |
|
The accompanying notes are an integral part of these consolidated financial statements.
|
HARRIS & HARRIS GROUP, INC.
CONSOLIDATED SCHEDULE OF INVESTMENTS AS OF DECEMBER 31, 2010
|
| |
Method of
|
|
|
Shares/
|
|
|
|
|
| |
Valuation (1)
|
Industry (2)
|
|
Principal
|
|
|
Value
|
|
| |
|
|
|
|
|
|
|
|
|
Investments in Non-Controlled Affiliated Companies (3)(15) –
29.1% of net assets at value
|
|
|
|
|
|
|
|
|
| |
|
|
|
|
|
|
|
|
|
Private Placement Portfolio (Illiquid) – 29.1% of net assets at value
|
|
|
|
|
|
|
|
|
| |
|
|
|
|
|
|
|
|
| |
|
|
|
|
|
|
|
|
|
ABS Materials, Inc. (5)(7)(11) — Developing nano-structured absorbent materials for environmental remediation and for the petroleum industry
|
|
Cleantech
|
|
|
|
|
|
|
|
Series A Convertible Preferred Stock
|
(M)
|
|
|
|
375,000 |
|
|
$ |
375,000 |
|
| |
|
|
|
|
|
|
|
|
|
|
|
Adesto Technologies Corporation (5)(6)(7) — Developing low-power, high-performance memory devices
|
|
Electronics/
Semi-conductors
|
|
|
|
|
|
|
|
|
|
Series A Convertible Preferred Stock
|
(M)
|
|
|
|
6,547,619 |
|
|
|
2,420,000 |
|
|
Series B Convertible Preferred Stock
|
(M)
|
|
|
|
5,952,381 |
|
|
|
2,200,000 |
|
| |
|
|
|
|
|
|
|
|
4,620,000 |
|
|
Cambrios Technologies Corporation (5)(6)(7) – Developing nanowire-enabled electronic materials for the display industry
|
|
Electronics/
Semi-conductors
|
|
|
|
|
|
|
|
|
|
Series B Convertible Preferred Stock
|
(M)
|
|
|
|
1,294,025 |
|
|
|
323,506 |
|
|
Series C Convertible Preferred Stock
|
(M)
|
|
|
|
1,300,000 |
|
|
|
586,690 |
|
|
Series D Convertible Preferred Stock
|
(M)
|
|
|
|
515,756 |
|
|
|
644,695 |
|
|
Unsecured Convertible Bridge Note (including interest)
|
(M)
|
|
|
$ |
92,400 |
|
|
|
93,332 |
|
| |
|
|
|
|
|
|
|
|
1,648,223 |
|
| |
|
|
|
|
|
|
|
|
|
|
|
Contour Energy Systems, Inc. (5)(6)(7)(16) — Developing batteries using nanostructured materials
|
|
Cleantech
|
|
|
|
|
|
|
|
|
|
Series A Convertible Preferred Stock
|
(M)
|
|
|
|
2,565,798 |
|
|
|
2,822,378 |
|
|
Series B Convertible Preferred Stock
|
(M)
|
|
|
|
812,500 |
|
|
|
1,300,000 |
|
| |
|
|
|
|
|
|
|
|
4,122,378 |
|
| |
|
|
|
|
|
|
|
|
|
|
|
Crystal IS, Inc. (5)(6) — Developing single-crystal aluminum nitride substrates for light-emitting diodes
|
|
Cleantech
|
|
|
|
|
|
|
|
|
|
Common Stock
|
(M)
|
|
|
|
3,994,468 |
|
|
|
0 |
|
|
Warrants for Series A-1 Preferred Stock expiring 05/05/13
|
( I )
|
|
|
|
15,231 |
|
|
|
0 |
|
|
Warrants for Series A-1 Preferred Stock expiring 05/12/13
|
( I )
|
|
|
|
2,350 |
|
|
|
0 |
|
|
Warrants for Series A-1 Preferred Stock expiring 08/08/13
|
( I )
|
|
|
|
4,396 |
|
|
|
0 |
|
| |
|
|
|
|
|
|
|
|
0 |
|
The accompanying notes are an integral part of these consolidated financial statements.
|
HARRIS & HARRIS GROUP, INC.
CONSOLIDATED SCHEDULE OF INVESTMENTS AS OF DECEMBER 31, 2010
|
| |
Method of
|
|
|
Shares/
|
|
|
|
|
| |
Valuation (1)
|
Industry (2)
|
|
Principal
|
|
|
Value
|
|
| |
|
|
|
|
|
|
|
|
|
Investments in Non-Controlled Affiliated Companies (3)(15) –
29.1% of net assets at value (Cont.)
|
|
|
|
|
|
|
|
|
| |
|
|
|
|
|
|
|
|
|
Private Placement Portfolio (Illiquid) – 29.1% of net assets at value (Cont.)
|
|
|
|
|
|
|
|
|
| |
|
|
|
|
|
|
|
|
|
D-Wave Systems, Inc. (5)(6)(7)(17) — Developing high- performance quantum computing systems
|
|
Electronics/
Semi-conductors
|
|
|
|
|
|
|
|
Series B Convertible Preferred Stock
|
(M)
|
|
|
|
1,144,869 |
|
|
$ |
1,343,504 |
|
|
Series C Convertible Preferred Stock
|
(M)
|
|
|
|
450,450 |
|
|
|
528,603 |
|
|
Series D Convertible Preferred Stock
|
(M)
|
|
|
|
1,533,395 |
|
|
|
1,799,439 |
|
|
Series E Convertible Preferred Stock
|
(M)
|
|
|
|
269,280 |
|
|
|
316,000 |
|
|
Series F Convertible Preferred Stock
|
(M)
|
|
|
|
258,721 |
|
|
|
303,609 |
|
|
Warrants for Common Stock expiring 06/30/15
|
( I )
|
|
|
|
153,890 |
|
|
|
74,329 |
|
| |
|
|
|
|
|
|
|
|
4,365,484 |
|
| |
|
|
|
|
|
|
|
|
|
|
| |
|
|
|
|
|
|
|
|
|
|
|
Enumeral Biomedical Corp. (5)(6)(7)(18) — Developing therapeutics and diagnostics through functional assaying of single cells
|
|
Healthcare/
Biotech
|
|
|
|
|
|
|
|
|
|
Unsecured Convertible Bridge Note (including interest)
|
(M)
|
|
|
$ |
250,000 |
|
|
|
270,493 |
|
| |
|
|
|
|
|
|
|
|
|
|
|
Innovalight, Inc. (5)(6)(7) — Developing silicon-based nanomaterials for use in the solar energy industry
|
|
Cleantech
|
|
|
|
|
|
|
|
|
|
Series B Convertible Preferred Stock
|
(M)
|
|
|
|
16,666,666 |
|
|
|
1,315,001 |
|
|
Series C Convertible Preferred Stock
|
(M)
|
|
|
|
5,810,577 |
|
|
|
1,734,521 |
|
|
Series D Convertible Preferred Stock
|
(M)
|
|
|
|
4,046,974 |
|
|
|
676,027 |
|
| |
|
|
|
|
|
|
|
|
3,725,549 |
|
| |
|
|
|
|
|
|
|
|
|
|
|
Kovio, Inc. (5)(6) — Developing semiconductor products using printed electronics and thin-film technologies
|
|
Electronics/
Semi-conductors
|
|
|
|
|
|
|
|
|
|
Series A' Convertible Preferred Stock
|
(M)
|
|
|
|
2,160,000 |
|
|
|
540,000 |
|
|
Series A3X Convertible Preferred Stock
|
(M)
|
|
|
|
526,225 |
|
|
|
803,113 |
|
| |
|
|
|
|
|
|
|
|
1,343,113 |
|
| |
|
|
|
|
|
|
|
|
|
|
|
Mersana Therapeutics, Inc. (5)(6)(7)(19) — Developing treatments for cancer based on novel drug delivery polymers
|
|
Healthcare/
Biotech
|
|
|
|
|
|
|
|
|
|
Series A Convertible Preferred Stock
|
(M)
|
|
|
|
68,451 |
|
|
|
136,902 |
|
|
Series B Convertible Preferred Stock
|
(M)
|
|
|
|
866,500 |
|
|
|
1,733,000 |
|
|
Unsecured Convertible Bridge Notes (including interest)
|
(M)
|
|
|
$ |
821,975 |
|
|
|
960,948 |
|
| |
|
|
|
|
|
|
|
|
2,830,850 |
|
The accompanying notes are an integral part of these consolidated financial statements.
|
HARRIS & HARRIS GROUP, INC.
CONSOLIDATED SCHEDULE OF INVESTMENTS AS OF DECEMBER 31, 2010
|
| |
Method of
|
|
|
Shares/
|
|
|
|
|
| |
Valuation (1)
|
Industry (2)
|
|
Principal
|
|
|
Value
|
|
| |
|
|
|
|
|
|
|
|
|
Investments in Non-Controlled Affiliated Companies (3)(15) –
29.1% of net assets at value (Cont.)
|
|
|
|
|
|
|
|
|
| |
|
|
|
|
|
|
|
|
|
Private Placement Portfolio (Illiquid) – 29.1% of net assets at value (Cont.)
|
|
|
|
|
|
|
|
|
| |
|
|
|
|
|
|
|
|
|
Metabolon, Inc. (5)(6) — Developing service and diagnostic products through the use of a metabolomics, or biochemical, profiling platform
|
|
Healthcare/
Biotech
|
|
|
|
|
|
|
|
Series B Convertible Preferred Stock
|
(M)
|
|
|
|
371,739 |
|
|
$ |
1,087,608 |
|
|
Series B-1 Convertible Preferred Stock
|
(M)
|
|
|
|
148,696 |
|
|
|
435,043 |
|
|
Series C Convertible Preferred Stock
|
(M)
|
|
|
|
1,000,000 |
|
|
|
1,000,000 |
|
|
Warrants for Series B-1 Convertible Preferred
|
|
|
|
|
|
|
|
|
|
|
|
Stock expiring 3/25/15
|
( I )
|
|
|
|
74,348 |
|
|
|
95,493 |
|
| |
|
|
|
|
|
|
|
|
2,618,144 |
|
| |
|
|
|
|
|
|
|
|
|
|
|
Nextreme Thermal Solutions, Inc. (5)(6) — Developing thin-film thermoelectric devices for cooling and energy conversion
|
|
Cleantech
|
|
|
|
|
|
|
|
|
|
Series A Convertible Preferred Stock
|
(M)
|
|
|
|
17,500 |
|
|
|
23,762 |
|
|
Series B Convertible Preferred Stock
|
(M)
|
|
|
|
4,870,244 |
|
|
|
526,895 |
|
| |
|
|
|
|
|
|
|
|
550,657 |
|
| |
|
|
|
|
|
|
|
|
|
|
|
Questech Corporation (5)(6) — Manufacturing and marketing proprietary metal and stone products for home decoration
|
|
Other
|
|
|
|
|
|
|
|
|
|
Common Stock
|
(M)
|
|
|
|
655,454 |
|
|
|
498,145 |
|
| |
|
|
|
|
|
|
|
|
|
|
|
SiOnyx, Inc. (5)(6)(7) — Developing silicon-based optoelectronic products enabled by its proprietary Black Silicon
|
|
Electronics/
Semi-conductors
|
|
|
|
|
|
|
|
|
|
Series A Convertible Preferred Stock
|
(M)
|
|
|
|
233,499 |
|
|
|
160,367 |
|
|
Series A-1 Convertible Preferred Stock
|
(M)
|
|
|
|
2,966,667 |
|
|
|
2,037,507 |
|
|
Series A-2 Convertible Preferred Stock
|
(M)
|
|
|
|
4,207,537 |
|
|
|
2,889,736 |
|
|
Series B-1 Convertible Preferred Stock
|
(M)
|
|
|
|
1,892,836 |
|
|
|
1,300,000 |
|
|
Warrants for Series B-1 Convertible Preferred
|
|
|
|
|
|
|
|
|
|
|
|
Stock expiring 2/23/17
|
( I )
|
|
|
|
247,350 |
|
|
|
140,742 |
|
| |
|
|
|
|
|
|
|
|
6,528,352 |
|
The accompanying notes are an integral part of these consolidated financial statements.
|
HARRIS & HARRIS GROUP, INC.
CONSOLIDATED SCHEDULE OF INVESTMENTS AS OF DECEMBER 31, 2010
|
| |
Method of
|
|
|
|
Shares/
|
|
|
|
|
| |
Valuation (1)
|
|
Industry (2)
|
|
Principal
|
|
|
Value
|
|
| |
|
|
|
|
|
|
|
|
|
|
Investments in Non-Controlled Affiliated Companies (3)(15) –
29.1% of net assets at value (Cont.)
|
|
|
|
|
|
|
|
|
|
| |
|
|
|
|
|
|
|
|
|
|
Private Placement Portfolio (Illiquid) – 29.1% of net assets at value (Cont.)
|
|
|
|
|
|
|
|
|
|
| |
|
|
|
|
|
|
|
|
|
|
Xradia, Inc. (5)(6) — Designing, manufacturing and selling ultra-high resolution 3D x-ray microscopes and fluorescence imaging systems
|
|
|
Other
|
|
|
|
|
|
|
|
Series D Convertible Preferred Stock
|
(M)
|
|
|
|
|
3,121,099 |
|
|
$ |
9,279,027 |
|
| |
|
|
|
|
|
|
|
|
|
|
|
|
Total Non-Controlled Private Placement Portfolio (cost: $51,451,965)
|
|
|
|
|
|
|
|
|
$ |
42,775,415 |
|
| |
|
|
|
|
|
|
|
|
|
|
|
|
Total Investments in Non-Controlled Affiliated Companies (cost: $51,451,965)
|
|
|
|
|
|
|
|
|
$ |
42,775,415 |
|
The accompanying notes are an integral part of these consolidated financial statements.
|
HARRIS & HARRIS GROUP, INC.
CONSOLIDATED SCHEDULE OF INVESTMENTS AS OF DECEMBER 31, 2010
|
| |
Method of
|
Shares/
|
|
|
|
|
|
|
| |
Valuation (1)
|
Industry (2)
|
|
Principal
|
|
|
Value
|
|
| |
|
|
|
|
|
|
|
|
|
Investments in Controlled Affiliated Companies (3)(20) –
4.8% of net assets at value
|
|
|
|
|
|
|
|
|
| |
|
|
|
|
|
|
|
|
|
Private Placement Portfolio (Illiquid) – 4.8% of net assets at value
|
|
|
|
|
|
|
|
|
| |
|
|
|
|
|
|
|
|
|
Ancora Pharmaceuticals Inc. (5)(6)(7) — Developing synthetic carbohydrates for pharmaceutical applications
|
|
Healthcare/
Biotech
|
|
|
|
|
|
|
|
Series B Convertible Preferred Stock
|
(M)
|
|
|
|
1,663,808 |
|
|
$ |
9,773 |
|
|
Series C Convertible Preferred Stock
|
(M)
|
|
|
|
2,066,051 |
|
|
|
945,661 |
|
|
Secured Convertible Bridge Notes (including interest)
|
(M)
|
|
|
$ |
1,800,000 |
|
|
|
1,889,534 |
|
| |
|
|
|
|
|
|
|
|
2,844,968 |
|
| |
|
|
|
|
|
|
|
|
|
|
|
Laser Light Engines, Inc. (5)(6)(7) — Manufacturing solid-state light sources for digital cinema and large-venue projection displays
|
|
Cleantech
|
|
|
|
|
|
|
|
|
|
Series A Convertible Preferred Stock
|
(M)
|
|
|
|
7,499,062 |
|
|
|
1,273,774 |
|
|
Series B Convertible Preferred Stock
|
(M)
|
|
|
|
13,571,848 |
|
|
|
2,940,935 |
|
| |
|
|
|
|
|
|
|
|
4,214,709 |
|
| |
|
|
|
|
|
|
|
|
|
|
|
Total Controlled Private Placement Portfolio (cost: $9,715,153)
|
|
|
|
|
|
|
|
$ |
7,059,677 |
|
| |
|
|
|
|
|
|
|
|
|
|
|
Total Investments in Controlled Affiliated Companies (cost: $9,715,153)
|
|
|
|
|
|
|
|
$ |
7,059,677 |
|
| |
|
|
|
|
|
|
|
|
|
|
|
Total Private Placement Portfolio (cost: $98,647,384)
|
|
|
|
|
|
|
|
$ |
106,150,422 |
|
The accompanying notes are an integral part of these consolidated financial statements.
|
HARRIS & HARRIS GROUP, INC.
CONSOLIDATED SCHEDULE OF INVESTMENTS AS OF DECEMBER 31, 2010
|
| |
Method of
|
|
|
Shares/
|
|
|
|
|
| |
Valuation (1)
|
|
|
Principal
|
|
|
Value
|
|
| |
|
|
|
|
|
|
|
|
|
U.S. Government Securities (21) – 26.0% of net assets at value
|
|
|
|
|
|
|
|
|
| |
|
|
|
|
|
|
|
|
|
U.S. Treasury Bill — due date 01/13/11
|
(M)
|
|
|
$ |
38,275,000 |
|
|
$ |
38,274,617 |
|
| |
|
|
|
|
|
|
|
|
|
|
|
Total Investments in U.S. Government Securities (cost: $38,273,349)
|
|
|
|
|
|
|
|
$ |
38,274,617 |
|
| |
|
|
|
|
|
|
|
|
|
|
|
Total Investments (cost: $136,920,733)
|
|
|
|
|
|
|
|
$ |
144,425,039 |
|
The accompanying notes are an integral part of these consolidated financial statements.
|
HARRIS & HARRIS GROUP, INC.
CONSOLIDATED SCHEDULE OF INVESTMENTS AS OF DECEMBER 31, 2010
|
Notes to Consolidated Schedule of Investments
|
(1)
|
See "Footnote to Consolidated Schedule of Investments" on page 29 for a description of the "Valuation Procedures."
|
|
(2)
|
We classify "Cleantech" companies as those that seek to improve performance, productivity or efficiency, and to reduce environmental impact, waste, cost, energy consumption or raw materials using nanotechnology-enabled solutions. We classify "Electronics/Semiconductors" companies as those that use nanotechnology to address problems in electronics-related industries, including semiconductors. We classify "Healthcare/Biotech" companies as those that use nanotechnology to address problems in healthcare-related industries, including biotechnology, pharmaceuticals and medical devices. We use the term "Other" for companies that operate primarily in industries other than those within "Cleantech," "Electronics/Semiconductors" and "Healthcare/Biotech." These industries include photonics, metrology, test and measurement, materials, mining, decorative products and personal care products.
|
|
(3)
|
Investments in unaffiliated companies consist of investments in which we own less than five percent of the voting shares of the portfolio company. Investments in non-controlled affiliated companies consist of investments in which we own five percent or more, but less than 25 percent, of the voting shares of the portfolio company, or where we hold one or more seats on the portfolio company’s Board of Directors but do not control the company. Investments in controlled affiliated companies consist of investments in which we own 25 percent or more of the voting shares of the portfolio company or otherwise control the company.
|
|
(4)
|
The aggregate cost for federal income tax purposes of investments in unaffiliated privately held companies is $37,480,266. The gross unrealized appreciation based on the tax cost for these securities is $26,953,688. The gross unrealized depreciation based on the tax cost for these securities is $8,118,624.
|
|
(5)
|
We are subject to legal restrictions on the sale of this investment.
|
|
(6)
|
Represents a non-income producing security. Investments that have not paid dividends or interest within the last 12 months are considered to be non-income producing.
|
|
(7)
|
These investments are development-stage companies. A development-stage company is defined as a company that is devoting substantially all of its efforts to establishing a new business, and either it has not yet commenced its planned principal operations, or it has commenced such operations but has not realized significant revenue from them.
|
|
(8)
|
On March 4, 2011, Amgen, Inc., and BioVex Group, Inc., announced the completion of the acquisition of BioVex Group, Inc. With our purchase of Series E Convertible Preferred Stock of BioVex Group, Inc., we received a contingent warrant that was cancelled as a result of the acquisition of BioVex Group, Inc., by Amgen, Inc.
|
|
(9)
|
Cobalt Technologies, Inc., also does business as Cobalt Biofuels.
|
The accompanying notes are an integral part of this consolidated schedule.
|
HARRIS & HARRIS GROUP, INC.
CONSOLIDATED SCHEDULE OF INVESTMENTS AS OF DECEMBER 31, 2010
|
|
(10)
|
On June 9, 2010, Ensemble Discovery Corporation changed its name to Ensemble Therapeutics Corporation. With our investment in a convertible bridge note issued by Ensemble Therapeutics Corporation, we received a warrant to purchase a number of shares of the class of stock sold in the next financing of Ensemble Therapeutics Corporation equal to $149,539.57 divided by the price per share of the class of stock sold in the next financing of Ensemble Therapeutics Corporation. The ability to exercise this warrant is, therefore, contingent on Ensemble Therapeutics Corporation completing successfully a subsequent round of financing. This warrant shall expire and no longer be exercisable on September 10, 2015. The cost basis of this warrant is $89.86.
|
|
(11)
|
Initial investment was made during 2010.
|
|
(12)
|
On February 2, 2011, NeoPhotonics Corporation priced its initial public offering ("IPO") of 7,500,000 shares of common stock at $11 per share.
|
|
(13)
|
On February 28, 2011, Harris & Harris Group sold its shares of Siluria Technologies, Inc., for an amount not materially different from the value of the shares as of December 31, 2010. See "Note 12. Subsequent Events."
|
|
(14)
|
With our purchase of the Series B Convertible Preferred Stock of TetraVitae Bioscience, Inc., we received the right to purchase, at a price of $2.63038528 per share, a number of shares in the Series C financing equal to the number of shares of Series B Preferred Stock purchased. The ability to exercise this right is contingent on TetraVitae Bioscience, Inc., completing successfully a subsequent round of financing. This warrant was cancelled as a result of the conversion of our preferred stock into common stock.
|
|
(15)
|
The aggregate cost for federal income tax purposes of investments in non-controlled affiliated companies is $51,451,965. The gross unrealized appreciation based on the tax cost for these securities is $8,260,861. The gross unrealized depreciation based on the tax cost for these securities is $16,937,411.
|
|
(16)
|
On February 28, 2008, Lifco, Inc., merged with CFX Battery, Inc. The surviving entity was CFX Battery, Inc. On February 24, 2010, CFX Battery, Inc., changed its name to Contour Energy Systems, Inc.
|
|
(17)
|
D-Wave Systems, Inc., is located and is doing business primarily in Canada. We invested in D-Wave Systems, Inc., through D-Wave USA, a Delaware company. Our investment is denominated in Canadian dollars and is subject to foreign currency translation. See "Note 2. Summary of Significant Accounting Policies."
|
|
(18)
|
On November 9, 2010, Enumeral Technologies, Inc., changed its name to Enumeral Biomedical Corp.
|
|
(19)
|
Warrants expired unexercised subsequent to September 30, 2010.
|
|
(20)
|
The aggregate cost for federal income tax purposes of investments in controlled affiliated companies is $9,715,153. The gross unrealized appreciation based on the tax cost for these securities is $0. The gross unrealized depreciation based on the tax cost for these securities is $2,655,476.
|
|
(21)
|
The aggregate cost for federal income tax purposes of our U.S. government securities is $38,273,349. The gross unrealized appreciation on the tax cost for these securities is $1,268. The gross unrealized depreciation on the tax cost of these securities is $0.
|
The accompanying notes are an integral part of this consolidated schedule.
|
HARRIS & HARRIS GROUP, INC.
FOOTNOTE TO CONSOLIDATED SCHEDULE OF INVESTMENTS
|
VALUATION PROCEDURES
|
I.
|
Determination of Net Asset Value
|
The 1940 Act requires periodic valuation of each investment in the portfolio of the Company to determine its net asset value. Under the 1940 Act, unrestricted securities with readily available market quotations are to be valued at the current market value; all other assets must be valued at "fair value" as determined in good faith by or under the direction of the Board of Directors.
The Board of Directors is responsible for (1) determining overall valuation guidelines and (2) ensuring that the investments of the Company are valued within the prescribed guidelines.
The Valuation Committee, comprised of all of the independent Board members, is responsible for determining the valuation of the Company’s assets within the guidelines established by the Board of Directors. The Valuation Committee receives information and recommendations from management. An independent valuation firm also reviews select portfolio company valuations. The independent valuation firm does not provide proposed valuations.
The values assigned to these investments are based on available information and do not necessarily represent amounts that might ultimately be realized when that investment is sold, as such amounts depend on future circumstances and cannot reasonably be determined until the individual investments are actually liquidated or become readily marketable.
|
II.
|
Approaches to Determining Fair Value
|
Accounting principles generally accepted in the United States of America ("GAAP") define fair value as the price that would be received to sell an asset or paid to transfer a liability in an orderly transaction between market participants at the measurement date (exit price). In effect, GAAP applies fair value terminology to all valuations whereas the 1940 Act applies market value terminology to readily marketable assets and fair value terminology to other assets.
The main approaches to measuring fair value utilized are the market approach and the income approach.
|
|
·
|
Market Approach (M): The market approach uses prices and other relevant information generated by market transactions involving identical or comparable assets or liabilities. For example, the market approach often uses market multiples derived from a set of comparables. Multiples might lie in ranges with a different multiple for each comparable. The selection of where within the range each appropriate multiple falls requires judgment considering factors specific to the measurement (qualitative and quantitative).
|
|
|
·
|
Income Approach (I): The income approach uses valuation techniques to convert future amounts (for example, cash flows or earnings) to a single present value amount (discounted). The measurement is based on the value indicated by current market expectations about those future amounts. Those valuation techniques include present value techniques; option-pricing models, such as the Black-Scholes-Merton formula (a closed-form model) and a binomial model (a lattice model), which incorporate present value techniques; and the multi-period excess earnings method, which is used to measure the fair value of certain assets.
|
GAAP classifies the inputs used to measure fair value by these approaches into the following hierarchy:
|
|
·
|
Level 1: Unadjusted quoted prices in active markets for identical assets or liabilities.
|
|
|
·
|
Level 2: Quoted prices in active markets for similar assets or liabilities, or quoted prices for identical or similar assets or liabilities in markets that are not active, or inputs other than quoted prices that are observable for the asset or liability.
|
| |
·
|
Level 3: Unobservable inputs for the asset or liability.
|
Financial assets and liabilities are classified in their entirety based on the lowest level of input that is significant to the fair value measurement and are not necessarily an indication of risks associated with the investment.
|
III.
|
Investment Categories
|
The Company’s investments can be classified into five broad categories for valuation purposes:
|
|
·
|
Equity-related securities;
|
|
|
·
|
Long-term fixed-income securities;
|
|
|
·
|
Short-term fixed-income securities;
|
|
|
·
|
Investments in intellectual property, patents, research and development in technology or product development; and
|
The Company applies the methods for determining fair value discussed above to the valuation of investments in each of these five broad categories as follows:
|
|
A.
|
EQUITY-RELATED SECURITIES
|
Equity-related securities, including warrants, are fair valued using the market or income approaches. The following factors may be considered when the market approach is used to fair value these types of securities:
|
|
§
|
Readily available public market quotations;
|
|
|
§
|
The cost of the Company’s investment;
|
|
|
§
|
Transactions in a company's securities or unconditional firm offers by responsible parties as a factor in determining valuation;
|
|
|
§
|
The financial condition and operating results of the company;
|
|
|
§
|
The company's progress towards milestones.
|
|
|
§
|
The long-term potential of the business and technology of the company;
|
|
|
§
|
The values of similar securities issued by companies in similar businesses;
|
|
|
§
|
Multiples to revenue, net income or EBITDA that similar securities issued by companies in similar businesses receive;
|
|
|
§
|
The proportion of the company's securities we own and the nature of any rights to require the company to register restricted securities under applicable securities laws; and
|
|
|
§
|
The rights and preferences of the class of securities we own as compared with other classes of securities the portfolio company has issued.
|
When the income approach is used to value warrants, the Company uses the Black-Scholes-Merton formula.
|
|
B.
|
LONG-TERM FIXED-INCOME SECURITIES
|
|
|
1.
|
Readily Marketable: Long-term fixed-income securities for which market quotations are readily available are valued using the most recent bid quotations when available.
|
|
|
2.
|
Not Readily Marketable: Long-term fixed-income securities for which market quotations are not readily available are fair valued using the income approach. The factors that may be considered when valuing these types of securities by the income approach include:
|
|
|
·
|
Interest rate analysis;
|
|
|
·
|
Quotations from broker-dealers;
|
|
|
·
|
Prices from independent pricing services that the Board believes are reasonably reliable; and
|
|
|
·
|
Reasonable price discovery procedures and data from other sources.
|
|
|
C.
|
SHORT-TERM FIXED-INCOME SECURITIES
|
Short-term fixed-income securities are valued using the market approach in the same manner as long-term fixed-income securities until the remaining maturity is 60 days or less, after which time such securities may be valued at amortized cost if there is no concern over payment at maturity.
|
|
D.
|
INVESTMENTS IN INTELLECTUAL PROPERTY, PATENTS, RESEARCH AND DEVELOPMENT IN TECHNOLOGY OR PRODUCT DEVELOPMENT
|
Such investments are fair valued using the market approach. The Company may consider factors specific to these types of investments when using the market approach including:
|
|
·
|
The cost of the Company’s investment;
|
|
|
·
|
Investments in the same or substantially similar intellectual property or patents or research and development in technology or product development or offers by responsible third parties;
|
|
|
·
|
The results of research and development;
|
|
|
·
|
Product development and milestone progress;
|
|
|
·
|
Other subjective factors.
|
All other securities are reported at fair value as determined in good faith by the Valuation Committee using the approaches for determining valuation as described above.
For all other securities, the reported values shall reflect the Valuation Committee's judgment of fair values as of the valuation date using the outlined basic approaches of valuation discussed in Section III. They do not necessarily represent an amount of money that would be realized if we had to sell such assets in an immediate liquidation. Thus, valuations as of any particular date are not necessarily indicative of amounts that we may ultimately realize as a result of future sales or other dispositions of investments we hold.
|
NOTES TO CONSOLIDATED FINANCIAL STATEMENTS
(Unaudited)
|
NOTE 1. THE COMPANY
Harris & Harris Group, Inc. (the "Company," "us," "our" and "we"), is a venture capital company operating as a business development company ("BDC") under the Investment Company Act of 1940 (the "1940 Act") that specializes in making investments in companies commercializing and integrating products enabled by nanotechnology and microsystems. We operate as an internally managed company whereby our officers and employees, under the general supervision of our Board of Directors, conduct our operations.
Harris & Harris Enterprises, Inc.SM, ("Enterprises") is a 100 percent wholly owned subsidiary of the Company. Enterprises is taxed under Subchapter C of the Code (a "C Corporation"). Harris Partners I, L.P, is a limited partnership and, from time to time, may be used to hold certain interests in portfolio companies. The partners of Harris Partners I, L.P., are Enterprises (sole general partner) and the Company (sole limited partner). Enterprises pays taxes on any non-passive investment income generated by Harris Partners I, L.P. For the period ended March 31, 2011, there was no non-passive investment income generated by Harris Partners I, L.P. Enterprises, as the sole general partner, consolidates Harris Partners I, L.P. The Company consolidates its wholly owned subsidiary, Enterprises, for financial reporting purposes.
NOTE 2. INTERIM FINANCIAL STATEMENTS
Our interim financial statements have been prepared in accordance with the instructions to Form 10-Q and Article 10 of Regulation S-X and in conformity with accounting principles generally accepted in the United States of America ("GAAP") applicable to interim financial information. Accordingly, they do not include all information and disclosures necessary for a fair presentation of our financial position, results of operations and cash flows in conformity with GAAP. In the opinion of management, these financial statements reflect all adjustments, consisting of valuation adjustments and normal recurring accruals, necessary for a fair presentation of our financial position, results of operations and cash flows for such periods. The results of operations for any interim period are not necessarily indicative of the results for the full year. These financial statements should be read in conjunction with the financial statements and notes thereto contained in our Annual Report on Form 10-K for the fiscal year ended December 31, 2010.
NOTE 3. SUMMARY OF SIGNIFICANT ACCOUNTING POLICIES
The following is a summary of significant accounting policies followed in the preparation of the consolidated financial statements:
Principles of Consolidation. The consolidated financial statements have been prepared in accordance with GAAP and include the accounts of the Company and its wholly owned subsidiary. In accordance with GAAP and Regulation S-X, the Company may only consolidate its interests in investment company subsidiaries and controlled operating companies whose business consists of providing services to the Company. Our wholly owned subsidiary, Enterprises, is a controlled operating company which provides services to us and is, therefore, consolidated. All significant inter-company accounts and transactions have been eliminated in consolidation. Certain prior period amounts have been reclassified to conform to the current period presentation.
Use of Estimates. The preparation of the consolidated financial statements in conformity with GAAP requires management to make estimates and assumptions that affect the reported amounts of assets and liabilities and contingent assets and liabilities and the reported amounts of revenues and expenses. Actual results could differ from these estimates, and the differences could be material. The most significant estimates relate to the fair valuations of our investments.
Portfolio Investment Valuations. Investments are stated at "value" as defined in the 1940 Act and in the applicable regulations of the Securities and Exchange Commission ("SEC") and in accordance with GAAP. Value, as defined in Section 2(a)(41) of the 1940 Act, is (i) the market price for those securities for which a market quotation is readily available and (ii) the fair value as determined in good faith by, or under the direction of, the Board of Directors for all other assets. (See "Valuation Procedures" in the "Footnote to Consolidated Schedule of Investments.") At March 31, 2011, our financial statements include venture capital investments valued at $97,758,989. The fair values of our venture capital investments were determined in good faith by, or under the direction of, the Board of Directors. Upon sale of investments, the values that are ultimately realized may be different from what is presently estimated. The difference could be material.
Cash. Cash includes demand deposits. Cash is carried at cost which approximates fair value.
Restricted Funds. At March 31, 2011, and December 31, 2010, we held $1,252,752 and $2,751, respectively, in "Restricted funds." At March 31, 2011, we held $1,250,000 in a collateral account for our credit facility discussed in "Note 5. Debt." At March 31, 2011, and December 31, 2010, we also held $2,752 and $2,751, respectively, in security deposits for sublessors.
Milestone Payments from Sale of Investment. At March 31, 2011, the outstanding milestone payments from Amgen, Inc.’s acquisition of Biovex Group, Inc., were valued at $3,291,750. The milestone payments are valued using the present value of estimated proceeds from future payments that may be achieved. If all remaining milestones are met, we would receive $9,526,392. There can be no assurances as to how much of this amount we will ultimately realize or when it will be realized, if at all.
Funds Held in Escrow from Sale of Investment. Funds held in escrow from Amgen, Inc.'s acquisition of BioVex Group, Inc., are valued using certain discounts applied to amounts withheld. Funds held in escrow will be released in March 2012 upon settlement of any indemnity claims and expenses related to the transaction. We would receive $958,296 if the funds held in escrow are released in full.
Prepaid Expenses. We include prepaid insurance premiums and deferred financing charges in "Prepaid expenses." Prepaid insurance premiums are recognized over the term of the insurance contract. Deferred financing charges consist of fees and expenses paid in connection with the closing of credit facilities and are capitalized at the time of payment. Deferred financing charges are amortized over the term of the credit facility discussed in "Note 5. Debt." Amortization of the financing charges is included in "Interest and other debt expenses" in the "Consolidated Statements of Operations."
Property and Equipment. Property and equipment are included in "Other assets" and are carried at $351,638 and $364,202 at March 31, 2011, and December 31, 2010, respectively, representing cost, less accumulated depreciation. Depreciation is provided using the straight-line method over the estimated useful lives of the premises and equipment. We estimate the useful lives to be five to ten years for furniture and fixtures, three years for computer equipment, and ten years for leasehold improvements.
Post Retirement Plan Liabilities. Unrecognized actuarial gains and losses are recognized as net periodic benefit cost pursuant to the Company's historical accounting policy for amortizing such amounts. Actuarial gains and losses that arise that are not recognized as net periodic benefit cost in the same periods will be recognized as a component of net assets.
Interest Income Recognition. Interest income, adjusted for amortization of premium and accretion of discount, is recorded on an accrual basis. When securities are determined to be non-income producing, the Company ceases accruing interest and writes off any previously accrued interest. These write-offs are recorded as a debit to interest income. During the three months ended March 31, 2011, the Company earned $39,210 in interest on U.S. government securities, senior secured debt, participation agreements and interest-bearing accounts. During the three months ended March 31, 2011, the Company recorded $82,567 of bridge note interest.
Loan Fees. Loan fees received in connection with our venture debt investments are capitalized. The unearned fee income is accreted into income based on the effective interest method over the life of the investment.
Stock-Based Compensation. The Company has a stock-based employee compensation plan. The Company accounts for the Harris & Harris Group, Inc. 2006 Equity Incentive Plan (the "Stock Plan") by determining the fair value of all share-based payments to employees, including the fair value of grants of employee stock options, and records these amounts as an expense in the Consolidated Statements of Operations over the vesting period with a corresponding increase to our additional paid-in capital. At March 31, 2011, and December 31, 2010, the increase to our operating expenses was offset by the increase to our additional paid-in capital, resulting in no net impact to our net asset value. Additionally, the Company does not record the tax benefits associated with the expensing of stock options because the Company currently intends to qualify as a regulated investment company ("RIC") under Subchapter M of the Internal Revenue Code of 1986 (the "Code"). The amount of non-cash, stock-based compensation expense recognized in the Consolidated Statements of Operations is based on the fair value of the awards the Company expects to vest, recognized over the vesting period on a straight-line basis for each award, and adjusted for actual options vested and pre-vesting forfeitures. The forfeiture rate is estimated at the time of grant and revised, if necessary, in subsequent periods if the actual forfeiture rate differs from the estimated rate and is accounted for in the current period and prospectively. See "Note 7. Stock-Based Compensation" for further discussion.
Rent expense. Our lease at 1450 Broadway, New York, New York, commenced on January 21, 2010. The lease expires on December 31, 2019. The base rent is $36 per square foot with a 2.5 percent increase per year over the 10 years of the lease, subject to a full abatement of rent for four months and a rent credit for six months throughout the lease term. Certain leasehold improvements were also paid for on our behalf by the landlord, the cost of which is accounted for as property and equipment and "Deferred rent" in the accompanying Consolidated Statements of Assets and Liabilities. These leasehold improvements are depreciated over the lease term. We apply these rent abatements, credits, escalations and landlord payments on a straight-line basis in the determination of rent expense over the lease term.
Realized Gain or Loss and Unrealized Appreciation or Depreciation of Portfolio Investments. Realized gain or loss is recognized when an investment is disposed of and is computed as the difference between the Company's cost basis in the investment at the disposition date and the net proceeds received from such disposition. Realized gains and losses on investment transactions are determined by specific identification. Unrealized appreciation or depreciation is computed as the difference between the fair value of the investment and the cost basis of such investment.
Income Taxes. As we intend to qualify as a RIC under Subchapter M of the Code, the Company does not provide for income taxes. The Company recognizes interest and penalties in income tax expense.
We pay federal, state and local income taxes on behalf of our wholly owned subsidiary, Harris & Harris Enterprises, Inc., which is a C corporation. See "Note 8. Income Taxes."
Foreign Currency Translation. The accounting records of the Company are maintained in U.S. dollars. All assets and liabilities denominated in foreign currencies are translated into U.S. dollars based on the rate of exchange of such currencies against U.S. dollars on the date of valuation. For the three months ended March 31, 2011, included in the net decrease in unrealized appreciation on investments was an unrealized gain of $116,263 resulting from foreign currency translation.
Securities Transactions. Securities transactions are accounted for on the date the transaction for the purchase or sale of the securities is entered into by the Company (i.e., trade date).
Concentration of Credit Risk. The Company places its cash and cash equivalents with financial institutions and, at times, cash held in checking accounts may exceed the Federal Deposit Insurance Corporation insured limit.
NOTE 4. BUSINESS RISKS AND UNCERTAINTIES
We have invested a substantial portion of our assets in privately held companies, the securities of which are inherently illiquid. We also seek to invest in small publicly traded companies that we believe have exceptional growth potential. Although these companies are publicly traded, their stock may not trade at high volumes and prices can be volatile, which may restrict our ability to sell our positions. These privately held and publicly traded businesses tend to lack management depth, to have limited or no history of operations and to not have attained profitability. Because of the speculative nature of our investments and the lack of a public market for privately held investments, there is greater risk of loss than is the case with traditional investment securities.
We do not choose investments based on a strategy of diversification. We also do not rebalance the portfolio should one of our portfolio companies increase in value substantially relative to the rest of the portfolio. Therefore, the value of our portfolio may be more vulnerable to events affecting a single sector, industry or portfolio company and, therefore, subject to greater volatility than a company that follows a diversification strategy. As of March 31, 2011, our largest ten investments by value accounted for approximately 74 percent of the value of our equity-focused venture capital portfolio. Our largest investment, by value, accounted for approximately 24 percent of our equity-focused venture capital portfolio at March 31, 2011.
Because there is typically no public or readily ascertainable market for our interests in the small privately held companies in which we invest, the valuation of the securities in that portion of our portfolio is determined in good faith by our Valuation Committee, comprised of all of the independent members of our Board of Directors, in accordance with our Valuation Procedures and is subject to significant estimates and judgments. The determined value of the securities in our portfolio may differ significantly from the values that would be placed on these securities if a ready market for the securities existed. Any changes in valuation are recorded in our Consolidated Statements of Operations as "Net (decrease) increase in unrealized appreciation on investments." Changes in valuation of any of our investments in privately held companies from one period to another may be volatile.
NOTE 5. DEBT
On February 24, 2011, the Company established a new $10 million three-year revolving credit facility (the “credit facility”) with TD Bank, N.A. to be used in conjunction with its investments in venture debt.
The credit facility, among other things, matures on February 24, 2014, and generally bears interest, at the Company’s option, based on (i) LIBOR plus 1.25 percent or (2) the higher of the federal funds rate plus fifty basis points (0.50 percent) or the U.S. prime rate as published in the Wall Street Journal. The credit facility generally requires payment of interest on a monthly basis and requires the payment of a non-use fee of 0.15 percent annually. All outstanding principal is due upon maturity. The credit facility is secured by cash collateral to be held in a non-interest bearing account at TD Bank. The credit facility contains affirmative and restrictive covenants, including: (a) periodic financial reporting requirements, (b) maintaining our status as a BDC (c) maintaining unencumbered, liquid assets of not less than $7,500,000, (d) limitations on the incurrence of additional indebtedness, (e) limitations on liens, and (f) limitations on mergers and dissolutions. The credit facility is used to supplement our capital to make additional venture debt investments.
The Company’s outstanding debt balance was $1,250,000 and $0, at March 31, 2011, and December 31, 2010, respectively. The annual interest cost for the three months ended March 31, 2011, was 1.5345 percent, exclusive of closing fees and for other prepaid expenses related to establishing the credit facility. The remaining capacity under the credit facility was $8,750,000 at March 31, 2011. At March 31, 2011, the Company was in compliance with all financial covenants required by the credit facility.
NOTE 6. INVESTMENTS
At March 31, 2011, our financial assets were categorized as follows in the fair value hierarchy:
| |
|
|
|
|
Fair Value Measurement at Reporting Date Using:
|
|
| |
|
|
|
|
|
|
|
|
|
|
|
|
| |
|
|
|
|
Unadjusted Quoted
|
|
|
|
|
|
|
|
| |
|
|
|
|
Prices in Active Markets
|
|
|
Significant Other
|
|
|
Significant
|
|
| |
|
|
|
|
for Identical Assets
|
|
|
Observable Inputs
|
|
|
Unobservable Inputs
|
|
|
Description
|
|
March 31, 2011
|
|
|
(Level 1)
|
|
|
(Level 2)
|
|
|
(Level 3)
|
|
| |
|
|
|
|
|
|
|
|
|
|
|
|
|
U.S. Government Securities
|
|
$ |
39,196,328 |
|
|
$ |
39,196,328 |
|
|
$ |
0 |
|
|
$ |
0 |
|
| |
|
|
|
|
|
|
|
|
|
|
|
|
|
|
|
|
|
Privately Held Portfolio Companies:
|
|
|
|
|
|
|
|
|
|
|
|
|
|
|
|
|
|
Preferred Stock
|
|
$ |
86,112,916 |
|
|
$ |
0 |
|
|
$ |
0 |
|
|
$ |
86,112,916 |
|
|
Bridge Notes
|
|
$ |
4,815,774 |
|
|
$ |
0 |
|
|
$ |
0 |
|
|
$ |
4,815,774 |
|
|
Warrants
|
|
$ |
655,692 |
|
|
$ |
0 |
|
|
$ |
0 |
|
|
$ |
655,692 |
|
|
Common Stock
|
|
$ |
436,642 |
|
|
$ |
0 |
|
|
$ |
0 |
|
|
$ |
436,642 |
|
|
Senior Secured Debt
|
|
$ |
662,532 |
|
|
$ |
0 |
|
|
$ |
0 |
|
|
$ |
662,532 |
|
|
Participation Agreement
|
|
$ |
483,100 |
|
|
$ |
0 |
|
|
$ |
0 |
|
|
$ |
483,100 |
|
|
Subordinated Secured Debt
|
|
$ |
144,490 |
|
|
$ |
0 |
|
|
$ |
0 |
|
|
$ |
144,490 |
|
| |
|
|
|
|
|
|
|
|
|
|
|
|
|
|
|
|
|
Publicly Traded Portfolio
|
|
|
|
|
|
|
|
|
|
|
|
|
|
|
|
|
|
Companies
|
|
|
|
|
|
|
|
|
|
|
|
|
|
|
|
|
|
Common Stock(a)
|
|
$ |
4,447,843 |
|
|
$ |
0 |
|
|
$ |
0 |
|
|
$ |
4,447,843 |
|
| |
|
|
|
|
|
|
|
|
|
|
|
|
|
|
|
|
|
Total
|
|
$ |
136,955,317 |
|
|
$ |
39,196,328 |
|
|
$ |
0 |
|
|
$ |
97,758,989 |
|
(a) Valued at a discount to quoted market prices to reflect a lock-up restriction.
The following chart shows the components of change in the financial assets categorized as Level 3 for the three months ended March 31, 2011.
| |
|
Beginning
Balance
1/1/2011
|
|
|
Total
Realized
Gains
Included in
Changes in
Net Assets
|
|
|
Transfers
Between
Asset Classes
|
|
|
Total
Unrealized
Gains
(Losses)
Included in
Changes in
Net Assets
|
|
|
Investments
in Portfolio
Companies,
Interest on
Bridge Notes,
and
Amortization
of Loan Fees,
Net
|
|
|
Disposals
|
|
|
Ending
Balance
3/31/2011
|
|
|
Amount of Total Gains
for the Period Included
in Changes in Net Assets
Attributable to the
Change in Unrealized
Gains or Losses Relating
to Assets Still Held at
the Reporting Date
|
|
| |
|
|
|
|
|
|
|
|
|
|
|
|
|
|
|
|
|
|
|
|
|
|
|
|
|
Preferred Stock
|
|
$ |
100,451,746 |
|
|
$ |
7,363,883 |
|
|
$ |
(3,770,346 |
) |
|
$ |
(6,432,780 |
) |
|
$ |
0 |
|
|
$ |
(11,499,588 |
) |
|
$ |
86,112,915 |
|
|
$ |
3,658,120 |
|
| |
|
|
|
|
|
|
|
|
|
|
|
|
|
|
|
|
|
|
|
|
|
|
|
|
|
|
|
|
|
|
|
|
|
Bridge Notes
|
|
|
3,565,062 |
|
|
|
0 |
|
|
|
0 |
|
|
|
119,167 |
|
|
|
1,131,546 |
|
|
|
0 |
|
|
|
4,815,775 |
|
|
|
119,167 |
|
| |
|
|
|
|
|
|
|
|
|
|
|
|
|
|
|
|
|
|
|
|
|
|
|
|
|
|
|
|
|
|
|
|
|
Common Stock
|
|
|
977,414 |
|
|
|
0 |
|
|
|
(479,269 |
) |
|
|
(61,503 |
) |
|
|
0 |
|
|
|
0 |
|
|
|
436,642 |
|
|
|
(313,545 |
) |
| |
|
|
|
|
|
|
|
|
|
|
|
|
|
|
|
|
|
|
|
|
|
|
|
|
|
|
|
|
|
|
|
|
|
Warrants
|
|
|
684,780 |
|
|
|
128,732 |
|
|
|
0 |
|
|
|
(112,789 |
) |
|
|
114,443 |
|
|
|
(159,474 |
) |
|
|
655,692 |
|
|
|
15,943 |
|
| |
|
|
|
|
|
|
|
|
|
|
|
|
|
|
|
|
|
|
|
|
|
|
|
|
|
|
|
|
|
|
|
|
|
Participation Agreement
|
|
|
471,420 |
|
|
|
0 |
|
|
|
0 |
|
|
|
8,587 |
|
|
|
3,093 |
|
|
|
0 |
|
|
|
483,100 |
|
|
|
8,587 |
|
| |
|
|
|
|
|
|
|
|
|
|
|
|
|
|
|
|
|
|
|
|
|
|
|
|
|
|
|
|
|
|
|
|
|
Subordinated Secured Debt
|
|
|
0 |
|
|
|
0 |
|
|
|
0 |
|
|
|
7,115 |
|
|
|
137,375 |
|
|
|
0 |
|
|
|
144,490 |
|
|
|
7,115 |
|
| |
|
|
|
|
|
|
|
|
|
|
|
|
|
|
|
|
|
|
|
|
|
|
|
|
|
|
|
|
|
|
|
|
|
Senior Secured Debt
|
|
|
0 |
|
|
|
0 |
|
|
|
0 |
|
|
|
2,576 |
|
|
|
659,956 |
|
|
|
0 |
|
|
|
662,532 |
|
|
|
2,576 |
|
| |
|
|
|
|
|
|
|
|
|
|
|
|
|
|
|
|
|
|
|
|
|
|
|
|
|
|
|
|
|
|
|
|
|
Publicly Traded Common Stock
|
|
|
0 |
|
|
|
0 |
|
|
|
4,249,615 |
|
|
|
(351,772 |
) |
|
|
550,000 |
|
|
|
0 |
|
|
|
4,447,843 |
|
|
|
(2,851,747 |
) |
| |
|
|
|
|
|
|
|
|
|
|
|
|
|
|
|
|
|
|
|
|
|
|
|
|
|
|
|
|
|
|
|
|
|
Total
|
|
$ |
106,150,422 |
|
|
$ |
7,492,615 |
|
|
$ |
0 |
|
|
$ |
(6,821,399 |
) |
|
$ |
2,596,413 |
|
|
$ |
(11,659,062 |
) |
|
$ |
97,758,989 |
|
|
$ |
646,216 |
|
At December 31, 2010, our financial assets were categorized as follows in the fair value hierarchy:
| |
|
|
|
|
Fair Value Measurement at Reporting Date Using:
|
|
| |
|
|
|
|
|
|
|
|
|
|
|
|
|
Description
|
|
December 31, 2010
|
|
|
Quoted Prices in Active
Markets for Identical
Assets (Level 1)
|
|
|
Significant Other
Observable Inputs
(Level 2)
|
|
|
Significant
Unobservable Inputs
(Level 3)
|
|
| |
|
|
|
|
|
|
|
|
|
|
|
|
|
U.S. Government Securities
|
|
$ |
38,274,617 |
|
|
$ |
38,274,617 |
|
|
$ |
0 |
|
|
$ |
0 |
|
| |
|
|
|
|
|
|
|
|
|
|
|
|
|
|
|
|
|
Privately Held Portfolio Companies:
|
|
|
|
|
|
|
|
|
|
|
|
|
|
|
|
|
|
Preferred Stock
|
|
$ |
100,451,746 |
|
|
$ |
0 |
|
|
$ |
0 |
|
|
$ |
100, 451,746 |
|
|
Bridge Notes
|
|
$ |
3,565,062 |
|
|
$ |
0 |
|
|
$ |
0 |
|
|
$ |
3,565,062 |
|
|
Common Stock
|
|
$ |
977,414 |
|
|
$ |
0 |
|
|
$ |
0 |
|
|
$ |
977,414 |
|
|
Warrants
|
|
$ |
684,780 |
|
|
$ |
0 |
|
|
$ |
0 |
|
|
$ |
684,780 |
|
|
Participation Agreement
|
|
$ |
471,420 |
|
|
$ |
0 |
|
|
$ |
0 |
|
|
$ |
471,420 |
|
| |
|
|
|
|
|
|
|
|
|
|
|
|
|
|
|
|
|
Total
|
|
$ |
144,425,039 |
|
|
$ |
38,274,617 |
|
|
$ |
0 |
|
|
$ |
106,150,422 |
|
The following chart shows the components of change in the financial assets categorized as Level 3 for the twelve months ended December 31, 2010.
| |
|
Beginning
Balance
1/1/2010
|
|
|
Total
Realized
Losses
Included in
Changes in
Net Assets
|
|
|
Total
Unrealized
Gains
(Losses)
Included in
Changes in
Net Assets
|
|
|
Investments
in Private
Placements
and Interest
on Bridge
Notes, Net
|
|
|
Disposals
|
|
|
Ending Balance
12/31/2010
|
|
|
Amount of Total
Gains for the Period
Included in Changes
in Net Assets
Attributable to the
Change in Unrealized
Gains or Losses
Relating to Assets
Still Held at the
Reporting Date
|
|
|
Preferred Stock
|
|
$ |
73,134,661 |
|
|
$ |
(3,136,552 |
) |
|
$ |
21,786,178 |
|
|
$ |
8,667,459 |
|
|
$ |
0 |
|
|
$ |
100,451,746 |
|
|
$ |
18,649,627 |
|
| |
|
|
|
|
|
|
|
|
|
|
|
|
|
|
|
|
|
|
|
|
|
|
|
|
|
|
|
|
|
Bridge Notes
|
|
|
2,718,225 |
|
|
|
0 |
|
|
|
0 |
|
|
|
846,837 |
|
|
|
0 |
|
|
|
3,565,062 |
|
|
|
0 |
|
| |
|
|
|
|
|
|
|
|
|
|
|
|
|
|
|
|
|
|
|
|
|
|
|
|
|
|
|
|
|
Common Stock
|
|
|
1,164,599 |
|
|
|
0 |
|
|
|
(196,063 |
) |
|
|
8,878 |
|
|
|
0 |
|
|
|
977,414 |
|
|
|
(196,063 |
) |
| |
|
|
|
|
|
|
|
|
|
|
|
|
|
|
|
|
|
|
|
|
|
|
|
|
|
|
|
|
|
Warrants
|
|
|
779,601 |
|
|
|
(447,909 |
) |
|
|
218,746 |
|
|
|
134,342 |
|
|
|
0 |
|
|
|
684,780 |
|
|
|
218,746 |
|
| |
|
|
|
|
|
|
|
|
|
|
|
|
|
|
|
|
|
|
|
|
|
|
|
|
|
|
|
|
|
Participation Agreement
|
|
|
0 |
|
|
|
0 |
|
|
|
(11,830 |
) |
|
|
483,250 |
|
|
|
0 |
|
|
|
471,420 |
|
|
|
(11,830 |
) |
| |
|
|
|
|
|
|
|
|
|
|
|
|
|
|
|
|
|
|
|
|
|
|
|
|
|
|
|
|
|
Total
|
|
$ |
77,797,086 |
|
|
$ |
(3,584,461 |
) |
|
$ |
21,797,031 |
|
|
$ |
10,140,766 |
|
|
$ |
0 |
|
|
$ |
106,150,422 |
|
|
$ |
18,660,480 |
|
NOTE 7. STOCK-BASED COMPENSATION
For the three months ended March 31, 2011, the Company recognized $427,314 of compensation expense in the Consolidated Statements of Operations. As of March 31, 2011, there was approximately $3,271,031 of unrecognized compensation cost related to unvested stock option awards. This cost is expected to be recognized over a weighted average period of approximately 1.3 years. For the three months ended March 31, 2010, the Company recognized $553,272 of compensation expense in the Consolidated Statements of Operations. As of March 31, 2010, there was approximately $5,851,589 of unrecognized compensation cost related to unvested stock option awards.
For the three months ended March 31, 2011, a total of 119,437 options were exercised for total proceeds to the Company of $477,678. For the three months ended March 31, 2010, a total of 2,653 options were exercised for total proceeds to the Company of $9,949.
A summary of the changes in outstanding stock options for the three months ended March 31, 2011, is as follows:
| |
|
|
|
|
|
|
|
|
|
|
Weighted |
|
|
|
|
| |
|
|
|
|
Weighted
|
|
|
Weighted |
|
|
Average
|
|
|
|
|
| |
|
|
|
|
Average
|
|
|
Average
|
|
|
Remaining
|
|
|
Aggregate
|
|
| |
|
|
|
|
|
|
|
Grant Date
|
|
|
Contractual
|
|
|
Intrinsic
|
|
| |
|
Shares
|
|
|
Price |
|
|
Fair Value
|
|
|
Term (Yrs)
|
|
|
Value
|
|
| |
|
|
|
|
|
|
|
|
|
|
|
|
|
|
|
|
Options Outstanding at January 1, 2011
|
|
|
3,860,748 |
|
|
$ |
7.81 |
|
|
$ |
4.76 |
|
|
|
5.60 |
|
|
$ |
125,208 |
|
| |
|
|
|
|
|
|
|
|
|
|
|
|
|
|
|
|
|
|
|
|
|
Granted
|
|
|
0 |
|
|
$ |
0 |
|
|
$ |
0 |
|
|
|
0 |
|
|
|
|
|
| |
|
|
|
|
|
|
|
|
|
|
|
|
|
|
|
|
|
|
|
|
|
Exercised
|
|
|
(119,437 |
) |
|
$ |
4.00 |
|
|
$ |
1.66 |
|
|
|
0 |
|
|
|
|
|
| |
|
|
|
|
|
|
|
|
|
|
|
|
|
|
|
|
|
|
|
|
|
Forfeited or Expired
|
|
|
(232,719 |
) |
|
$ |
6.74 |
|
|
$ |
3.64 |
|
|
|
0 |
|
|
|
|
|
| |
|
|
|
|
|
|
|
|
|
|
|
|
|
|
|
|
|
|
|
|
|
Options Outstanding at March 31, 2011
|
|
|
3,508,592 |
|
|
$ |
8.01 |
|
|
$ |
4.94 |
|
|
|
5.52 |
|
|
$ |
538,898 |
|
| |
|
|
|
|
|
|
|
|
|
|
|
|
|
|
|
|
|
|
|
|
|
Options Exercisable at March 31, 2011
|
|
|
2,385,158 |
|
|
$ |
8.48 |
|
|
$ |
5.27 |
|
|
|
5.52 |
|
|
$ |
278,567 |
|
| |
|
|
|
|
|
|
|
|
|
|
|
|
|
|
|
|
|
|
|
|
|
Options Exercisable and Expected to be Exercisable
at March 31, 2011
|
|
|
3,480,093 |
|
|
$ |
7.99 |
|
|
$ |
4.92 |
|
|
|
5.53 |
|
|
$ |
538,898 |
|
The aggregate intrinsic value in the table above with respect to options outstanding, exercisable and expected to be exercisable, is calculated as the difference between the Company's closing stock price of $5.38 on the last trading day of the first quarter of 2011 and the exercise price, multiplied by the number of in-the-money options. This amount represents the total pre-tax intrinsic value that would have been received by the option holders had all options been fully vested and all option holders exercised their awards on March 31, 2011. The intrinsic value on the dates of exercise of 119,437 options exercised during the three months ended March 31, 2011, was $140,816.
On June 2, 2010, the Company announced that its Compensation Committee has cancelled its previously scheduled meetings for the purpose of awarding stock options pursuant to the Stock Plan in 2010, and it will not award stock options for at least one year from the date of the announcement. The Compensation Committee also decided that any future grants of options, if they occur, will not be awarded at a price below our net asset value per share.
NOTE 8. INCOME TAXES
We have elected to be treated as a RIC under Subchapter M of the Internal Revenue Code of 1986, as amended (the "Code") and operate in a manner so as to qualify for the tax treatment applicable to RICs.
In order to qualify as a RIC, we must, in general, (1) annually, derive at least 90 percent of our gross income from dividends, interest, gains from the sale of securities and similar sources; (2) quarterly, meet certain investment diversification requirements; and (3) annually, distribute at least 90 percent of our investment company taxable income as a dividend. We may either distribute or retain our net capital gain from investments, but any net capital gain not distributed will be subject to corporate income tax and the excise tax described below. We will be subject to a four percent excise tax to the extent we fail to distribute at least 98 percent of our annual net ordinary income and 98 percent of our capital gain net income and would be subject to income tax to the extent we fail to distribute 100 percent of our investment company taxable income.
Because of the specialized nature of our investment portfolio, we generally can satisfy the diversification requirements under the Code if we receive a certification from the SEC that we are "principally engaged in the furnishing of capital to other corporations which are principally engaged in the development or exploitation of inventions, technological improvements, new processes, or products not previously generally available."
On May 2, 2011, we filed an application with the SEC requesting certification for 2010, permitting us to qualify for RIC treatment for 2010 (as we had for the years 1999 through 2009) pursuant to Section 851(e) of the Code. Although the SEC certification for 2009 was issued, there can be no assurance that we will qualify for or receive such certification for 2010 or subsequent years (to the extent we need additional certification) or that we will actually qualify for Subchapter M treatment in subsequent years. We qualified for RIC treatment in 2010 even without certification. In addition, under certain circumstances, even if we qualified for Subchapter M treatment in a given year, we might take action in a subsequent year to ensure that we would be taxed in that subsequent year as a C Corporation, rather than as a RIC. Because Subchapter M does not permit deduction of operating expenses against net capital gain, it is not clear that the Company and its shareholders have paid less in taxes since 1999 than they would have paid had the Company remained a C Corporation.
During the first quarter of 2011, and 2010, we paid $2,290 and $2,632, respectively, in federal, state and local taxes. At March 31, 2011, and 2010, we had $0 accrued for federal, state and local taxes payable by the Company.
We pay federal, state and local taxes on behalf of our wholly owned subsidiary, Harris & Harris Enterprises, Inc., which is taxed as a C Corporation. For the three months ended March 31, 2011, and 2010, our income tax expense for Harris & Harris Enterprises, Inc., was $1,385 and $2,527, respectively.
NOTE 9. CHANGE IN NET ASSETS PER SHARE
The following table sets forth the computation of basic and diluted per share net (decreases) increases in net assets resulting from operations for the three months ended March 31, 2011, and March 31, 2010.
| |
|
For the Three Months
Ended March 31
|
|
| |
|
2011
|
|
|
2010
|
|
| |
|
|
|
|
|
|
|
Numerator for (decrease) increase in net assets per share
|
|
$ |
(1,126,159 |
) |
|
$ |
1,687,731 |
|
| |
|
|
|
|
|
|
|
|
|
Denominator for basic weighted average shares
|
|
|
30,918,981 |
|
|
|
30,859,888 |
|
| |
|
|
|
|
|
|
|
|
|
Basic net (decrease) increase in net assets per share resulting from operations
|
|
$ |
(0.04 |
) |
|
$ |
0.05 |
|
| |
|
|
|
|
|
|
|
|
|
Denominator for diluted weighted average shares
|
|
|
30,918,981 |
|
|
|
30,899,721 |
|
| |
|
|
|
|
|
|
|
|
|
Diluted net (decrease) increase in net assets per share resulting
from operations
|
|
$ |
(0.04 |
) |
|
$ |
0.05 |
|
For the three months ended March 31, 2011, the calculation of net increase in net assets resulting from operations per diluted share excludes stock options because such options were anti-dilutive. All stock options may be dilutive in future periods in which there is a net increase in net assets resulting from operations, or in the event that there are significant increases in the average stock price in the stock market or significant decreases in the amount of unrecognized compensation cost.
NOTE 10. CONTINGENCIES
On April 11, 2011, one of our privately held portfolio companies signed a non-binding term sheet to raise additional funding from a third party, independent financial investor at a price per share higher than that of the previous round. The price per share in this term sheet was not an input used by our Valuation Committee to determine this portfolio company's value as of March 31, 2011. The closing date based on communications with the company is tentatively set for May 13, 2011. However, there can be no assurance that this transaction will be consummated. In the event that this transaction is completed, it could be a material input to the determination of the value of our shares of this portfolio company as of June 30, 2011. A valuation calculated based on this input alone could increase the value of this portfolio company as of June 30, 2011, ranging from $0 to approximately $1,750,000, or $0 to approximately $0.06 per share, from the value as of March 31, 2011. In the event that this transaction is completed, the price per share of this financing will be one of many inputs used by our Valuation Committee, which is comprised of all of our independent directors, to set the value of this portfolio company as of June 30, 2011.
NOTE 11. SUBSEQUENT EVENTS
On April 1, 2011, the Company made a $121,560 follow-on investment in Cobalt Technologies, Inc., a privately held, equity-focused portfolio company.
On April 4, 2011, the Company made a $2,000,000 investment in Champions Oncology, Inc., a new publicly traded, equity-focused portfolio company.
On April 12, 2011, the Company made a $298,900 follow-on investment in Mersana Therapeutics, Inc., a privately held, equity-focused portfolio company.
On April 15, 2011, the Company made an $866,668 follow-on investment in a privately held, equity-focused portfolio company.
On April 18, 2011, the Company made a $445,659 follow-on investment in a privately held, equity- focused portfolio company.
On April 19, 2011, the Company made a $650,000 follow-on investment in Enumeral Biomedical Corp., a privately held, equity-focused portfolio company.
On April 26, 2011, the Company made a $63,250 follow-on investment in a privately held, equity- focused portfolio company.
On May 5, 2011, the Board of Directors of Harris & Harris Group, Inc., terminated the Amended and Restated Executive Mandatory Retirement Benefit Plan. The plan was adopted in 2003 in order to begin planning for eventual management succession for individuals who are employed by us in a bona fide executive or high policy-making position. The plan provided benefits required by age discrimination laws as a result of the Company’s policy of mandatory retirement when such individuals attained the age of 65. There are currently two individuals that qualify under the plan: Douglas W. Jamison, age 41, the Chairman and Chief Executive Officer, and Daniel B. Wolfe, age 34, the President. Since Mr. Jamison and Mr. Wolfe have over 20 years prior to attaining the age of 65, the plan was terminated. Our former President accrued benefits under this plan prior to his retirement, and the termination of this plan has no impact on his accrued benefits. At March 31, 2011, we had $214,586 accrued for benefits for this former employee under the plan.
|
HARRIS & HARRIS GROUP, INC.
FINANCIAL HIGHLIGHTS
(Unaudited)
|
| |
|
Three Months Ended March 31
|
|
| |
|
2011
|
|
|
2010
|
|
|
Per Share Operating Performance
|
|
|
|
|
|
|
| |
|
|
|
|
|
|
|
Net asset value per share, beginning of period
|
|
$ |
4.76 |
|
|
$ |
4.35 |
|
| |
|
|
|
|
|
|
|
|
|
Net operating loss*
|
|
|
(0.06 |
) |
|
|
(0.07 |
) |
| |
|
|
|
|
|
|
|
|
|
Net realized gain (loss) on investments*
|
|
|
0.24 |
|
|
|
(0.00 |
) |
| |
|
|
|
|
|
|
|
|
|
Net decrease in unrealized appreciation
|
|
|
|
|
|
|
|
|
|
as a result of sales*
|
|
|
(0.24 |
) |
|
|
(0.00 |
) |
| |
|
|
|
|
|
|
|
|
|
Net increase in unrealized
|
|
|
|
|
|
|
|
|
|
appreciation on investments held*(1)
|
|
|
0.02 |
|
|
|
0.12 |
|
| |
|
|
|
|
|
|
|
|
|
Total from investment operations*
|
|
|
(0.04 |
) |
|
|
0.05 |
|
| |
|
|
|
|
|
|
|
|
|
Net increase as a result of stock-based
|
|
|
|
|
|
|
|
|
|
compensation expense*
|
|
|
0.01 |
|
|
|
0.02 |
|
| |
|
|
|
|
|
|
|
|
|
Net increase as a result of proceeds
|
|
|
|
|
|
|
|
|
|
from exercise of options
|
|
|
0.00 |
|
|
|
0.00 |
|
| |
|
|
|
|
|
|
|
|
|
Total increase from capital stock transactions
|
|
|
0.01 |
|
|
|
0.02 |
|
| |
|
|
|
|
|
|
|
|
|
Net asset value per share, end of period
|
|
$ |
4.73 |
|
|
$ |
4.42 |
|
| |
|
|
|
|
|
|
|
|
|
Stock price per share, end of period
|
|
$ |
5.38 |
|
|
$ |
4.61 |
|
| |
|
|
|
|
|
|
|
|
|
Total return based on stock price
|
|
|
22.83 |
% |
|
|
0.9 |
% |
| |
|
|
|
|
|
|
|
|
|
Supplemental Data:
|
|
|
|
|
|
|
|
|
| |
|
|
|
|
|
|
|
|
|
Net assets, end of period
|
|
$ |
146,632,745 |
|
|
$ |
136,360,282 |
|
| |
|
|
|
|
|
|
|
|
|
Ratio of expenses to average net assets
|
|
|
1.3 |
% |
|
|
1.6 |
% |
| |
|
|
|
|
|
|
|
|
|
Ratio of net operating loss to average net assets
|
|
|
(1.3 |
)% |
|
|
(1.6 |
)% |
| |
|
|
|
|
|
|
|
|
|
Average debt outstanding
|
|
$ |
444,444 |
|
|
$ |
0.00 |
|
| |
|
|
|
|
|
|
|
|
|
Average debt per share
|
|
$ |
0.01 |
|
|
$ |
0.00 |
|
| |
|
|
|
|
|
|
|
|
|
Number of shares outstanding, end of period
|
|
|
30,997,601 |
|
|
|
30,862,246 |
|
* Based on Average Shares Outstanding
(1) Net unrealized gains (losses) includes rounding adjustments to reconcile change in net asset value per share. See "Item 2. Management's Discussion and Analysis of Financial Condition and Results of Operations" for a description of unrealized losses on investments.
The accompanying notes are an integral part of this schedule.
|
Item 2.
|
Management's Discussion and Analysis of Financial Condition and Results of Operations
|
The information contained in this section should be read in conjunction with the Company's unaudited March 31, 2011, Consolidated Financial Statements and the Company's audited 2010 Consolidated Financial Statements and notes thereto.
Background
We incorporated under the laws of the state of New York in August 1981. In 1983, we completed an initial public offering ("IPO"). In 1984, we divested all of our assets except Otisville BioTech, Inc., and became a financial services company with the investment in Otisville as the initial focus of our business activity.
In 1992, we registered as an investment company under the 1940 Act, commencing operations as a closed-end, non-diversified investment company. In 1995, we elected to become a BDC subject to the provisions of Sections 55 through 65 of the 1940 Act.
Overview
We invest in innovation. Innovation is the process by which new technologies are transformed into products or processes which may drive improvements in the quality of life and create wealth. We focus on innovations enabled by nanotechnology and microsystems. These innovations primarily impact the clean technology, healthcare and electronics sectors. We focus on nanotechnology because science is reductionist, and, historically, transformative breakthroughs in the sectors where we focus occur through understanding science and technology at smaller and smaller scales. Currently, these transformative breakthroughs are occurring at the nanoscale and below. We focused the Company on making venture capital investments in companies that commercialize and integrate products enabled by nanotechnology in 2002. We define venture capital investments as the money and resources made available to privately held start-up firms and privately held and publicly traded small businesses with exceptional growth potential. We believe that we are the only publicly traded BDC making venture capital investments exclusively in nanotechnology and microsystems. We believe we have invested in more nanotechnology-enabled companies than any other venture capital firm.
Nanotechnology is the study of structures measured in nanometers, which are units of measurement in billionths of a meter. Microsystems are measured in micrometers, which are units of measurement in millionths of a meter. We sometimes use "tiny technology" to describe both of these disciplines.
We consider a company to fit our investment thesis if the company employs or intends to employ technology that we consider to be at the microscale or smaller and if the employment of that technology is material to its business plan. By making these investments, we seek to provide our shareholders with a specific focus on nanotechnology and microsystems through a portfolio of venture capital investments that address a variety of markets and products.
We believe we provide five core benefits to our shareholders. First, we are an established firm with a track record of investing in venture capital-backed companies. Second, we provide shareholders with access to emerging companies that commercialize and integrate products enabled by nanotechnology and microsystems that are privately and publicly owned. Third, we have an existing portfolio of companies that we believe are comparable in stage to those found in the latter years of a private venture capital fund. Fourth, we are able to invest opportunistically in a range of types of securities to take advantage of market inefficiencies. Fifth, we provide access to venture capital investments in a vehicle that, unlike private venture capital firms, is both transparent and liquid.
We believe nanotechnology can be classified as a foundational or general purpose technology. An innovation qualifies as a foundational technology if it has the potential for pervasive use in a wide range of sectors in ways that change the competitive dynamics in those sectors. Foundational technologies often take decades to fully diffuse through respective sectors. We believe the period of 2001 through 2010 was the first decade in the commercial development of nanotechnology products. According to the National Science Foundation and the National Nanotechnology Initiative, this decade witnessed average growth rates of research and development funding, peer-reviewed publications and patent applications of 23 percent to 35 percent. According to the same institutions, nanotechnology-enabled companies created over 300,000 jobs worldwide and introduced over $200 billion worth of products. Each of these criteria grew at an average annual growth rate of 25 percent from 2000 to 2008. Our portfolio companies experienced similar growth during this period of time with aggregate revenues increasing 24 percent from 2007 to 2010, and 42 percent from 2009 to 2010.
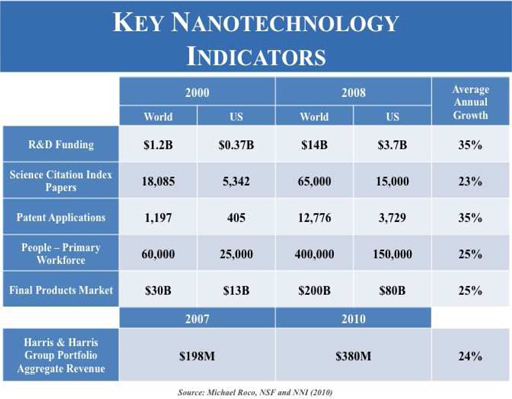
We are currently in the second decade in the commercial development of nanotechnology products. We believe it will be this second decade and beyond where large portions of industry come to rely on nanotechnology as a fundamental enabler for advanced products. We believe that as this occurs, our portfolio companies are well positioned to profit and that we will see investment returns as a result.
Investment Strategy
We have discretion in the investment of our capital. We seek long-term capital appreciation through venture capital investments in equity-focused securities that we believe have exceptional growth potential. These businesses can range in stage from pre-revenue to generating positive cash flow. These businesses tend to be thinly capitalized, unproven, small companies that lack management depth, have little or no history of operations and are developing unproven technologies. These businesses may be privately held or publicly traded. We historically have invested in equity securities of these companies that are generally illiquid due to restrictions on resale and to the lack of an established trading market. We refer to our portfolio of investments in equity and equity-related securities in later sections of the Management's Discussion and Analysis of Financial Condition and Results of Operations ("MD&A") as our "equity-focused" portfolio of investments. We may take advantage of opportunities to generate near-term cash flow by investing in non-convertible debt securities of businesses. These businesses tend to be generating cash or have near-term visibility to reaching positive cash flow. We refer to our portfolio of investments in non-convertible debt in later sections of the MD&A as our "venture debt" portfolio of investments.
We are long-term investors. We seek to identify investment opportunities in industries and markets that will be growth opportunities three to seven years from the date of our initial investment. Our efforts to identify and predict future growth industries and markets relies on patient and deep due diligence in nanotechnology-enabled innovations developed at universities and corporate and government research laboratories and the examination of macroeconomic and microeconomic trends and industry dynamics. We believe it is the early identification of and investments in these growth opportunities that will lead to investment returns for our shareholders, growth of our net assets, and capital for us to invest in tomorrow’s growth opportunities.
Involvement with Portfolio Companies
The 1940 Act requires that BDCs offer to "make available significant managerial assistance" to portfolio companies. We are actively involved with our portfolio companies through membership on boards of directors, as observers to the boards of directors and/or through frequent communication with management. As of March 31, 2011, we held at least a board seat or observer rights on 24 of our 29 equity-focused portfolio companies (83 percent).
We may hold two or more board seats in early-stage portfolio companies or those in which we have significant ownership. As of March 31, 2011, we held two board seats in Ancora Pharmaceuticals Inc. and Enumeral Biomedical Corp. We may transition off of the board of directors to an observer role as our portfolio companies raise additional capital from new investors, as they mature or as they are able to attract independent members who have relevant industry experience and contacts. We also typically step off the board of directors upon the completion of an IPO.
We may be actively involved in the formation and development of business strategies of our earliest stage portfolio companies. This involvement may include hiring management, licensing intellectual property, securing space and raising additional capital. We also provide managerial assistance to late-stage companies looking for potential exit opportunities by leveraging our status as a publicly traded company through our relationships with the banking and investment community and our knowledge and experience implementing and complying with Section 404 of the Sarbanes-Oxley Act.
Historical Investments and Current Investment Pace
Since our investment in Otisville in 1983 through March 31, 2011, we have made a total of 89 equity-focused venture capital investments. We have exited 60 of these 89 investments, realizing total gross proceeds of $79,704,419 on our cumulative invested capital of $156,025,832. These amounts include the receipt of our upfront payment from the sale of BioVex Group, Inc., to Amgen, Inc., in the first quarter of 2011, but do not include the potential milestone payments that could occur as part of this transaction at points in time in the future or payment of the portion of the upfront payment held in escrow as of March 31, 2011, nor do they reflect our ownership of NeoPhotonics Corporation, which completed an IPO on February 2, 2011.
From August 2001 through March 31, 2011, all 47 of our initial equity-focused investments have been in companies commercializing or integrating products enabled by nanotechnology or microsystems. From August 2001 through March 31, 2011, we have invested a total (before any subsequent write-ups, write-downs or dispositions) of $127,945,657 in these companies. We currently have 29 equity-focused companies in our portfolio, including one investment made prior to 2001. At March 31, 2011, from first dollar in, the average and median holding periods for these 29 investments were 5.4 years and 5.0 years, respectively. Historically, as measured from first dollar in to last dollar out, the average and median holding periods for the 60 investments we have exited were 3.9 years and 3.3 years, respectively.
The following is a summary of our initial and follow-on equity-focused investments in nanotechnology companies from January 1, 2007, to March 31, 2011. We consider a "round led" to be a round where we were the new investor or the leader of a set of investors in an investee company. Typically, but not always, the lead investor negotiates the price and terms of the deal with the investee company.
|
Investments in Our Equity-Focused Portfolio of Investments
in Privately Held and Publicly Traded Companies
|
| |
|
2007
|
2008
|
2009
|
2010
|
Three Months
Ended
March 31, 2011
|
| |
|
|
|
|
|
|
|
Total Incremental Investments
|
|
$20,595,161
|
$17,779,462
|
$12,334,051
|
$9,560,721
|
$1,636,174
|
|
No. of New Investments
|
|
7
|
4
|
2
|
3
|
0
|
|
No. of Follow-On Investment Rounds
|
|
20
|
25
|
29
|
27
|
3
|
|
No. of Rounds Led
|
|
3
|
4
|
5
|
5
|
0
|
|
Average Dollar Amount – Initial
|
|
$1,086,441
|
$683,625
|
$174,812
|
$117,069
|
$0
|
|
Average Dollar Amount – Follow-On
|
|
$649,504
|
$601,799
|
$413,256
|
$341,093
|
$545,391
|
During the first quarter of 2011, we made two venture debt investments in one new company and one existing company in our venture debt portfolio. The following is a summary of our investments in venture debt to date.
|
Investments in Our Venture Debt Portfolio of Investments
In Privately Held and Publicly Traded Companies
|
| |
|
2007
|
2008
|
2009
|
2010
|
Three Months
Ended
March 31, 2011
|
|
No. of Investments
|
|
0
|
0
|
0
|
1
|
2
|
|
Total Dollar Amount
|
|
$0
|
$0
|
$0
|
$500,000
|
$900,000
|
Importance of Availability of Liquid Capital
As a publicly traded, internally managed venture capital company, our cash used to make investments and pay expenses is held by us and not called from external sources when needed. We do not use leverage or debt to supplement our cash in investments in equity and convertible debt securities. We may use leverage or debt to help fund our venture debt investments. These non-convertible debt securities have defined periods of time for return on investment. We believe that for these reasons, and for additional reasons discussed in detail in our Annual Report on Form 10-K for the year ended December 31, 2010, it is crucial that we operate the Company with a substantial balance of liquid capital.
Our Sources of Liquid Capital
The sources of liquidity that we use to make our investments are classified as primary and secondary liquidity. We do not include our credit facility as primary or secondary liquidity. Primary liquidity is comprised primarily of cash and U.S. treasury securities. As of March 31, 2011, we held $39,196,328 in U.S. government obligations, and we had an additional $7,054,254 in cash. During the first quarter of 2011, we received the upfront payment of $7.7 million from the acquisition of BioVex Group, Inc. This payment immediately added to our primary liquidity. Payments upon achieving milestones or expiration of the escrow period would also add to our primary liquidity in future quarters if these milestones are achieved successfully. The probability-adjusted value of the future milestone payments, as determined at the end of each fiscal quarter, is included as an asset on our Consolidated Statements of Assets and Liabilities and will be included in primary liquidity only when payment is received for achievement of the milestones.
Our secondary liquidity is comprised of the stock of publicly traded companies. Since selling our position in NeuroMetrix, Inc., in 2005, the amount of secondary liquidity on our balance sheet has been minimal. The IPO of NeoPhotonics Corporation has increased our source of secondary liquidity to approximately $4.4 million based on the closing price of NeoPhotonics Corporation as of March 31, 2011, less a discount to reflect that these shares are subject to lock-up restrictions. Following the expiration of the lock-up restrictions, our shares will be freely tradable at the discretion of management. A decision to sell our shares would result in the cash received from the sale of these assets being included in primary liquidity.
Should additional portfolio companies successfully complete IPOs or should we make investments in publicly traded companies, our source of secondary liquidity could materially increase. We believe these developments make it important, therefore, to examine both our primary and secondary liquidity when assessing the strength of our balance sheet and our future investment capabilities.
Recent and Pending Potential Liquidity Events from Our Portfolio as of March 31, 2011
During the first quarter of 2011, we had two liquidity events in our portfolio. On February 2, 2011, NeoPhotonics Corporation completed an IPO by selling 7,500,000 shares of common stock at $11 per share. We purchased 50,000 shares in this transaction. The common stock of NeoPhotonics Corporation trades on the New York Stock Exchange under the symbol "NPTN." As of March 31, 2011, we owned an aggregate of 450,907 shares of NeoPhotonics Corporation. This position was valued at $4,447,843 as of March 31, 2011. The key inputs to our valuation of NeoPhotonics Corporation were the share price as of the close of trading on March 31, 2011, and a liquidity discount owing to the lock-up restrictions placed on the shares through an agreement with the underwriters of the IPO. As of May 9, 2011, NeoPhotonics Corporation's closing price was $9.61 per share.
On March 4, 2011, Amgen, Inc., completed its acquisition of BioVex Group, Inc. The acquisition included an upfront payment of $425 million and milestone payments of up to $575 million. On March 11, 2011, we received our upfront payment of $7,702,470, which did not include $958,296 held in escrow. As of March 31, 2011, we valued potential milestone payments and funds held in escrow from the sale of BioVex Group, Inc., at $3,769,318. If all the remaining milestone payments were to be paid by Amgen, Inc., and the full amount held in escrow be released, we would receive $10,484,688. There can be no assurances as to how much of this amount we will ultimately realize. At the time of acquisition, BioVex Group, Inc., was in Phase 3 clinical trials for metastatic melanoma and head and neck cancer, and it was expected to complete Phase III of this first trial in the second half of 2011. The company had not generated any revenue at the time of its acquisition.
We also have a number of pending potential liquidity events as of the end of the first quarter. On March 11, 2011, Solazyme, Inc., filed a registration statement on Form S-1 with the Securities and Exchange Commission to pursue an IPO of its shares of common stock. There can be no assurance that this company will successfully complete an IPO, and a variety of factors, including stock market and general business conditions, could lead it to terminate such efforts to complete an IPO. Additionally, one of our Cleantech companies and one of our Electronics companies received offers for acquisition of those companies through non-binding letters of intent. There can be no assurance that these companies will successfully complete a sale, and if the sale is completed, whether the price paid will generate returns for the Company. A variety of factors, including general business conditions and the price offered for the company in the sale, could lead one or more of these companies to terminate such efforts or could lead to the potential acquirers to rescind their non-binding offer to purchase those companies.
Maturity of Current Equity-Focused Venture Capital Portfolio
Our equity-focused venture capital portfolio is comprised of companies at varying maturities facing different types of risks. We have defined these levels of maturity and sources of risk as: 1) Early Stage/Technology Risk, 2) Mid Stage/Market Risk and 3) Late Stage/Execution Risk. We provide detailed descriptions of each of these classifications in our Annual Report on Form 10-K for the year ended December 31, 2010. The charts below show our assessment of the stage of maturity of the 29 companies in our equity-focused portfolio of investments and include the cost and value ascribed to the companies within each of these stages of maturity.
We seek to create a portfolio of companies that enables consistent flows of potential liquidity events in multiple industries in three sectors, cleantech, healthcare and electronics, that can be monetized as these companies mature. We believe a portfolio of companies focused on a diverse set of industries reduces the potential impact of cyclicality of any one industry. Our current portfolio is comprised of companies at varying stages of maturity in a diverse set of industries within three sectors. We also include our positive exits from these portfolios. We consider NanoGram Devices to have been both a Cleantech and Healthcare portfolio company.
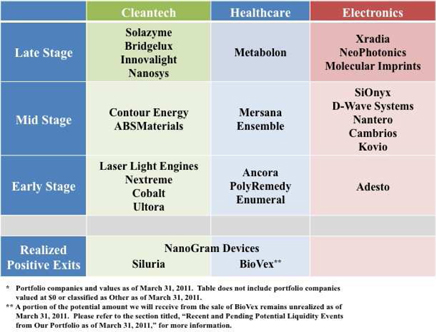
As our portfolio companies mature, we seek to invest in new early and mid-stage companies that may mature into mid and late-stage companies. This continuous progression creates a pipeline of investment maturities that may lead to future sources of positive contributions to net asset value per share as these companies mature and potentially experience liquidity and exit events. This pipeline is demonstrated by the distribution of our current early and mid-stage portfolio companies within each sector.
We expect some of our portfolio companies to transition between stages of maturity over time. This transition may be forward if the company is maturing and is successfully executing its business plan or may be backward if the company is not successfully executing its business plan or decides to change its business plan substantially from its original plan. Transitions backward are commonly accompanied by an increase in non-performance risk, which reduces valuation. We discuss non-performance risk and its implications on value below in the section titled "Valuation of Investments."
During the first quarter of 2011, we did not transition any portfolio companies between classifications of maturity from those classifications as of December 31, 2010. Two companies, BioVex Group, Inc., and Siluria Technologies, Inc., were removed from the classifications and placed in "Realized Positive Exits" owing to the acquisition of BioVex Group, Inc., by Amgen, Inc., and the sale of our shares of Siluria Technologies, Inc., during the first quarter of 2011.
Current Business Environment
During the first quarter of 2011, public markets continued to increase in value, albeit at a reduced pace compared to the previous quarter. Amidst this general improvement in the value of public equities, the momentum of venture-supported exits seen throughout 2010 did not continue into 2011 and the number of new venture capital funds closed during the quarter was the lowest total in any first quarter since 2003. According to Dow Jones LP Source, US-based venture capital firms raised $7.7 billion in capital in the first quarter of 2011, which is well above the $3.87 billion collected in the first quarter of 2010 and is the highest first-quarter total since 2001. This capital, however, was concentrated in the fewest number of firms since any first quarter since 2003. Additionally, in the U.S., early-stage funds collected $3.9 billion for 16 funds, a significant spike from the same period last year when $736 million was raised for 18 funds. However, two funds accounted for all but $500 million of the total dollars raised for the most recent quarter. This trend is in part owing to the closely watched 10-year benchmark for venture capital returns that stood at minus 4.6 percent as of September 30, 2010, which is the most recent data available for this statistic from Cambridge Associates, LLC.
Historically, difficult venture environments have resulted in a higher than normal number of companies not receiving financing and being subsequently closed down with a loss to venture investors, and other companies receiving financing but at significantly lower valuations than the preceding financing rounds. This issue is compounded by the fact that many existing venture capital firms have few remaining years of investment and available capital owing to the finite lifetime of the funds managed by these firms. Additionally, even if a firm was able to raise a new fund, commonly new funds are not permitted to invest new funds in existing investments. This limitation of available capital can lead to fractured syndicates of investors. A fractured syndicate can result in a portfolio company being unable to raise additional capital to fund operations. This issue is especially acute in capital-intensive sectors that are enabled by nanotechnology, such as cleantech, healthcare and electronics. The portfolio company may be forced to sell before reaching its full potential or be shut down entirely if the remaining investors cannot financially support the company. As such, the currently improving exit environment for venture-backed companies through IPOs and merger and acquisition transactions and the currently improving public markets in general may not translate to an increase in the available capital to venture-backed companies, particularly those that have investments from funds that are in the latter stage of life unless the markets continue to improve for some time into the future.
Our overall goal remains unchanged. We want to maintain our leadership position in investing in nanotechnology and microsystems and to increase our net asset value. The current environment for venture capital financings continues to favor those firms that have capital to invest regardless of the stage of the investee company. We continue to finance our new and follow-on equity and convertible debt investments from our cash reserves, currently invested in U.S. Treasury obligations. We believe the turmoil of the venture capital industry and the current economic climate provide opportunities to invest this capital at historically low valuations in equity and convertible debt securities and at high yields in non-convertible debt securities of new and existing privately held and publicly traded companies of varying maturities.
Valuation of Investments
We value our privately held venture capital investments each quarter as determined in good faith by our Valuation Committee, a committee of all the independent directors, within guidelines established by our Board of Directors in accordance with the 1940 Act. (See "Footnote to Consolidated Schedule of Investments" contained in "Consolidated Financial Statements.")
The values of privately held, venture capital-backed companies are inherently more difficult than publicly traded companies to assess at any single point in time because securities of these types of companies are not actively traded. We believe, perhaps even more than in the past, that illiquidity, and the perception of illiquidity, can affect value. Management believes further that the long-term effects of the difficult venture capital market and difficult, but improving, exit environments will continue to affect negatively the fundraising ability of weak companies regardless of near-term improvements in the overall global economy and public markets, and that these factors can also affect value.
In each of the years in the period 2007 through 2010, and for the three months ended March 31, 2011, the Company recorded the following gross write-ups in privately held securities as a percentage of net assets at the beginning of the year ("BOY"), gross write-downs in privately held securities as a percentage of net assets at the beginning of the year, and change in value of privately held portfolio securities as a percentage of net assets at the beginning of the year.
| |
2007
|
2008
|
2009
|
2010
|
Three Months Ended
March 31, 2011
|
| |
|
|
|
|
|
|
Net Asset Value, BOY
|
$113,930,303
|
$138,363,344
|
$109,531,113
|
$134,158,258
|
$146,853,912
|
|
Gross Write-Downs During Year
|
$(7,810,794)
|
$(39,671,588)
|
$(12,845,574)
|
$(11,391,367)
|
$(2,005,296)
|
|
Gross Write-Ups During Year
|
$11,694,618
|
$820,559
|
$21,631,864
|
$30,051,847
|
$3,003,284
|
|
Gross Write-Downs as a Percentage of Net Asset Value, BOY
|
-6.86%
|
-28.67%
|
-11.7%
|
-8.5%
|
(1.4)%
|
|
Gross Write-Ups as a Percentage of Net Asset Value, BOY
|
10.26%
|
0.59%
|
19.7%
|
22.4%
|
2.1%
|
|
Net Change as a Percentage of Net Asset Value, BOY
|
3.40%
|
-28.08%
|
8.0%
|
13.9%
|
0.7%
|
From December 31, 2010, to March 31, 2011, the value of our equity-focused venture capital portfolio decreased by $9,285,003, from $105,679,002 to $96,393,999. This decrease owes primarily to the sale of our share of BioVex Group, Inc., in the acquisition of the company by Amgen, Inc., which contributed $11.4 million to the total net decrease in the value of the portfolio. We received approximately $7.7 million of the $11.4 million in cash in the first quarter of 2011, and we hold approximately $3.7 million, the difference between our value as of December 31, 2010, and the upfront payment we received, as an asset on our Consolidated Statements of Assets and Liabilities. The remaining $204,000, results from the sale of our securities of Siluria Technologies, Inc., during the first quarter of 2011.
The table below indicates some of the inputs used to determine value of our equity-focused portfolio companies and the portion of the change in value, on a quarter over quarter basis, relevant to those inputs. We note that our Valuation Committee and ultimately our Board of Directors take into account multiple sources of quantitative and qualitative inputs to determine the value of our privately held portfolio companies. We also note that our Valuation Committee does not set the value of freely tradable publicly traded portfolio companies. As of March 31, 2011, our shares of our one publicly traded company, NeoPhotonics Corporation, were not freely tradable owing to a lock-up agreement between the underwriters of the IPO and pre-IPO shareholders of the company.
| |
Q4 2010 to Q1
2011
|
Q3 2010 to Q4
2010
|
Q2 2010 to Q3
2010
|
Q1 2010 to Q2
2010
|
|
Value of Equity-Focused Portfolio as of Previous Quarter
|
$105,679,002
|
$96,289,029
|
$92,039,997
|
$83,567,400
|
|
Value of Equity-Focused Portfolio as of Current Quarter
|
$96,393,999
|
$105,679,002
|
$96,289,029
|
$92,039,997
|
|
Examples of Inputs that Contribute to Changes in Value
|
|
Total New and Follow-On Investments
|
$1,636,174
|
$393,650
|
$2,839,907
|
$4,652,106
|
|
(-) Due to Sale of Shares in Portfolio Companies
|
$(11,634,062)
|
$0
|
$0
|
$(552,454)
|
|
(+) Due to Terms of New Equity Rounds of Financing
|
$1,211,345
|
$192,409
|
$1,023,808
|
$11,564,433
|
|
(-) Due to Terms of New Equity Rounds of Financing
|
$(186,199)
|
$0
|
$0
|
$(280,649)
|
|
(+) Due to (+) in Values of Comparables or Indications of Value From Potential Acquirers
|
$1,512,150
|
$13,268,122
|
$1,399,897
|
$730,026
|
|
(-) Due to (-) in Values of Comparables or Indications of Value From Potential Acquirers
|
$(810,254)
|
$(2,495,827)
|
$0
|
$(1,618,341)
|
|
Change in Closing Price on Date of Valuation for Publicly Traded Portfolio Companies
|
$(762,260)
|
$0
|
$0
|
$0
|
|
Net Change in Discount for Lock-Up of Shares of Publicly Traded Companies
|
$410,488
|
$0
|
$0
|
$0
|
|
(+) Due to (-) in Non-Performance Risk
|
$1,572,543
|
$0
|
$53,893
|
$1,355,025
|
|
(-) Due to (+) in Non-Performance Risk
|
$(2,490,595)
|
$(2,257,130)
|
$(1,304,165)
|
$(7,172,178)
|
|
Other Factors(1)
|
$255,667
|
$288,749
|
$235,692
|
$(205,371)
|
|
Total Change in Value of Equity-Focused Portfolio from Quarter to Quarter
|
$(9,285,003)
|
$9,389,973
|
$4,249,032
|
$8,472,597
|
(1) Other factors include changes in accrued bridge note interest, currency fluctuations and the value of warrants.
Net of our position in BioVex Group, Inc., and Siluria Technologies, Inc., the remaining companies in our equity-focused portfolio increased in value from December 31, 2010, to March 31, 2011, by $2,349,059. Of this amount, $1,636,174 was from follow-on investments in our equity-focused portfolio companies. The remaining $712,885 was owing to an increase in unrealized appreciation of $630,317 and accrued bridge note interest of $82,568.
The values of publicly traded comparables on March 31, 2011, and indications of value from potential or confirmed acquirers were significant factors in determining the values of four of our 29 equity-focused portfolio companies. These companies accounted for approximately $36 million of the value of our equity-focused venture capital portfolio as of March 31, 2011. These values could differ materially if calculated on a different date due to changes in values and/or operating performance of the publicly traded comparables or should potential acquisitions of a subset of these companies not be consummated.
The key inputs to the valuation of our investment in NeoPhotonics Corporation were the share price as of March 31, 2011, and a liquidity discount owing to the lock-up restrictions ascribed to our shares under an agreement with the underwriters of the IPO. This liquidity discount of $651,915 was applied to the value of our shares of NeoPhotonics Corporation of $5,099,758 to determine the value of these shares of $4,447,843 as of March 31, 2011.
As part of the valuation process, we consider non-performance risk. Non-performance risk is the risk that a portfolio company will be: (a) unable to raise capital, will need to be shut down and will not return our invested capital; or (b) able to raise capital, but at a valuation significantly lower than the implied post-money valuation. Our best estimate of the non-performance risk of our portfolio companies has been quantified and included in the valuation of the companies as of March 31, 2011. In the future, as these companies receive terms for additional financings or are unable to receive additional financing and, therefore, proceed with sales or shutdowns of the business, we expect the contribution of the discount for non-performance risk to vary in importance in determining the values of our securities of these companies. As of March 31, 2011, non-performance risk was a significant factor in determining the values of nine of our 29 equity-focused portfolio companies. These nine companies accounted for approximately $26.5 million of the total value of our privately held venture capital portfolio. We increased the non-performance risk, thereby decreasing the value, of two companies. We decreased the non-performance risk, thereby increasing the value, of one company. We maintained the same level of non-performance risk in six companies.
As of March 31, 2011, our top ten investments by value accounted for approximately 74 percent of the value of our venture capital portfolio.
Assessment of Venture Capital Investment Portfolio as of March 31, 2011
As a foundational technology, nanotechnology is applicable across a diverse set of sectors, including clean technology, or cleantech, healthcare, and electronics. We have built a portfolio of investments in each of these sectors comprised of companies that address today’s growth markets and what we believe could be tomorrow’s growth opportunities. The value and cost of our equity-focused portfolio is currently distributed among the three sectors as follows:
Note: Our one investment, Questech, which is classified as "Other" and valued at $436,642 as of March 31, 2011, is included with "Electronics."
In the first quarter of 2011, we renamed the sector classification "Electronics/Semiconductors" to "Electronics" and reclassified three companies, NeoPhotonics Corporation, Polatis, Inc., and Xradia, Inc., from a sector classification of "Other" to "Electronics" to reflect a broader definition of electronics to include photonics, metrology, and test and measurement. We also renamed the sector classification "Healthcare/Biotech" to "Healthcare."
The chart below compares the value of our venture capital investments in our Cleantech, Healthcare and Electronics portfolios as of March 31, 2011, and as of December 31, 2010.
Note: Our one investment, Questech, which is classified as "Other" and valued at $436,642 as of March 31, 2011, is included with "Electronics."
We note that the change in the value of our Healthcare portfolio from December 31, 2010, to March 31, 2011, is primarily the result of the sale of BioVex Group, Inc., to Amgen, Inc., in the first quarter of 2011, as is discussed in more detail below.
We have and may continue to make investments outside these sectors, and we may not maintain these sectors or the weightings within these sectors in future quarters.
Assessment of Our Cleantech Portfolio as of March 31, 2011
We classify companies in our Cleantech portfolio as those that seek to improve performance, productivity or efficiency, and to reduce environmental impact, waste, cost, energy consumption or raw materials using nanotechnology-enabled solutions. Cleantech is a term used commonly to describe products and processes that solve global problems related to resource constraints. We believe macroeconomic and microeconomic trends including ongoing growth in consumption of energy and resources, energy security concerns and volatility of commodity prices create attractive investment opportunities in cleantech. We believe nanotechnology enables innovation in cleantech markets through:
|
|
|
New Approaches to Production: Nanotechnology-enabled methods of production can enable lower energy use at lower cost and operate with better performance than current methods of production.
|
|
|
|
New Materials: New materials enable the development of new products that overcome inherent limitations of existing technology and processes.
|
We continue to believe we are positioned well to take advantage of today’s growth markets within cleantech. We have been early investors in many of these markets. Our initial investments in biofuels in 2004 (Solazyme), light-emitting diodes in 2005 (Bridgelux) and batteries in 2007 (Contour Energy), now represent three of our top ten investments by value. These companies achieved record revenue growth in 2010 and continue to make progress in their respective markets. We also have Cleantech companies that are potentially positioned for near-term liquidity events as discussed in the section titled, "Recent and Pending Potential Liquidity Events from Our Portfolio as of March 31, 2011."
We also believe we have a pipeline of companies that are developing solutions for growth markets that are emerging today or may develop in future years such as produced water remediation (ABSMaterials), renewable chemicals (Cobalt) and alternative sources for high-intensity light (Laser Light Engines). The table below shows the breakdown of our Cleantech portfolio as of March 31, 2011, based on stage of maturity of the investment including the year of our initial investment in each of the companies.
Many of our Cleantech portfolio companies are generating commercial revenues and/or have entered into partnerships and joint development agreements with large corporations. We include some of the commercial developments from these portfolio companies during the first quarter below.
|
|
Solazyme
|
On March 24, 2011, Solazyme Health Sciences launched the Algenist line of anti-aging skincare products in 800 Sephora stores in eight countries.
|
| |
|
On March 9, 2011, Solazyme announced a joint development agreement with The Dow Chemical Company to develop the next generation of bio-based dielectric insulting fluids used in industrial equipment with Solazyme’s algal oils.
|
| |
|
|
| |
|
On March 11, 2011, Solazyme filed a registration statement on Form S-1 to pursue a potential IPO.
|
| |
|
|
| |
Bridgelux
|
On March 8, 2011, Bridgelux announced it demonstrated a 135-Lumens per Watt GaN-on-Silicon based LED Technology. Bridgelux believes this demonstration represents the industry’s first commercial grade performance for a Silicon-based LED.
|
| |
|
|
| |
ABSMaterials
|
In April 2011, field testing by DOE’s National Energy Technology Laboratory confirmed that ABSMaterials’ Osorb material could remove more than 99 percent of oil and grease from water, as well as more than 90 percent of toxic substances such as benzene, toluene, ethylbenzene and xylenes.
|
| |
|
|
| |
Contour Energy
|
In March 2011, Contour Energy announced the expansion of its Lithium coin cell product line with the introduction of new 2016 and 2450 batteries in response to growing worldwide demand from manufacturers and consumer electronics products.
|
| |
|
|
| |
Cobalt
|
In April 2011, Cobalt Technologies partnered with American Process to build the first cellulosic biobutanol plant.
|
| |
|
|
| |
Innovalight
|
In January 2011, Innovalight signed an agreement with Taiwan’s Motech to develop solar cells with its proprietary solar ink that boosts the performance of silicon solar cells. This represents the fifth business partnership for Innovalight.
|
We believe the macroeconomic and microeconomic dynamics that supported our thesis for historical investments in cleantech and the potential for nanotechnology to impact cleantech-related markets will continue for the foreseeable future. Some of the market opportunities we are currently investigating for investment opportunities include energy efficiency, energy storage and new methods for production, extraction and purification of high-value materials.
Assessment of Healthcare Portfolio as of March 31, 2011
We classify companies in our Healthcare portfolio as those that use nanotechnology to address problems in healthcare-related industries, including biotechnology, pharmaceuticals and medical devices. We believe macroeconomic and microeconomic trends including an aging population, increasing life expectancy, increasing prosperity that drives efforts to extend life, the increased global reach of disease and the need to address exponential growth of expenses of entitlement programs in some wealthy countries create attractive investment opportunities in healthcare. We believe nanotechnology enables innovation in healthcare markets through:
|
|
|
Engineering of Biological Systems: The ability to study, optimize, and engineer biological systems at the nanoscale enables the use of biological systems for diagnosis and treatment of disease.
|
|
|
|
Convergence of Multiple Disciplines: Much of the exciting work in nanotechnology is enabled by the convergence of the knowledge from multiple scientific disciplines. This convergence enables advances in healthcare that could not otherwise occur within one discipline.
|
|
|
|
New Tools: Complex biological processes include and are often the result of nanoscale phenomena. The ability to study and interpret these processes requires new tools. The information produced by these tools may advance the understanding and facilitate the engineering of biological systems.
|
We continue to believe we are positioned well to take advantage of today’s growth markets within healthcare having been early investors in many of these markets. We believe our initial investments in drug delivery vehicles in 2002 (Mersana), metabolomics in 2006 (Metabolon), synthetic carbohydrates in 2007 (Ancora), oncolytic viruses in 2007 (BioVex) and therapeutic discovery platforms in 2007 (Ensemble), positioned us well to capture the growth of commercial interest in cancer therapeutics, vaccines and molecular diagnostics. Mersana and BioVex are in clinical trials with their respective treatments for cancer, and Metabolon generated record revenue in 2010. Additionally, we believe the acquisition of BioVex Group, Inc., by Amgen, Inc., on March 4, 2011, provided validation of commercial interest in the promise of oncolytic virus technology.
We also believe we have an emerging pipeline of companies that are developing solutions for growth markets that exist today or may develop in future years such as personalized medicine (Enumeral Biomedical) and wound care (PolyRemedy). The table below shows the breakdown of our Healthcare portfolio as of March 31, 2011, based on stage of maturity of the investment including the year of our initial investment in each of the companies.
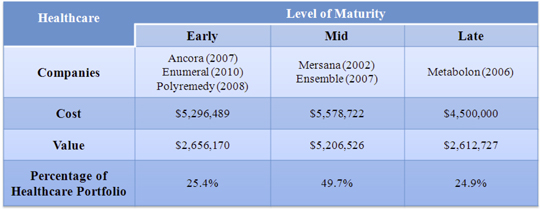
Our Healthcare companies demonstrate progress and growth through different mechanisms depending on their respective businesses. Businesses that provide services, such as Metabolon, generate revenues from the commercial sale of these services. Businesses that enter into partnerships for discovery and development of therapeutics, vaccines and diagnostics may generate revenue from upfront fees, milestone payments and royalties on sales of approved products. Businesses that endeavor to advance a therapeutic, diagnostic or vaccine product through clinical trials may not generate revenue until an approved product is on the market, if ever. Progress for these types of companies can be measured by progress through clinical trials. We include some of the developments from these portfolio companies during the first quarter below.
| |
BioVex
|
On March 4, 2011, Amgen, Inc., completed its acquisition of BioVex. The acquisition included an upfront payment of $425 million and milestone payments of up to $575 million. Details of this transaction are included in the section titled, “Recent and Pending Potential Liquidity Events from Our Portfolio as of March 31, 2011.”
|
| |
|
|
| |
Metabolon
|
On March 18, 2011, Metabolon announced it received a Certificate of Registration from the Centers for Medicare and Medicaid Services under the Clinical Laboratory Improvement Amendment (CLIA) for its new facility. The CLIA registration allows the company to launch its proprietary diagnostic tests for insulin resistance and urological cancers.
|
| |
|
|
| |
Ensemble
|
On April 12, 2011, Ensemble announced the achievement of a scientific milestone in its collaboration with Bristol-Myers-Squibb to develop a novel class of small molecule therapeutics against challenging drug targets that resulted in a milestone payment to Ensemble.
|
| |
|
|
| |
PolyRemedy
|
On April 19, 2011, PolyRemedy announced that Franciscan St. James Health has selected the Personalized Woundcare System (PWS™) to manage chronic wounds within St. James Home Health Services.
|
We believe the macroeconomic and microeconomic dynamics that supported our thesis for historical investments in healthcare and the potential for nanotechnology to impact healthcare-related markets will continue for the foreseeable future. Some of the market opportunities we are currently investigating for investment opportunities include molecular diagnostics, 3D biology, cellular therapy and tissue engineering.
Assessment of Electronics Portfolio as of March 31, 2011
We classify companies in our Electronics portfolio as those that use nanotechnology to address problems in electronics-related industries, including semiconductors, telecommunications and data communications, metrology and test and measurement. We believe macroeconomic and microeconomic trends including global connectivity, demand for increasing bandwidth due to pervasiveness of electronics in daily life, the desire to see not just hear, and need for real-time availability of data and demand for more functionality driven by increasing global prosperity create attractive investment opportunities in electronics. We believe nanotechnology enables innovation in electronics markets through:
|
|
|
New Methods of Production: Nanotechnology enables continuation of Moore’s Law for exponential increases of the number of integrated circuits in semiconductor devices.
|
|
|
|
New Materials: New materials enable unique capabilities, performance and form-factors in electronic devices.
|
|
|
|
New Forms of Computation: Nanotechnology enables methods of solving equations and other problems that would be difficult or impossible with standard digital computing techniques.
|
We continue to believe we are positioned well to take advantage of today’s growth markets within electronics having been early investors in many of these markets. We believe our initial investments in non-volatile memory in 2001 and 2007 (Nantero and Adesto, respectively), transparent conductors in 2004 (Cambrios), image sensors in 2006 (SiOnyx), integrated photonics in 2003 (NeoPhotonics) and metrology in 2006 (Xradia), positioned us well to capture the growth of commercial interest in smartphones and tablet computers with touchscreens, the exponential increase in demand for bandwidth for data and telecommunications and the demand for non-destructive imaging capabilities in a variety of industries.
We also believe we have an emerging pipeline of companies that are developing solutions for growth markets that exist today or may develop in future years such as high-performance computing enabled by quantum mechanics (D-Wave Systems) and radio-frequency identification and near-field communication devices enabled by printed electronics (Kovio). The table below shows the breakdown of our Electronics portfolio as of March 31, 2011, based on stage of maturity of the investment including the year of our initial investment in each of the companies.
Many of our Electronics portfolio companies are generating commercial revenues and/or have entered into partnerships and joint development agreements with large corporations. We include some of the commercial developments from these portfolio companies during the first quarter below.
| |
NeoPhotonics
|
On February 2, 2011, NeoPhotonics Corporation completed an IPO by selling 7,500,000 shares of common stock at $11 per share.
|
| |
Cambrios
|
In February 2011, Huawei, the largest Chinese telecommunications equipment producer, released the first smartphone enabled by Cambrios’ proprietary ClearOhm material for sale in Hong Kong.
|
| |
|
|
| |
|
In March 2011, Nissha Printing announced the mass production of touch sensor film using Cambrios’ technology.
|
| |
|
|
| |
|
In April 2011, Synaptics and Cambrios signed a reference design partnership agreement to bring Cambrios’ ClearOhm-based touch technology to the market.
|
We believe the macroeconomic and microeconomic dynamics that supported our thesis for historical investments in electronics and the potential for nanotechnology to impact electronics-related markets will continue for the foreseeable future, albeit with some adjustment. The high capital intensity of traditional semiconductor investments and the reduced values placed on these companies at exit in the current market environment have resulted in these investments becoming less favorable to investors, including ourselves. We are currently investigating opportunities that do not require as substantial the capital investment to reach commercial revenues and breakeven cash flow.
Investment Objective
Our principal objective is to achieve long-term capital appreciation by making equity-focused venture capital investments. Therefore, a significant portion of our current venture capital investment portfolio provides little or no income in the form of dividends or interest. Current income is a secondary objective. We are implementing a strategy that we believe will provide greater regularity and shorter time periods between realizations of capital gains on investments. As part of this strategy, we are seeking to increase our current income by providing debt financing to privately held and publicly traded small companies. We seek to reach the point where future growth is financed through reinvestment of our capital gains from our venture capital investments and where current income offsets our annual expenses during periods of time between realizations of capital gains on our investments.
We currently earn interest income from fixed-income securities, including U.S. government and agency securities. The amount of interest income we earn varies with the average balance of our fixed-income portfolio and the average yield on this portfolio. In previous years, we have been able to generate substantial amounts of interest income from our holdings of U.S. Treasury securities. As of March 31, 2011, we held four U.S. Treasury securities with maturity dates of less than six months yielding approximately 0.11 percent. As of March 31, 2011, yields for 3-month, 6-month, and 12-month U.S. Treasury securities were 0.09 percent, 0.17 percent and 0.30 percent, respectively. With yields at this level, we expect to generate less interest income from U.S. government securities than in previous fiscal quarters and years.
Results of Operations
We present the financial results of our operations utilizing GAAP for investment companies. On this basis, the principal measure of our financial performance during any period is the net increase (decrease) in our net assets resulting from our operating activities, which is the sum of the following three elements:
Net Operating Income (Loss) - the difference between our income from interest, dividends, and fees and our operating expenses.
Net Realized Gain (Loss) on Investments - the difference between the net proceeds of sales of portfolio securities and their stated cost, plus income from interests in limited liability companies.
Net Increase (Decrease) in Unrealized Appreciation or Depreciation on Investments - the net unrealized change in the value of our investment portfolio.
Owing to the structure and objectives of our business, we generally expect to experience net operating losses and seek to generate increases in our net assets from operations through the long term appreciation of our venture capital investments. We have relied, and continue to rely, primarily on proceeds from sales of investments, rather than on investment income, to defray a significant portion of our operating expenses. Because such sales are unpredictable, we attempt to maintain adequate working capital to provide for fiscal periods when there are no such sales. During 2010, we made our first venture debt investment. While the interest income generated from this investment did not defray a significant portion of our operating expenses in 2010, further investments in venture debt could generate more substantial investment income in future years.
The potential for, or occurrence of, inflation could result in rising interest rates for government-backed debt. This trend would have two effects on our business. First, the spread between the interest rates we can obtain from investing low-risk government debt versus high-risk venture debt will compress, which would result in a reduction of the risk premium associated with investments in venture debt. We may reduce the number and amount invested in venture debt should this risk premium decrease substantially as to not compensate us adequately for the risk associated with such investments. Second, funds drawn from our credit facility will accrue interest at a rate that fluctuates with the London Interbank Offered Rate (LIBOR). LIBOR is expected to increase in times of inflation. Our venture debt investments may include both fixed and floating interest rates. Our interest income would decrease if the spread between the interest rate on funds from our credit facility and our venture debt investments decrease.
Three months ended March 31, 2011, as compared with the three months ended March 31, 2010
In the three months ended March 31, 2011, we had a net decrease in net assets resulting from operations of $1,126,159. In the three months ended March 31, 2010, we had a net increase in net assets resulting from operations of $1,687,731.
Investment Income and Expenses:
We had net operating losses of $1,835,303 and $2,112,678 for the three months ended March 31, 2011, and March 31, 2010, respectively. The variation in these results is primarily owing to the changes in investment income and operating expenses, including non-cash expense of $427,314 in 2011 and $553,272 in 2010 associated with the granting of stock options. During the three months ended March 31, 2011, and 2010, total investment income was $136,824 and $79,073, respectively. During the three months ended March 31, 2011, and 2010, total operating expenses were $1,972,127 and $2,191,751, respectively.
During the three months ended March 31, 2011, as compared with the same period in 2010, investment income increased, reflecting an increase in interest income from the average interest rates yielded by our holdings of U.S. government securities, as well as an increase in interest income from bridge notes, subordinated and senior secured debt, and the participation agreement, offset by a decrease in our average holdings of U.S. government securities. During the three months ended March 31, 2011, our average holdings of such securities were $37,614,874, as compared with $54,156,767 during the three months ended March 31, 2010. The average yield on our U.S. government securities increased from 0.06 percent for the three months ended March 31, 2010, to 0.11 percent for the three months ended March 31, 2011.
Operating expenses, including non-cash, stock-based compensation expense, were $1,972,127 and $2,191,751 for the three months ended March 31, 2011, and March 31, 2010, respectively. The decrease in operating expenses for the three months ended March 31, 2011, as compared to the three months ended March 31, 2010, was primarily owing to decreases in salaries, benefits and stock-based compensation expense and administration and operations expense, offset by an increase in professional fees and rent expense. Salaries, benefits and stock-based compensation expense decreased by $150,179, or 10.8 percent, through March 31, 2011, as compared with March 31, 2010, primarily as a result of a decrease in non-cash expense of $125,958 associated with the Harris & Harris Group, Inc. 2006 Equity Incentive Plan (the "Stock Plan") and a decrease in salaries and benefits owing primarily to a decrease in our head count. At March 31, 2011, we had 10 full-time employees, as compared with 11 full-time employees at March 31, 2010. While the non-cash, stock-based compensation expense for the Stock Plan increased our operating expenses by $427,314, this increase was offset by a corresponding increase to our additional paid-in capital, resulting in no net impact to our net asset value. The non-cash, stock-based compensation expense and corresponding increase to our additional paid-in capital may increase in future quarters. Administration and operations expense decreased by $25,964, or 9.2 percent, through March 31, 2011, as compared with March 31, 2010, primarily as a result of a decrease in our directors' and officers' liability insurance expense and decreases in the cost of non-employee-related insurance. Rent expense increased by $12,285, or 15.9 percent, for the period ended March 31, 2011, as compared with the three months ended March 31, 2010. Our rent expense of $89,500 for the three months ended March 31, 2011, includes $94,898 of rent paid in cash net of $5,398 non-cash rent expense, credits and abatements that we recognize on a straight-line basis over the lease term. For the quarter ended March 31, 2010, we had a loss of $68,038 as a result of abandoning our lease at our former office prior to the end of the lease term which expired in April 2010.
Realized Income and Losses from Investments:
During the three months ended March 31, 2011, and March 31, 2010, we realized net gains (losses) on investments of $7,534,340 and $(11,523), respectively.
During the three months ended March 31, 2011, we realized net gains of $7,534,340, consisting of a realized gain of $7,509,340 on our investment in BioVex Group, Inc., and a realized gain of $25,000 on our investment in Siluria Technologies, Inc.
During the three months ended March 31, 2010, we realized net losses of $11,523, consisting primarily of realized gains on the sale of U.S. government securities, offset by realized losses on the disposal of fixed assets.
Net Unrealized Appreciation and Depreciation of Portfolio Securities:
During the three months ended March 31, 2011, net unrealized appreciation on total investments decreased by $6,822,906, or 90.9 percent, from net unrealized appreciation of $7,504,306 at December 31, 2010, to net unrealized appreciation of $681,400 at March 31, 2011. During the three months ended March 31, 2010, net unrealized depreciation on total investments decreased by $3,814,564, or 26.5 percent, from net unrealized depreciation of $14,378,869 at December 31, 2009, to net unrealized depreciation of $10,564,305 at March 31, 2010.
During the three months ended March 31, 2011, net unrealized appreciation on our venture capital investments decreased by $6,821,399, from net unrealized appreciation of $7,503,038 at December 31, 2010, to net unrealized appreciation of $681,639 at March 31, 2011, owing primarily to a decrease in unrealized appreciation for BioVex Group, Inc., of $7,467,615, which resulted from a realized gain on the sale of its securities. We also had decreases in the valuations of the following investments held:
|
Investment
|
Amount of Write-Down |
| |
|
|
|
|
Ancora Pharmaceuticals Inc.
|
|
$ |
636,955 |
|
|
Contour Energy Systems, Inc.
|
|
|
186,199 |
|
|
Innovalight, Inc.
|
|
|
78,782 |
|
|
Metabolon, Inc.
|
|
|
5,417 |
|
|
Molecular Imprints, Inc.
|
|
|
11,125 |
|
|
NeoPhotonics Corporation
|
|
|
351,772 |
|
|
Nextreme Thermal Solutions, Inc.
|
|
|
275,328 |
|
|
Questech Corporation
|
|
|
61,503 |
|
|
SiOnyx, Inc.
|
|
|
1,237 |
|
|
Xradia, Inc.
|
|
|
748,750 |
|
The write-downs for the three months ended March 31, 2011, were offset by increases in the valuations of the following investments held:
|
Investment
|
Amount of Write-Up |
| |
|
|
|
|
BridgeLux, Inc.
|
|
$ |
1,636,736 |
|
|
Cobalt Technologies, Inc.
|
|
|
505,280 |
|
|
Enumeral Biomedical Corp.
|
|
|
83,333 |
|
|
GEO Semiconductor, Inc.
|
|
|
13,323 |
|
|
Kovio, Inc.
|
|
|
622,732 |
|
|
NanoTerra, Inc.
|
|
|
2,576 |
|
|
Solazyme, Inc.
|
|
|
23,041 |
|
We had an increase in unrealized appreciation owing to foreign currency translation of $116,263 on our investment in D-Wave Systems, Inc.
During the three months ended March 31, 2010, net unrealized depreciation on our venture capital investments decreased by $3,805,387, from net unrealized depreciation of $14,366,426 at December 31, 2009, to net unrealized depreciation of $10,561,039 at March 31, 2010, owing primarily to increases in the valuations of the following investments held:
|
Investment
|
Amount of Write-Up |
| |
|
|
|
|
BridgeLux, Inc.
|
|
$ |
1,443,475 |
|
|
Ensemble Discovery Corporation
|
|
|
500,000 |
|
|
Mersana Therapeutics, Inc.
|
|
|
975,813 |
|
|
Metabolon, Inc.
|
|
|
76,162 |
|
|
NeoPhotonics Corporation
|
|
|
1,543,752 |
|
|
Orthovita, Inc.
|
|
|
71,784 |
|
|
Questech Corporation
|
|
|
7,210 |
|
|
Satcon Technology Corporation
|
|
|
5,797 |
|
|
SiOnyx, Inc.
|
|
|
1,076,154 |
|
|
Xradia, Inc.
|
|
|
600,447 |
|
The write-ups for the three months ended March 31, 2010, were partially offset by decreases in the valuations of the following investments held:
|
Investment
|
Amount of Write-Down |
| |
|
|
|
|
BioVex Group, Inc.
|
|
$ |
1,999 |
|
|
Kovio, Inc.
|
|
|
1,414,490 |
|
|
Molecular Imprints, Inc.
|
|
|
8,250 |
|
|
Nextreme Thermal Solutions, Inc.
|
|
|
1,101,314 |
|
|
PolyRemedy, Inc.
|
|
|
53,893 |
|
We had an increase owing to foreign currency translation of $84,739 on our investment in D-Wave Systems, Inc.
Unrealized appreciation on our U.S. government securities portfolio decreased from unrealized appreciation of $1,268 at December 31, 2010, to unrealized depreciation of $239 at March 31, 2011.
Unrealized depreciation on our U.S. government securities portfolio decreased from $12,443 at December 31, 2009, to $3,266 at March 31, 2010.
Financial Condition
At March 31, 2011, our total assets and net assets were $150,174,275 and $146,632,745, respectively. At December 31, 2010, they were $149,289,168 and $146,853,912, respectively.
At March 31, 2011, our net asset value per share was $4.73, as compared with $4.76 at December 31, 2010. At March 31, 2011, our shares outstanding increased to 30,997,601 from 30,878,164 at December 31, 2010. Our shares outstanding increased due to the exercise of 119,437 options. These option exercises provided $477,678 of cash to the Company.
Significant developments in the three months ended March 31, 2011, included a decrease in the holdings of our venture capital investments of $8,391,433 and an increase in our holdings of U.S. government obligations and cash of $4,219,046. The decrease in the value of our venture capital investments from $106,150,422 at December 31, 2010, to $97,758,989 at March 31, 2011, resulted primarily from the sale of our securities in BioVex Group, Inc., and Siluria Technologies, Inc., and by one new and four follow-on investments of $2,536,174, offset by an increase in the net value of our venture capital investments of $646,216. The increase in the value of our U.S. government obligations and cash from $42,031,536 at December 31, 2010, to $46,250,582 at March 31, 2011, is primarily owing to the sale of our securities in BioVex Group, Inc., and Siluria Technologies, Inc., offset by the payment of cash for operating expenses of $1,495,756 and to new and follow-on venture capital investments totaling $2,536,174.
The following table is a summary of additions to our portfolio of venture capital investments made during the three months ended March 31, 2011:
|
New Investments
|
Amount of Investment |
| |
|
|
|
|
NanoTerra, Inc.
|
|
$ |
750,000 |
|
| |
|
|
|
|
|
Follow-On Investments
|
Amount of Investment |
| |
|
|
|
|
|
Bridgelux, Inc.
|
|
$ |
813,805 |
|
|
NeoPhotonics Corporation
|
|
|
550,000 |
|
|
GEO Semiconductor, Inc.
|
|
|
150,000 |
|
|
Innovalight, Inc.
|
|
|
272,369 |
|
|
Total
|
|
$ |
2,536,174 |
|
The following tables summarize the values of our portfolios of venture capital investments and U.S. government obligations, as compared with their cost, at March 31, 2011, and December 31, 2010:
| |
|
March 31, 2011
|
|
|
December 31, 2010
|
|
| |
|
|
|
|
|
|
|
Venture capital investments, at cost
|
|
$ |
97,077,350 |
|
|
$ |
98,647,384 |
|
|
Net unrealized appreciation(1)
|
|
|
681,639 |
|
|
|
7,503,038 |
|
|
Venture capital investments, at value
|
|
$ |
97,758,989 |
|
|
$ |
106,150,422 |
|
| |
|
March 31, 2011
|
|
|
December 31, 2010
|
|
| |
|
|
|
|
|
|
|
U.S. government obligations, at cost
|
|
$ |
39,196,567 |
|
|
$ |
38,273,349 |
|
|
Net unrealized (depreciation) appreciation(1)
|
|
|
(239 |
) |
|
|
1,268 |
|
|
U.S. government obligations, at value
|
|
$ |
39,196,328 |
|
|
$ |
38,274,617 |
|
(1)At March 31, 2011, and December 31, 2010, the net accumulated unrealized appreciation on investments was $681,400 and $7,504,306, respectively.
Liquidity
Our liquidity and capital resources are generated and are generally available through our cash holdings, interest earned on our investments on U.S. government securities, cash flows from the sales of U.S. government securities and payments received on our venture debt investments, proceeds from periodic follow-on equity offerings and realized capital gains retained for reinvestment.
We fund our day-to-day operations using interest earned and proceeds from the sales of our investments in U.S. government securities and interest earned from our venture debt securities. We believe the increase or decrease in the value of our venture capital investments does not materially affect the day-to-day operations of the Company or our daily liquidity. At March 31, 2011, and December 31, 2010, we had no investments in money market mutual funds.
We have a $10 million three-year revolving credit facility with TD Bank, N.A. This credit facility is used to fund our venture debt investments and not for the payment of day-to-day operating expenses. As of March 31, 2011, we had debt outstanding of $1,250,000, which is less than one percent of our net assets. This debt is collateralized with cash held in a restricted account on a one-for-one basis with the amount of debt outstanding from the credit facility. Therefore, repayment of the outstanding debt as of March 31, 2011, would not have a significant impact on our daily liquidity. We have not issued any debt securities, and, therefore, are not subject to credit agency downgrades.
As a venture capital company, it is critical that we have capital available to support our best companies until we have an opportunity for liquidity in our investments. As such, we will continue to maintain a substantial amount of liquid capital on our balance sheet. However, to complement our equity-focused portfolio investing, we seek to invest some of this capital in venture debt where we will have more defined investment return timelines than we currently have in our existing portfolio. In addition, we may from time to time opt to borrow money to make investments, specifically in debt securities that generate cash flow and have a known timeframe for return on investment.
At March 31, 2011, and December 31, 2010, our total net primary liquidity was $46,410,104 and $42,079,934, respectively. Our primary liquidity is comprised of our cash, U.S. government securities, receivables from unsettled trades, receivables from portfolio companies and interest receivables. The increase in our primary liquidity from December 31, 2010, to March 31, 2011, is primarily owing to the sale of investments, offset by the use of funds for investments and payment of net operating expenses.
At March 31, 2011, and December 31, 2010, our secondary liquidity was $4,447,843 and $0, respectively. Our secondary liquidity consists of our publicly traded securities. Although these companies are publicly traded, their stock may not trade at high volumes and prices can be volatile, which may restrict our ability to sell our positions at any given time. We may also be restricted for a period of time in selling our positions in these companies due to lock-up provisions or due to our shares being unregistered.
We believe that the difficult venture capital environment may continue to adversely affect the valuation of investment portfolios, tighter lending standards and reduced access to capital. These conditions may lead to a further decline in net asset value and/or decline in valuations of our portfolio companies. Although we cannot predict future market conditions, we continue to believe that our current cash and U.S. government security holdings and our ability to adjust our investment pace will provide us with adequate liquidity to execute our current business strategy.
Except for a rights offering, we are also generally not able to issue and sell our common stock at a price below our net asset value per share, exclusive of any distributing commission or discount, without shareholder approval. As of March 31, 2011, our net asset value per share was $4.73 per share and our closing market price was $5.38 per share. We do not currently have shareholder approval to issue or sell shares below our net asset value per share.
Borrowings
On February 24, 2011, we established a new $10 million three-year revolving credit facility with TD Bank, N.A., to be used in conjunction with our venture debt investments.
The credit facility, among other things, matures on February 24, 2014, and generally bears interest, at the Company’s option, based on (i) LIBOR plus 1.25 percent or (2) the higher of the federal funds rate plus fifty basis points (0.50 percent) or the U.S. prime rate as published in the Wall Street Journal. The credit facility generally requires payment of interest on a monthly basis and requires the payment of a non-use fee of 0.15 percent annually. All outstanding principal is due upon maturity. The credit facility is secured by cash collateral to be held in a non-interest bearing account at TD Bank. The credit facility contains affirmative and restrictive covenants, including: (a) periodic financial reporting requirements, (b) maintaining our status as a BDC (c) maintaining unencumbered, liquid assets of not less than $7,500,000, (d) limitations on the incurrence of additional indebtedness, (e) limitations on liens, and (f) limitations on mergers and dissolutions. The credit facility is used to supplement our capital to make additional venture debt investments.
The Company’s outstanding debt balance was $1,250,000 and $0, at March 31, 2011, and December 31, 2010, respectively. The annual interest cost for the three months ended March 31, 2011, was 1.5345 percent, exclusive of closing fees and for other prepaid expenses related to establishing the credit facility. The remaining capacity under the credit facility was $8,750,000 at March 31, 2011. At March 31, 2011, the Company was in compliance with all financial covenants required by the credit facility.
Contractual Obligations
A summary of our significant contractual payment obligations is as follows:
| |
|
Total
|
|
|
Less than
1 Year
|
|
|
1-3 Years
|
|
|
3-5 Years
|
|
|
More Than
5 Years
|
|
|
Revolving credit facility(1)
|
|
$ |
1,250,000 |
|
|
$ |
— |
|
|
$ |
1,250,000 |
|
|
$ |
— |
|
|
$ |
— |
|
|
(1)
|
As of March 31, 2011, we had $8.75 million of unused borrowing capacity under our credit facility.
|
Capital Resources
On October 9, 2009, we completed the sale of 4,887,500 shares of our common stock at a price of $4.75 per share to the public for total gross proceeds of $23,215,625; net proceeds of this offering, after deducting underwriting discounts and offering costs of $2,000,413, were $21,215,212. We intend to use, and have been using, the net proceeds of this offering to make new investments in nanotechnology, as well as for follow-on investments in our existing venture capital investments and for working capital. Through March 31, 2011, we have used all of the net proceeds from this offering for these purposes.
Critical Accounting Policies
The Company's significant accounting policies are described in Note 3 to the Consolidated Financial Statements and in the Footnote to the Consolidated Schedule of Investments. Critical accounting policies are those that are both important to the presentation of our financial condition and results of operations and those that require management’s most difficult, complex or subjective judgments. The Company considers the following accounting policies and related estimates to be critical:
Valuation of Portfolio Investments
The most significant estimate inherent in the preparation of our consolidated financial statements is the valuation of investments and the related amounts of unrealized appreciation and depreciation of investments recorded. As a BDC, we invest in primarily illiquid securities that generally have no established trading market.
Investments are stated at "value" as defined in the 1940 Act and in the applicable regulations of the SEC and GAAP. Value, as defined in Section 2(a)(41) of the 1940 Act, is (i) the market price for those securities for which a market quotation is readily available and (ii) the fair value as determined in good faith by, or under the direction of, the Board of Directors for all other assets. (See "Valuation Procedures" in the "Footnote to Consolidated Schedule of Investments.") As of March 31, 2011, our financial statements include venture capital investments valued at $97,758,989, the fair values of which were determined in good faith by, or under the direction of, the Board of Directors. As of March 31, 2011, approximately 66.7 percent of our net assets represent investments in portfolio companies at fair value by the Board of Directors.
Determining fair value requires that judgment be applied to the specific facts and circumstances of each portfolio investment, although our valuation policy is intended to provide a consistent basis for determining fair value of the portfolio investments. Factors that may be considered include, but are not limited to, the cost of the Company’s investment; transactions in the portfolio company’s securities or unconditional firm offers by responsible parties; the financial condition and operating results of the company; the long-term potential of the business and technology of the company; the values of similar securities issued by companies in similar businesses; multiples to revenues, net income or EBITDA that similar securities issued by companies in similar businesses receive; the proportion of the company’s securities we own and the nature of any rights to require the company to register restricted securities under the applicable securities laws; the achievement of milestones; and the rights and preferences of the class of securities we own as compared with other classes of securities the portfolio has issued.
In addition, with respect to our debt investments for which no readily available market quotations are available, we will generally consider the financial condition and current and expected future cash flows of the portfolio company; the creditworthiness of the portfolio company and its ability to meet its current debt obligations; the relative seniority of our debt investment within the portfolio company’s capital structure; the availability and value of any available collateral; and changes in market interest rates and credit spreads for similar debt investments.
Historically, difficult venture capital environments have resulted in companies not receiving financing and being subsequently closed down with a loss of investment to venture investors, and other companies receiving financing but at significantly lower valuations than the preceding rounds, leading to very deep dilution for those who do not participate in the new rounds of investment. Our best estimate of this non-performance risk has been quantified and included in the valuation of our portfolio companies as of March 31, 2011.
All investments recorded at fair value are categorized based upon the level of judgment associated with the inputs used to measure their fair value. Hierarchical levels related to the amount of subjectivity associated with the inputs to fair valuation of these assets, are as follows:
|
|
·
|
Level 1: Unadjusted quoted prices in active markets for identical assets or liabilities.
|
|
|
·
|
Level 2: Quoted prices in active markets for similar assets or liabilities, or quoted prices for identical or similar assets or liabilities in markets that are not active, or inputs other than quoted prices that are observable for the asset or liability.
|
| |
·
|
Level 3: Unobservable inputs for the asset or liability.
|
As of March 31, 2011, all of our portfolio company investments were classified as Level 3 in the hierarchy, indicating a high level of judgment required in their valuation.
The values assigned to our assets are based on available information and do not necessarily represent amounts that might ultimately be realized, as these amounts depend on future circumstances and cannot be reasonably determined until the individual investments are actually liquidated or become readily marketable. Upon sale of investments, the values that are ultimately realized may be different from what is presently estimated. This difference could be material.
Stock-Based Compensation
Determining the appropriate fair-value model and calculating the fair value of share-based awards on the date of grant requires judgment. Historically, we have used the Black-Scholes-Merton option pricing model to estimate the fair value of employee stock options.
Management uses the Black-Scholes-Merton option pricing model in instances where we lack historical data necessary for more complex models and when the share award terms can be valued within the model. Other models may yield fair values that are significantly different from those calculated by the Black-Scholes-Merton option pricing model.
Management uses a binomial lattice option pricing model in instances where it is necessary to include a broader array of assumptions. We used the binomial lattice model for the 10-year NQSOs granted on March 18, 2009. These awards included accelerated vesting provisions that were based on market conditions. At the date of the grant, management’s analysis concluded that triggering of the market condition acceleration clause was probable.
Option pricing models require the use of subjective input assumptions, including expected volatility, expected life, expected dividend rate, and expected risk-free rate of return. Variations in the expected volatility or expected term assumptions have a significant impact on fair value. As the volatility or expected term assumptions increase, the fair value of the stock option increases. The expected dividend rate and expected risk-free rate of return are not as significant to the calculation of fair value. A higher assumed dividend rate yields a lower fair value, whereas higher assumed interest rates yield higher fair values for stock options.
In the Black-Scholes-Merton model, we use the simplified calculation of expected term as described in the SEC’s Staff Accounting Bulletin 107 because of the lack of historical information about option exercise patterns. In the binomial lattice model, we use an expected term that assumes the options will be exercised at two-times the strike price because of the lack of option exercise patterns. Future exercise behavior could be materially different than that which is assumed by the model.
Expected volatility is based on the historical fluctuations in the Company's stock. The Company's stock has historically been volatile, which increases the fair value of the underlying share-based awards.
GAAP requires us to develop an estimate of the number of share-based awards that will be forfeited owing to employee turnover. Quarterly changes in the estimated forfeiture rate can have a significant effect on reported share-based compensation, as the effect of adjusting the rate for all expense amortization after the grant date is recognized in the period the forfeiture estimate is changed. If the actual forfeiture rate proves to be higher than the estimated forfeiture rate, then an adjustment will be made to increase the estimated forfeiture rate, which would result in a decrease to the expense recognized in the financial statements. If the actual forfeiture rate proves to be lower than the estimated forfeiture rate, then an adjustment will be made to decrease the estimated forfeiture rate, which would result in an increase to the expense recognized in the financial statements. Such adjustments would affect our operating expenses and additional paid-in capital, but would have no effect on our net asset value.
Pension and Post-Retirement Benefit Plan Assumptions
The Company provides a Retiree Medical Benefit Plan for employees who meet certain eligibility requirements. The Company also provides an Executive Mandatory Retirement Benefit Plan for certain individuals employed by us in a bona fide executive or high policy-making position. Several statistical and other factors that attempt to anticipate future events are used in calculating the expense and liability values related to our post-retirement benefit plans. These factors include assumptions we make about the discount rate, the rate of increase in healthcare costs, and mortality, among others.
The discount rate reflects the current rate at which the post-retirement medical benefit and pension liabilities could be effectively settled considering the timing of expected payments for plan participants. In estimating this rate, we consider the Citigroup Pension Liability Index in the determination of the appropriate discount rate assumptions. The weighted average rate we utilized to measure our post retirement medical benefit obligation as of December 31, 2010, and to calculate our 2011 expense was 5.68 percent. We used a discount rate of 5.75 percent to calculate our pension obligation for the Executive Mandatory Retirement Benefit Plan.
Recent Developments - Portfolio Companies
On April 1, 2011, the Company made a $121,560 follow-on investment in Cobalt Technologies, Inc., a privately held, equity-focused portfolio company.
On April 4, 2011, the Company made a $2,000,000 investment in Champions Oncology, Inc., a new publicly traded, equity-focused portfolio company.
On April 12, 2011, the Company made a $298,900 follow-on investment in Mersana Therapeutics, Inc., a privately held, equity-focused portfolio company.
On April 15, 2011, the Company made an $866,668 follow-on investment in a privately held, equity-focused portfolio company.
On April 18, 2011, the Company made a $445,659 follow-on investment in a privately held, equity- focused portfolio company.
On April 19, 2011, the Company made a $650,000 follow-on investment in Enumeral Biomedical Corp., a privately held, equity-focused portfolio company.
On April 26, 2011, the Company made a $63,250 follow-on investment in a privately held, equity- focused portfolio company.
Forward-Looking Statements
The information contained herein may contain "forward-looking statements" based on our current expectations, assumptions and estimates about us and our industry. These forward-looking statements involve risks and uncertainties. Words such as "believe," "anticipate," "estimate," "expect," "intend," "plan," "will," "may," "might," "could," "continue" and other similar expressions identify forward-looking statements. In addition, any statements that refer to expectations, projections or other characterizations of future events or circumstances are forward-looking statements. Our actual results could differ materially from those anticipated in the forward-looking statements as a result of several factors more fully described in "Risk Factors" and elsewhere in this Form 10-Q, and in our Form 10-K for the year ended December 31, 2010. The forward-looking statements made in this Form 10-Q relate only to events as of the date on which the statements are made. We undertake no obligation to update publicly any forward-looking statements for any reason, even if new information becomes available or other events occur in the future.
Item 3. Quantitative and Qualitative Disclosures About Market Risk.
Our business activities contain elements of risk. We consider the principal types of market risk to be valuation risk, interest rate risk and foreign currency risk. Although we are risk-seeking rather than risk-averse in our investments, we consider the management of risk to be essential to our business.
Valuation Risk
Value, as defined in Section 2(a)(41) of the 1940 Act, is (i) the market price for those securities for which market quotations are readily available and (ii) fair value as determined in good faith by, or under the direction of, the Board of Directors for all other assets. (See the "Valuation Procedures" in the "Footnote to Consolidated Schedule of Investments" contained in "Item 1. Consolidated Financial Statements.")
Because there is typically no public market for our interests in the small privately held companies in which we invest, the valuation of the securities in that portion of our portfolio is determined in good faith by our Board of Directors with the assistance of our Valuation Committee, comprised of the independent members of our Board of Directors, in accordance with our Valuation Procedures. In the absence of a readily ascertainable market value, the determined value of our portfolio of securities may differ significantly from the values that would be placed on the portfolio if a ready market for such securities existed. Determining fair value requires that judgment be applied to the specific facts and circumstances of each portfolio investment, although our valuation policy is intended to provide a consistent basis for determining fair value of the portfolio investments. Factors that may be considered include, but are not limited to, readily available public market quotations; the cost of the Company’s investment; transactions in the portfolio company’s securities or unconditional firm offers by responsible parties; the financial condition and operating results of the company; the long-term potential of the business and technology of the company; the values of similar securities issued by companies in similar businesses; multiples to revenues, net income or EBITDA that similar securities issued by companies in similar businesses receive; the proportion of the company’s securities we own and the nature of any rights to require the company to register restricted securities under the applicable securities laws; the achievement of milestones; and the rights and preferences of the class of securities we own as compared with other classes of securities the portfolio has issued.
In addition, with respect to our debt investments for which no readily available market quotations are available, we will generally consider the financial condition and current and expected future cash flows of the portfolio company; the creditworthiness of the portfolio company and its ability to meet its current debt obligations; the relative seniority of our debt investment within the portfolio company’s capital structure; the availability and value of any available collateral; and changes in market interest rates and credit spreads for similar debt investments. Any changes in valuation are recorded in our Consolidated Statements of Operations as "Net decrease in unrealized depreciation on investments." Changes in valuation of any of our investments in privately held companies from one period to another may be volatile.
Investments in privately held, immature companies are inherently more volatile than investments in more mature businesses. Such immature businesses are inherently fragile and easily affected by both internal and external forces. Our investee companies can lose much or all of their value suddenly in response to an internal or external adverse event. Conversely, these immature businesses can gain suddenly in value in response to an internal or external positive development.
The values assigned to our assets are based on available information and do not necessarily represent amounts that might ultimately be realized, as these amounts depend on future circumstances and cannot be reasonably determined until the individual investments are actually liquidated or become readily marketable. Upon sale of investments, the values that are ultimately realized may be different from what is presently estimated. This difference could be material.
Interest Rate Risk
Interest rate sensitivity refers to the change in earnings that may result from changes in the level of interest rates. As of March 31, 2011, our two venture debt investments, GEO Semiconductor Inc., and NanoTerra, Inc., were at fixed rates. A change in interest rates would, therefore, not have a material effect on our gross investment income. In the future, some of our venture debt investments may be at variable rates. Because we intend to fund a portion of our venture debt investments with borrowings, our net investment income will be affected by the difference between the rate at which we invest and the rate at which we borrow. As a result, there can be no assurance that a significant change in market interest rates will not have a material adverse effect on our net investment income in future quarters. As of March 31, 2011, we had $1,250,000 of debt outstanding on our $10 million credit facility that was used to fund our venture debt investments.
We generally also invest in both short- and long-term U.S. government and agency securities. To the extent that we invest in short and long-term U.S. government and agency securities, changes in interest rates result in changes in the value of these obligations that result in an increase or decrease of our net asset value. The level of interest rate risk exposure at any given point in time depends on the market environment, the expectations of future price and market movements, and the quantity and duration of long-term U.S. government and agency securities held by the Company, and it will vary from period to period. If the average interest rate on U.S. government securities at March 31, 2011, were to increase by 25, 75 and 150 basis points, the average value of these securities held by us at March 31, 2011, would decrease by approximately $97,991, $293,972 and $587,945, respectively, and the portion of our net asset value attributable to such securities would decrease correspondingly.
In addition, market interest rates for high-yield corporate debt are an input in determining value of our investments in debt securities of privately held and publicly traded companies. Significant changes in these market rates could affect the value of our debt securities as of the date of measurement of value.
Foreign Currency Risk
Most of our investments are denominated in U.S. dollars. We currently have one investment denominated in Canadian dollars. We are exposed to foreign currency risk related to potential changes in foreign currency exchange rates. The potential loss in fair value on this investment resulting from a 10 percent adverse change in quoted foreign currency exchange rates is $398,413 at March 31, 2011.
Item 4. Controls and Procedures
(a) Disclosure Controls and Procedures. As of the end of the period covered by this report, the Company’s management, under the supervision and with the participation of our chief executive officer and chief financial officer, conducted an evaluation of the effectiveness of the design and operation of our disclosure controls and procedures (as required by Rules 13a-15 of the 1934 Act). Disclosure controls and procedures means controls and other procedures of an issuer that are designed to ensure that information required to be disclosed by the issuer in the reports that it files or submits under the 1934 Act is recorded, processed, summarized and reported, within time periods specified in the SEC's rules and forms, and that such information is accumulated and communicated to the issuer's management, as appropriate, to allow timely decisions regarding required disclosures. As of March 31, 2011, based upon this evaluation of our disclosure controls and procedures, our chief executive officer and chief financial officer concluded that our disclosure controls and procedures were effective.
(b) Changes in Internal Control Over Financial Reporting. There have not been any changes in the Company's internal control over financial reporting (as such term is defined in Rules 13a-15(f) and 15d-15(f) under the 1934 Act) during the first quarter of 2011 to which this report relates that have materially affected, or are reasonably likely to materially affect, the Company’s internal control over financial reporting.
PART II. OTHER INFORMATION
Item 1A. Risk Factors
Investing in our common stock involves significant risks relating to our business and investment objective. You should carefully consider the risks and uncertainties described in our Annual Report on Form 10-K for the year ended December 31, 2010, before you purchase any of our common stock.
The risks described in our Annual Report on Form 10-K are not the only risks facing our Company. Unknown additional risks and uncertainties, or ones that we currently consider immaterial, may also impair our business. If any of these risks or uncertainties materialize, our business, financial condition or results of operations could be materially adversely affected. In this event, the trading price of our common stock could decline, and you could lose all or part of your investment.
|
Item 5.
|
Exhibits
|
| |
|
|
| |
10.1
|
Revolving Loan Agreement, dated as of February 24, 2011, by and between Harris & Harris Group, Inc. and TD Bank, N.A., incorporated by reference as Exhibit 10.1 to the Company's Form 8-K (File No. 814-00176) filed on February 24, 2011.
|
| |
|
|
| |
10.2
|
Custody Agreement, dated as of February 24, 2011, by and between Harris & Harris Group, Inc. and TD Bank, N.A., incorporated by reference as Exhibit 10.2 to the Company's Form 8-K (File No. 814-00176) filed on February 24, 2011.
|
| |
|
|
| |
10.3
|
Custody Agreement, dated as of March 11, 2011, by and between Harris & Harris Group, Inc. and Union Bank, N.A., incorporated by reference as Exhibit 10.1 to the Company's Form 8-K (File No. 814-00176) filed on March 14, 2011.
|
| |
|
|
| |
31.01*
|
Certification of CEO pursuant to Section 302 of the Sarbanes-Oxley Act of 2002.
|
| |
|
|
| |
31.02*
|
Certification of CFO pursuant to Section 302 of the Sarbanes-Oxley Act of 2002.
|
| |
|
|
| |
32*
|
Certification of CEO and CFO pursuant to 18 U.S.C. Section 1350, as adopted pursuant to Section 906 of the Sarbanes-Oxley Act of 2002.
|
*filed herewith
SIGNATURES
Pursuant to the requirements of the Securities Exchange Act of 1934, the Registrant has caused this report to be signed on its behalf by the undersigned thereunto duly authorized.
|
Harris & Harris Group, Inc.
|
| |
|
| /s/ Daniel B. Wolfe |
|
By:
|
Daniel B. Wolfe
|
| |
Chief Financial Officer
|
| |
|
| /s/ Patricia N. Egan |
|
By:
|
Patricia N. Egan
|
| |
Chief Accounting Officer
|
| |
and Vice President
|
Date: May 10, 2011
EXHIBIT INDEX
|
Exhibit No.
|
|
Description
|
| |
|
|
|
31.01
|
|
Certification of CEO pursuant to Section 302 of the Sarbanes-Oxley Act of 2002.
|
| |
|
|
|
31.02
|
|
Certification of CFO pursuant to Section 302 of the Sarbanes-Oxley Act of 2002.
|
| |
|
|
|
32
|
|
Certification of CEO and CFO pursuant to 18 U.S.C. Section 1350, as adopted pursuant to Section 906 of the Sarbanes-Oxley Act of 2002.
|