UNITED STATES
SECURITIES AND EXCHANGE COMMISSION
Washington, D.C. 20549
FORM N-CSR
CERTIFIED SHAREHOLDER REPORT OF REGISTERED
MANAGEMENT INVESTMENT COMPANY
Investment Company Act file number 811-07074
| | |
| 180 DEGREE CAPITAL CORP. |
| (Exact Name of Registrant as Specified in Its Charter) |
| | | | | | | | |
| 7 N. Willow Street, Suite 4B, Montclair NJ | | 07042 |
| (Address of Principal Executive Offices) | | (Zip Code) |
| | |
Daniel B. Wolfe
President and Chief Financial Officer
180 Degree Capital Corp.
7 N. Willow Street, Suite 4B
Montclair, NJ 07042 |
| (Name and address of agent for service) |
|
Copy to:
John J. Mahon, Esq.
Schulte Roth & Zabel, LLP
1152 Fifteenth Street, NW
Suite 850
Washington, DC 20005
(202) 729-7477 |
Registrant's telephone number, including area code: (973) 746-4500
Date of fiscal year end: December 31
Date of reporting period: December 31, 2019
Beginning on January 1, 2021, and as permitted by a rule adopted by the Securities and Exchange Commission ("SEC"), paper copies of the shareholder reports of 180 Degree Capital Corp. (the "Company") like this one, will no longer be sent to you by mail unless you specifically request that the Company or your financial intermediary (i.e., the broker-dealer or bank through which you own your shares) send you paper copies. Instead, shareholder reports will be made available on a website, and you will be notified by mail each time a report is posted and you will be provided with a website link to access the report.
If you already have elected to receive shareholder reports electronically, you will not be affected by this change and need not take any action. You may elect to receive all future shareholder reports of the Company in paper free of charge. If you own shares through a financial intermediary, you may contact your financial intermediary to elect to continue to receive paper copies of your shareholder reports, or if your shares are not held by a financial intermediary, you may contact the Company's transfer agent, American Stock Transfer & Trust Company, LLC at 800-937-5449, or the Company at 833-293-1769.
Item 1. Report to Shareholders.
Fellow Shareholders,
I really don’t want to be that person that is constantly repeating himself without actually knowing if he has told the story or made the statement before. In this particular case, I am going to be consciously repeating myself and making a statement that has become so obvious. So here goes…
Our decision to change our strategy from a business development company (BDC) investing in venture capital companies to a closed end fund investing in small capitalization public companies with a constructive activist approach has yielded significant and positive returns for our shareholders. I think it is fair to say that it has been a game changer. Over the three years since we made this change, our net asset value per share (NAV) increased significantly from $2.34 to $3.06, despite only being able to access on average 37% of our balance sheet. This NAV growth of 30.8% is net of all expenses and outpaced our relevant benchmark, the Russell Microcap Index (RMICRO), which increased by 20.5% over the same period. We have a more liquid and robust balance sheet now with over 50% of our assets in cash and public securities, making it much easier for investors to value us. As of December 31, 2019, our cash (net of unsettled trades) and public securities equate to a value of $1.65 per share, up from $0.64 per share as of the end of 2016.
During the last three years, our share price increased 55.8%, beating not only the RMICRO, which increased by 20.5%, but also the S&P 500 Index (SPX),which increased by 53.1%. In this past quarter, the gross total return of our public holdings was 7.7% and added $0.13 to our NAV. This gain was offset in part by a 3.6%, or $0.06, decline in the value of our private holdings. In 2019, the gross total return of our public holdings was 70.8% and added $0.72 to our NAV, while our private holdings decreased in value by 7.8% and reduced our NAV by $0.13. Finally, for the three years since we began executing on our strategy, we achieved a gross total return of 210% from our public holdings, adding $1.18 to our NAV. Over the same three years, our private holdings declined 3%, and caused a $0.06 reduction to our NAV. While our fourth quarter 2019 public stock performance trailed the performance of RMICRO of 13.4%, our 2019 gross total return of our public holdings of 70.8% decimated the RMICRO’s total return of 22.4%.
The world has gone passive. With each new high in the market, the mindlessness of the overall market becomes more evident. For instance, in 2019, there were $204.1 billion of net withdrawals from actively managed U.S. stock funds, while at the same time passively managed funds had new inflows of $162.7 billion. One of the reasons I left BlackRock in 2012 was that I found it harder and harder to add alpha by investing in the largest market capitalization companies that existed in the United States. I wanted to invest in a part of the market where good stock picking could take advantage of market inefficiencies. That is why we have been focused on the microcap universe of companies, where the market is so much more inefficient due to factors including less indexing, limited analyst coverage, and low liquidity. We love the notion that this part of the stock market has very low correlation to the rest of the robotic world of index investing. We also like that if you are right in your stock picking, many opportunities in the microcap world afford asymmetric risk/return opportunities. I think it is fair to say after analyzing 180’s performance over the last three years, our correlation to the market is quite low. Our performance is highly dependent on the specific news and fundamentals relating to a highly concentrated portfolio of 7 to 10 stocks rather than a diversified basket of 100+ names.
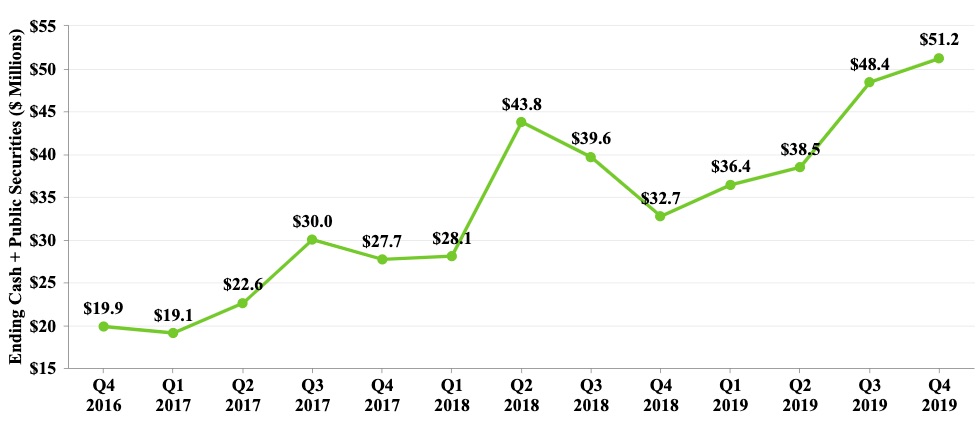
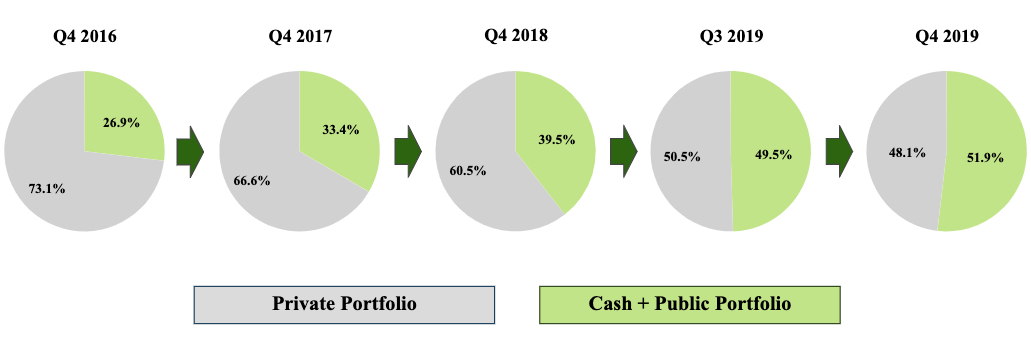
Our new company is now three years in the making. Our stated goal is that one day, every dollar we manage will be either in the form of cash or in public securities. As you can see from the two charts below, we have made considerable progress on that front, and in fact, for the first-time, our cash and our public securities represent more than half of our total assets. We have taken the liquid portion of our balance sheet from $19.9 million to $51.2 million.
While we would love to monetize our private holdings at a faster rate, we will absolutely not sell them for the sake of selling them. We will sell them only when we believe such sale makes sense for shareholders. In the meantime, we will continue to manage 180 in the way that we believe will maximize shareholder returns, specifically through small cap public company constructive activism.
NET ASSET VALUE PER SHARE
Our NAV increased this quarter from $3.05 to $3.06. Our Fund has three principal components to the variance in our NAV: our public portfolio, our private portfolio, and our expenses. For the quarter, our public portfolio companies increased our NAV by $0.13, while our private portfolio companies reduced NAV by $0.06. Operating expenses, including 2019 bonuses, decreased NAV by $0.06. If there ever was a need to repeat why Harris & Harris Group needed to become something else other than a venture capital fund, this was a good quarter and year to reiterate that notion.
| | | | | | | | | | | | |
| Quarter | 1 Year | | 3 Year |
| Q4 2019 | 2019 | | Q4 2016-Q4 2019 |
| | | | |
| | | | |
| TURN Change in NAV | 0.3% | | 15.9% | | | 30.8% | |
| | | | | | | |
| Russell Microcap Index | 13.4% | | 22.4% | | | 20.5% | |
| Russell Microcap Value Index | 10.4% | | 21.1% | | | 19.1% | |
| Russell 2000 | 9.9% | | 25.5% | | | 28.0% | |
Public Portfolio
Fortunately, since the inception of 180, our focus on investing in publicly traded companies with our constructive activist approach has generated significant returns. This quarter, 180’s public portfolio gross total return was 7.7% versus the 13.4% for the Russell Microcap Index. Our fourth quarter, one-year and three-year performance is highlighted in the chart below.1 All in all, I would characterize our performance as substandard for this past quarter, but exceptional for the year and for the three years of our existence.
| | | | | | | | | | | | |
| Quarter | 1 Year | | 3 Year |
| Q4 2019 | 2019 | | Q4 2016-Q4 2019 |
TURN Public Portfolio
Gross Total Return | 7.7% | | 70.8% | | | 210.0% | |
| | | | |
| | | | |
| | | | |
| Russell Microcap Index | 13.4% | | 22.4% | | | 20.5% | |
| Russell Microcap Value Index | 10.4% | | 21.1% | | | 19.1% | |
| Russell 2000 | 9.9% | | 25.5% | | | 28.0% | |
1 Past performance shown in the tables above and throughout this letter is not an indication or guarantee of future performance. Amounts gross unrealized and realized total returns compounded on a quarterly basis. 180 is an internally managed registered closed end fund and does not have an external manager that is paid fees based on assets and/or returns. 180 also has approximately 48 percent of its investment portfolio in legacy privately held investments. Please see 180's filings with the SEC, including its 2019 Annual Report filed on Form N-CSR for information on its expenses and expense ratios.
Almost three years ago, we embarked on a new strategy to invest in small public companies. Since then, we have increased our NAV by $1.18 from our investments in public companies. Over that same period, our private portfolio decreased our NAV by $0.06. At the risk of repeating myself, 180’s shareholders have greatly benefited from our strategy change. Let’s dig into the significant sources of the changes in value in our public portfolio in Q4 2019.
Sources of material increases in value:
•Quantum Corporation (NASDAQ:QMCO) completed the restatement of its financial statements and is now up to date with all of its filings with the SEC. This milestone allowed the company to publicly discuss everything the new management team has been working on over the past two years to clean up the organization and set it up for future growth. It also enabled QMCO’s management to communicate an important message: tape is not a melting ice cube. In fact, tape is experiencing a resurgence due to the desire for hyperscale cloud computing providers to incorporate low-use, ultra-low-cost data storage options into their product offerings. Tape also has the advantage that data stored on it is impervious to hacking while not in use. The company announced expected EBITDA for its fiscal year 2020 of $50-55 million, or a 55-70% increase from the prior year. Immediately following this announcement, the stock rallied from $3.69 to $5.00 and ended Q3 2019 at $5.70. The stock continued to move higher in Q4 2019 and closed at $7.42 at year end as more and more investors are taking notice of QMCO’s phoenix-like rise from the ashes. Our average cost is $2.62 per share. We sold approximately 10% of our position in QMCO during the quarter at an average price per share of $6.26. For the quarter, QMCO increased our NAV by $0.10.
Through the first part of Q1 2020, we sold an additional 284,100 shares at an average price per share of $7.50. With QMCO’s stock price decline to about $5.30 in the last month as a result of softer than expected guidance for the March 2020 quarter, we are inclined to reverse ourselves and buy the stock given our current belief in the long-term growth story for the company.
•Mersana Therapeutics, Inc. (NASDAQ:MRSN) added $0.04 to our NAV as the stock rallied from $1.58 to $5.73 during the quarter. We believe anticipation for Q1 2020 updates on on-going clinical trials drove the share price higher. We sold 201,100 shares during the quarter at an average price per share of $5.81. We sold our remaining 100,000 shares in Q1 2020 at an average price per share of $7.35.
Sources of material decreases in value:
•TheMaven, Inc. (OTC:MVEN) completed the acquisition of TheStreet, Inc. in August 2019, and the digital rights to Sports Illustrated in Fall 2019. MVEN continues to work on the integration of both acquisitions. On October 7, 2019, MVEN raised $15 million in capital from existing and new investors in conjunction with conversion of $5 million of its outstanding debt into preferred stock that will convert into common stock at $0.70 per share. We invested $1 million in this round of financing. Our initial investment in preferred stock purchased in June 2019 converts into common stock at $0.50 per share. MVEN is a media coalition of professional content destinations, operating exclusively on a shared digital publishing, advertising, and distribution platform. MVEN provides a major media scale alternative to news and information on social platforms. The high-scale, unified platform offers operating leverage to all participants in MVEN’s ecosystem by eliminating all non-content operating expenses. MVEN’s distributed operating leverage enables its entire suite of services to be provided on a revenue share basis, which creates lower, non-fixed operating costs than if a media company was forced to run its own platform and digital ad sales team. MVEN provides distribution across 100+ million monthly users in a single platform, allowing advertisers to be more successful with return on investments in marketing. As of now, MVEN is essentially a $160 million revenue startup. MVEN currently trades over the counter. MVEN is in the process of completing its financial statements so they can be up to date with all filings with the SEC. It is our expectation that after getting up to date with all filings sometime this year, MVEN will up-list to a national stock exchange. Although there were no material negative developments this quarter, the stock decreased 5.9%, resulting in a $0.02 reduction in our NAV.
Other notable positions:
•Synacor, Inc. (NASDAQ:SYNC) is a holding we have discussed extensively in our previous communications with shareholders. As you know, we joined SYNC’s Board of Directors in March 2019. While SYNC’s third quarter report was generally better than expected, the loss of AT&T as a customer continued to be an overhang on its share price. SYNC completed a reduction in staff in an effort to right size its business without AT&T. SYNC’s focus is now the growth of its software business. For the quarter, SYNC increased NAV by $0.01.
In February 2020, SYNC announced the signing of an agreement for the company to merge with Qumu Corporation (NASDAQ:QUMU), an enterprise video service platform delivering live and on demand corporate video. According to SYNC, the combined company is expected to have over $120 million in annual revenue on a pro forma basis. This will include an estimated $70 million in software revenue, about 70% of which is recurring. SYNC stated that the deal is expected to be accretive on both an adjusted EBITDA and adjusted EPS basis in the first fiscal year after close with expected annualized operational synergies of $4-5 million and excluding purchase accounting adjustments. SYNC noted that, upon closing of the deal with QUMU, SYNC stockholders are expected to own approximately 64.4% and QUMU shareholders are expected to own approximately 35.6% of the stock of the combined company. After closing, the combined business will trade on the Nasdaq under the ticker “SYNC”. SYNC further noted that this transaction has been unanimously approved by the Boards of Directors of both companies and is expected to close mid-2020, subject to obtaining required approval from the stockholders of both SYNC and QUMU, and satisfaction of other customary closing conditions.
•Lantronix, Inc. (NASDAQ: LTRX) announced the acquisition of Intrinsyc Technologies Corp, a company that provides product development and edge computing modules. LTRX also reported September 2019 results, that were viewed favorably. LTRX increased 6% and increased NAV by $0.01.
Also in Q4 2019, we entered into a subscription agreement with B. Riley Principal Merger Corp. (“BRPM”), a blank check corporation, to invest $4 million in conjunction with BRPM’s merger with Alta Equipment Holdings, Inc. (“ALTG”), a provider of premium materials handling equipment, construction equipment, cranes, warehouse solutions, power generation equipment, and contractors’ rental equipment. Alta operates a branch network of locations in the US Midwest and Northeast that offers its customers a one-stop-shop for most of their equipment needs by providing sales, parts, service, and rental functions under one roof. The merger closed on February 14, 2020, with more than 89 percent, or approximately $128 million, of the capital initially invested in BRPM remaining in the entity to support the transaction. 180’s $4 million investment purchased 421,053 shares of ALTG’s common stock, as well as warrants for the purchase of an additional 150,000 shares of ALTG’s common stock at a strike price of $11.50. Alta’s common stock and warrants trade on the NYSE under the symbols ALTG and ALTGW, respectively.
Alta is headquartered in Livonia, Michigan, and began as a family owned business that was founded on the sale and service of forklifts. In 2008, the company’s current Chief Executive Officer, Ryan Greenawalt, rejoined the company after working in the financial services industry. Since returning to the company, Mr. Greenawalt has successfully completed and integrated 16 acquisitions that have expanded the company’s addressable markets from primarily forklifts to other industrial and construction equipment. These acquisitions also expanded the geographic reach from primarily Michigan to other states in the Midwest and in the Northeast. Along with organic growth of its existing business, consolidation is a core piece of Alta’s strategy to grow the company. Alta has established itself as a reliable partner for the original equipment manufacturers (OEMs) that supply the equipment and parts Alta sells to its customers, which has led Alta to become a partner of choice for consolidation of dealerships. Two acquisitions closed simultaneous with the merger with BRPM that expanded the company’s reach into New York, Vermont and Florida.
ALTG estimated its revenues in 2019 will be approximately $645 million including revenues generated by NITCO, which the company acquired that year. Through organic growth and the acquisitions completed at the time of the merger, ALTG estimates revenues for 2020 will be approximately $1.1 billion, with approximately $390 million of these revenues generated by the acquired companies that coincided with the merger with BRPM. At this level of revenues, ALTG estimates it will generate $121 million of adjusted EBITDA and $39.9 million of levered free cash flow. Our cost basis per share of $9.50 equates to an entry valuation of approximately 5.4x adjusted EBITDA. We believe ALTG’s valuation is low with the potential for significant upside from both EBITDA growth and multiple expansion, particularly since ALTG generates positive levered free cash flow.
We are excited to be shareholders of ALTG and look forward to being a part of the company’s growth as a newly listed public company.
Private Portfolio
Now to the bad news. For the quarter, our private portfolio declined by approximately $1.8 million or $0.06 per share. Nanosys had the largest decrease in value (-$0.05/share) due to business-related factors, followed by a decrease in value in ORIG3N (-$0.02/share) also due to business-related factors. We had a decrease in value in D-Wave Systems (-$0.01/share) due to financing-related factors. The largest increases in value were AgBiome (+$0.01/share) and Petra Pharma (+$0.01/share), both as a result of financing-related factors.
While we continue to believe there are companies in the portfolio that hold promise to build value, the timelines and potential exit values for these companies are highly uncertain. We have often talked about our desire to shepherd our existing private portfolio to exits or explore opportunities to sell our positions in those companies. This year, our public holdings added $0.72 to our NAV while our private portfolio caused our NAV to decline by $0.13. In the last three years, our public portfolio has increased our NAV by $1.18 while our private portfolio has decreased our NAV by $0.06.
The pace at which we are able to monetize investments in our private portfolio has been disappointing. I am often asked the question, “Why aren’t you selling your private portfolio faster?” To be clear, our ability to force liquidity events is very limited since we don’t own controlling stakes in any of our private holdings. We also do not need to sell our private holdings in a fire sale to fund our operations. The success of our public investing strategy has led to the improvement of our balance sheet, which had $51.2 million or $1.65 per share in cash and public securities as of year-end. We have the luxury of being able to sell our private holdings when we believe it makes sense for shareholders rather than being forced to do so to survive.
EXPENSES
As we have noted in previous letters, we have dramatically reduced our cost structure under our new strategy. In 2016, before our Fund’s change in investment focus and management team, our operating expenses, excluding stock-based compensation and interest on outstanding debt, averaged approximately $1.3 million per quarter. For Q4 2019, our operating expenses net of sublease income equaled approximately $939,000, including a non-cash expense of approximately $130,000 for our legacy medical benefit retirement obligations, due to a lower discount rate in 2019 versus 2018. In Q4 2018, we had a non-cash benefit of approximately $180,000.
Based on the overall positive results for the entirety of 2019, the Compensation Committee of our Board of Directors voted to accrue an additional $977,000 in the fourth quarter of 2019 for bonuses for 180 employees. As a reminder, the bonus pool includes the deferral of one-third of the full amount for payment in future years only if our individual and corporate performance is persistent. We note that in 2018, despite the increase in our NAV and our public stock picking performance outpacing the RMICRO (+19.5% for 180 vs. -13.0% for RMICRO), we recommended a bonus pool of $0.
To show alignment with our shareholders, it is noteworthy to mention that I have invested 73% of my total 2016-2018 compensation in TURN stock through open-market purchases. On an after-tax basis, the amount would be greater than 100%. In total, the board and management team own 4.9% of TURN. We are aligned with our shareholders.
TURN/NAV: SUM OF THE PARTS
As of the end of Q4 2019, TURN traded at 70% of its NAV. Our public securities, cash, and other assets net of liabilities were $1.53 per share. Our stock price was $2.15. If we received 100% credit for the value of these assets net of liabilities, the market is ascribing a value of approximately $0.62 per share, or $19.3 million, to our private portfolio. Given our private assets are valued at approximately $47.6 million, the market is discounting the value of our private portfolio assets by 59.5% as of the end of Q4 2019. As we grow our cash and liquid securities, the discount our stock trades to NAV should narrow. At the beginning of our strategy in 2017, we had 27% of our cash and total investments in cash and public securities, and we were trading at a 41% discount to NAV. At the end of Q4 2019, we had 51.9% of our cash and total investments in cash and public securities, and we traded at a 30% discount to NAV. We’re making progress, but there is more work to be done.
In three short years, we have created an exciting new business for our shareholders. In 2019, our 70.8% performance for our public holdings is yet another strong indicator that constructive activism, coupled with a rigid Graham and Dodd value approach to investing, can lead to terrific investment performance. I stare at our stock price all day, every day. Over our tenure, TURN’s share price increased 55.8%, while RMICRO is up only 20.5%. The large cap growth-dominated S&P 500 is up 53.1% largely driven by the FAANG group of companies. You have a belief in our strategy, and I am truly appreciative of your support. I think by now you can tell I am a big believer in transparency. Every day we come to work, we make decisions designed to benefit all of us as shareholders. The market has come a very long way since the economic disaster of 2008. Today, the economy is performing quite well, inflation remains in check, and unemployment is at generational lows. That said, we will have election year volatility to navigate, and early on, we are already dealing with supply chain disruptions due to the Coronavirus. I would expect volatility to increase as the year unfolds. Let’s remember that in March 2009, the S&P 500 bottomed at an intra-day low of 667. Today it sits north of 3200. There is a lot of good news built into this market. We keep that in mind every time we look at new companies and the holdings that make up our existing portfolio.
Finally, it is with appreciation, and a bit of sadness, that Chuck Ramsey, an esteemed member of our Board of Directors has notified us that he will not stand for re-election at our upcoming annual meeting of shareholders. I have had the privilege of working alongside Chuck both as an independent director and now, given my position as CEO, as my “boss”. Chuck has served as a member of our Board since October 2002. Since 1997, he has been a consultant in the area of human resources and venture capital. He is a retired founder and principal of Ramsey/Beirne Associates, Inc., an executive search firm that specialized in recruiting top officers for high-technology companies, many of which were backed by venture capital. Chuck has been the consummate professional and has really helped us think through best practices as it relates to building corporate organizational structures. Chuck has been in the “people business” his entire career, and he is on the short list of some of the best “people” I have ever come across. On behalf of 180, I want to thank Chuck for all he has done for the remaking of our business (including recruiting me!), and we wish him the very best as time moves forward. We will look to add a new member who has skillsets that can aid us in our world of small cap activist investing.
Thank you for your continued support.
Kevin Rendino
Chairman and Chief Executive Officer
| | |
180 DEGREE CAPITAL CORP.
CONSOLIDATED STATEMENT OF ASSETS AND LIABILITIES |
| | | | | |
| | December 31, 2019 |
| ASSETS | |
| Investments in portfolio securities, at value: | |
| Unaffiliated privately held companies (cost: $18,824,682) | $ | 29,511,039 | |
| Unaffiliated publicly traded securities (cost: $20,293,527) | 26,987,359 | |
| Non-controlled affiliated privately held companies (cost: $34,096,785) | 16,059,450 | |
| Non-controlled affiliated publicly traded securities (cost: $12,362,473) | 12,685,690 | |
| Equity method privately held company (adjusted cost basis: $203,677) | 203,677 | |
| Unaffiliated rights to payments (adjusted cost basis: $570,216) | 1,795,316 | |
| Cash | 11,328,490 | |
| Restricted cash | 46,151 | |
| Receivable from sales of securities | 559,233 | |
| Receivable from portfolio companies and managed funds | 244,799 | |
| Prepaid expenses | 267,953 | |
| Other receivables | 66,840 | |
| Interest receivable | 4,142 | |
| Other assets | 27,258 | |
| Total assets | $ | 99,787,397 | |
| LIABILITIES & NET ASSETS | |
| |
| Bonus payable (Note 7) | $ | 2,581,285 | |
| Post-retirement plan liabilities | 1,257,204 | |
| Accounts payable and accrued liabilities | 378,656 | |
| Payable for securities purchased | 356,613 | |
| Total liabilities | $ | 4,573,758 | |
| Commitments and contingencies (Note 10) | |
| Net assets | $ | 95,213,639 | |
| Net assets are comprised of: | |
| Preferred stock, $0.10 par value, 2,000,000 shares authorized; none issued | $ | 0 | |
Common stock, $0.01 par value, 45,000,000 shares authorized; 34,623,341 issued | 334,594 | |
| Additional paid in capital | 122,785,067 | |
| Total accumulated distributable loss | (23,300,497) | |
Treasury stock, at cost 3,501,779 shares | (4,605,525) | |
| Net assets | $ | 95,213,639 | |
| Shares outstanding | 31,121,562 | |
| Net asset value per outstanding share | $ | 3.06 | |
The accompanying notes are an integral part of these consolidated financial statements.
8
| | |
180 DEGREE CAPITAL CORP.
CONSOLIDATED STATEMENT OF OPERATIONS |
| | | | | |
| Year Ended
December 31, 2019 |
| Income: | |
| Interest from: | |
| Unaffiliated companies-cash | $ | 1,585 | |
| Unaffiliated companies-PIK | 51,066 | |
| Non-controlled affiliated companies-cash (Note 2) | (654,764) | |
| Non-controlled affiliated companies-PIK | 10,000 | |
| Cash and U.S. government securities | 33,071 | |
| Carried interest | 633,533 | |
| Sub-lease income | 248,666 | |
| Yield enhancing fee income on debt securities-non-cash | 210,086 | |
| Fee income for providing managerial assistance to portfolio companies-cash | 89,239 | |
| Fee income for providing managerial assistance to portfolio companies-non-cash | 86,962 | |
| Other income (Note 2) | 106,592 | |
| Other income-non-cash | 1,607 | |
| Management fee income | 55,279 | |
| Dividend income | 24,967 | |
| Total income | 897,889 | |
| Operating fees and expenses: | |
| Salaries, bonus and benefits | 4,129,718 | |
| Professional | 555,451 | |
| Directors | 277,500 | |
| Rent | 229,029 | |
| Administration and operations | 270,017 | |
| Insurance | 231,350 | |
| Custody | 30,063 | |
| Other | 5,215 | |
| Total operating expenses | 5,728,343 | |
| Net investment loss before income tax expense | (4,830,454) | |
| Income tax expense | 1,267 | |
| Net investment loss | (4,831,721) | |
| Net realized (loss) gain from investments: | |
| Unaffiliated privately held companies | (16,960) | |
| Unaffiliated publicly traded securities | 4,600,956 | |
| Non-controlled affiliated privately held companies | (1,783,381) | |
| Non-controlled affiliated publicly traded securities | 6,715,341 | |
| Controlled affiliated privately held companies | 12,104 | |
| Put options | 114,202 | |
| Net realized gain from investments | 9,642,262 | |
| Change in unrealized (depreciation) appreciation on investments: | |
| Unaffiliated privately held companies | (1,529,173) | |
| Unaffiliated publicly traded securities | 12,314,443 | |
| Non-controlled affiliated privately held companies | 264,012 | |
| Non-controlled affiliated publicly traded securities | (2,393,215) | |
| Unaffiliated rights to payments | (245,185) | |
| Net change in unrealized appreciation on investments | 8,410,882 | |
| Net realized gain from investments and change in unrealized appreciation on investments | 18,053,144 | |
| Share of loss on equity method investment | (42,552) | |
| Net increase in net assets resulting from operations | $ | 13,178,871 | |
The accompanying notes are an integral part of these consolidated financial statements.
9
| | |
180 DEGREE CAPITAL CORP.
CONSOLIDATED STATEMENT OF CASH FLOWS |
| | | | | |
| Year Ended
December 31, 2019 |
| Cash flows provided by operating activities: | |
| Net increase in net assets resulting from operations | $ | 13,178,871 | |
Adjustments to reconcile net increase in net assets resulting from operations to net cash provided by operating activities: | |
| Net realized gain from investments | (9,642,262) | |
Net change in unrealized appreciation on investments | (8,410,882) | |
| Share of loss on equity method investee | 42,552 | |
Depreciation of fixed assets | 5,169 | |
| Accretion of bridge note PIK interest income | (61,066) | |
| Yield enhancing fee income on debt securities-non-cash | (210,086) | |
| Fee income for providing managerial assistance to portfolio companies-non-cash | (86,962) | |
| Other income-non-cash | (1,607) | |
| Purchase of U.S. government securities | (21,467,190) | |
| Maturity of U.S. government securities | 21,467,190 | |
| Put options purchased | (720,543) | |
| Written put options terminated in closing transactions | (662,408) | |
| Put options written | 467,452 | |
| Purchased put options terminated in closing transactions | 1,029,701 | |
| Purchase of unaffiliated privately held portfolio companies | (734,523) | |
| Purchase of unaffiliated publicly traded securities | (20,075,026) | |
| Purchase of non-controlled affiliated privately held portfolio companies | (100,000) | |
| Purchase of non-controlled affiliated publicly traded securities | (8,033,947) | |
| Distributions from non-controlled affiliated publicly traded securities | 11,382,439 | |
| Proceeds from sale of unaffiliated privately held companies | 255,000 | |
| Proceeds from sale of unaffiliated publicly traded securities | 20,063,176 | |
| Liquidating distributions from non-controlled affiliated privately held companies | 54,554 | |
| Proceeds from sale of non-controlled affiliated publicly traded securities | 3,235,135 | |
| Liquidating distributions from controlled affiliated privately held companies | 12,104 | |
| Changes in assets and liabilities: | |
| Decrease in interest receivable | 657,535 | |
| Increase in receivable from sales of securities | (559,233) | |
| Increase in receivable from portfolio companies and managed funds | (138,137) | |
| Increase in prepaid expenses | (8,594) | |
| Increase in other receivables | (66,840) | |
| Decrease in other assets | 103,833 | |
| Increase in bonus payable | 2,241,957 | |
| Increase in post-retirement plan liabilities | 116,798 | |
| Decrease in accounts payable and accrued liabilities | (14,340) | |
| Increase in payable for securities purchased | 264,242 | |
| Decrease in deferred rent | (53,185) | |
| Net cash provided by operating activities | 3,530,877 | |
| Cash flows from investing activities: | |
| Purchase of fixed assets | (4,099) | |
| Net cash used in investing activities | (4,099) | |
| |
The accompanying notes are an integral part of these consolidated financial statements.
10
| | | | | |
| |
180 DEGREE CAPITAL CORP.
CONSOLIDATED STATEMENT OF CASH FLOWS (CONTINUED) | |
| |
| Year Ended
December 31, 2019 |
| Net increase in cash and restricted cash | $ | 3,526,778 | |
| Cash and restricted cash at beginning of the year | 7,847,863 | |
| Cash and restricted cash at end of the year | $ | 11,374,641 | |
| Supplemental disclosures of cash flow information: | |
| Income taxes paid | $ | 1,267 | |
| |
| Cash | $ | 11,328,490 | |
| Restricted cash | 46,151 | |
| Total cash and restricted cash shown in the consolidated statement of cash flows | $ | 11,374,641 | |
The accompanying notes are an integral part of these consolidated financial statements.
11
| | |
180 DEGREE CAPITAL CORP.
CONSOLIDATED STATEMENTS OF CHANGES IN NET ASSETS |
| | | | | | | | | | | |
| Year Ended
December 31, 2019 | | Year Ended December 31, 2018 |
| | | |
| Changes in net assets from operations: | | | |
| Net investment loss | $ | (4,831,721) | | | $ | (2,386,019) | |
| Net realized gain (loss) | 9,642,262 | | | (7,693,523) | |
Net change in unrealized appreciation on investments | 8,410,882 | | | 11,195,620 | |
| Share of loss on equity method investment | (42,552) | | | (124,299) | |
| Net increase in net assets resulting from operations | 13,178,871 | | | 991,779 | |
| Net increase in net assets | 13,178,871 | | | 991,779 | |
| Net Assets: | | | |
| Beginning of the year | 82,034,768 | | | 81,042,989 | |
| End of the year | $ | 95,213,639 | | | $ | 82,034,768 | |
| | | |
The accompanying notes are an integral part of these consolidated financial statements.
12
| | |
180 DEGREE CAPITAL CORP.
CONSOLIDATED FINANCIAL HIGHLIGHTS |
| | | | | | | | | | | | | | | | | | | | | | | | | | | | | |
| Year Ended
Dec. 31, 2019 | | Year Ended
Dec. 31, 2018 | | Year Ended
Dec. 31, 2017 | | Year Ended
Dec. 31, 2016 | | Year Ended
Dec. 31, 2015 |
| | | | | | | | | |
| Per Share Operating Performance: | | | | | | | | | |
| Net asset value per share, beginning of the year | $ | 2.64 | | | $ | 2.60 | | | $ | 2.34 | | | $ | 2.88 | | | $ | 3.51 | |
Net investment loss* | (0.16) | | | (0.07) | | | (0.12) | | | (0.15) | | | (0.23) | |
Net realized gain (loss) from investments* | 0.31 | | | (0.25) | | | (0.38) | | | (0.26) | | | 0.15 | |
Net change in unrealized appreciation (depreciation) on investments and options*1 | 0.27 | | | 0.36 | | | 0.80 | | | (0.12) | | | (0.56) | |
Share of loss on equity method investment*2 | 0.00 | | | 0.00 | | | 0.00 | | | 0.00 | | | (0.01) | |
| Total* | 0.42 | | | 0.04 | | | 0.30 | | | (0.53) | | | (0.65) | |
Net (decrease) increase as a result of stock-based compensation expense*2 | 0.00 | | | 0.00 | | | (0.01) | | | 0.01 | | | 0.03 | |
Net increase as a result of purchase of treasury stock | 0.00 | | | 0.00 | | | 0.00 | | | 0.00 | | | 0.01 | |
Net decrease as a result of acquisition of vested restricted stock awards related to employee withholding2 | 0.00 | | | 0.00 | | | (0.02) | | | (0.01) | | | (0.01) | |
| Total (decrease) increase from capital stock transactions | 0.00 | | | 0.00 | | | (0.03) | | | 0.00 | | | 0.03 | |
Net (decrease) increase as a result of other comprehensive (loss) income*2 | 0.00 | | | 0.00 | | | (0.01) | | | (0.01) | | | (0.01) | |
| Net increase (decrease) in net asset value | 0.42 | | | 0.04 | | | 0.26 | | | (0.54) | | | (0.63) | |
| Net asset value per share, end of the year | $ | 3.06 | | | $ | 2.64 | | | $ | 2.60 | | | $ | 2.34 | | | $ | 2.88 | |
| Stock price per share, end of the year | $ | 2.15 | | | $ | 1.75 | | | $ | 1.97 | | | $ | 1.38 | | | $ | 2.20 | |
| Total return based on stock price | 22.86 | % | | (11.17) | % | | 42.75 | % | | (37.27) | % | | (25.42) | % |
| Supplemental Data: | | | | | | | | | |
| Net assets, end of the year | $ | 95,213,639 | | | $ | 82,034,768 | | | $ | 81,042,989 | | | $ | 72,255,610 | | | $ | 88,711,671 | |
Ratio of expenses, excluding taxes, to quarterly average net assets | 6.42 | % | ** | 3.62 | % | ** | 6.26 | % | ** | 7.88 | % | | 8.15 | % |
Ratio of expenses, including taxes, to quarterly average net assets | 6.42 | % | ** | 3.63 | % | ** | 6.28 | % | 3 ** | 7.89 | % | | 8.15 | % |
Ratio of net investment loss to quarterly average net assets | (5.42) | % | | (2.82) | % | | (4.68) | % | | (5.64) | % | | (7.22) | % |
| Average debt outstanding | $ | 0 | | | $ | 0 | | | $ | 0 | | | $ | 4,590,164 | | | $ | 3,780,822 | |
| Average debt per share | $ | 0.00 | | | $ | 0.00 | | | $ | 0.00 | | | $ | 0.15 | | | $ | 0.12 | |
| Portfolio turnover | 30.17 | % | | 20.43 | % | | 8.83 | % | | *** | | *** |
Number of shares outstanding, end of the year | 31,121,562 | | | 31,121,562 | | | 31,121,562 | | | 30,904,209 | | | 30,845,754 | |
*Based on average shares outstanding.
**The Company has entered into an expense offsetting arrangement with one of its unaffiliated brokers relating to broker fees paid. The total broker fee charged to the Company was applied as a credit to fees charged by an affiliate of the unaffiliated broker who the Company subscribes to for data services billed during the year. The Company received an offset to expense totaling approximately $17,509 and $5,700 with that broker for the years ended December 31, 2018 and December 31, 2017, respectively. The Company received an offset to expense totaling approximately $15,679 with that broker for the year ended December 31, 2019.
***Prior to March 2017, the Company was a business development company investing primarily in privately held securities. Portfolio turnover was not a relevant indicator for such investments given that the Company did not generally pay brokerage fees on such investments.
1 Net unrealized losses include rounding adjustments to reconcile change in net asset value per share.
2 Amounts listed as zero are amounts calculated as less than $0.005.
3 Ratio of expenses, including taxes and excluding expenses related to restructuring, to quarterly average net assets for the year ended December 31, 2017 was 5.19%.
The accompanying notes are an integral part of these consolidated financial statements.
13
| | | | | | | | | | | | | | | | | | | | | | | | | | | | | |
| 180 DEGREE CAPITAL CORP. CONSOLIDATED SCHEDULE OF INVESTMENTS AS OF DECEMBER 31, 2019 | | | | | | | | | |
| | | | | | | | | |
| Method of
Valuation (1) | | Industry | | Shares/Principal | | Cost | | Value |
| | | | | | | | | | | | | | | | | | | | | | | | | | | | | |
| Investments in Unaffiliated Companies (2) - | | | | | | | | | |
| 59.3% of net assets at value | | | | | | | | | |
| | | | | | | | | |
| Privately Held Companies (Illiquid) - | | | | | | | | | |
| 31.0% of net assets at value | | | | | | | | | |
| | | | | | | | | |
| AgBiome, LLC (3)(4) | | | Fertilizers & Agricultural Chemicals | | | | | | |
| Providing early-stage research and discovery for agriculture and utilizing the crop microbiome to identify products that reduce risk and improve yield | | | | | | | | | |
| Series A-1 Convertible Preferred Units (acquired 1/30/13) | (I) (L3) | | | | 2,000,000 | | | $ | 2,000,000 | | | | $ | 11,967,110 | |
| Series A-2 Convertible Preferred Units (acquired 4/9/13-10/15/13) | (I) (L3) | | | | 417,392 | | | 521,740 | | | | 2,536,688 | |
| Series B Convertible Preferred Units (acquired 8/7/15) | (I) (L3) | | | | 160,526 | | | 500,006 | | | | 1,088,016 | |
| | | | | | | 3,021,746 | | | | 15,591,814 | |
| | | | | | | | | |
| AutoTech Ventures Management I, LLC (3)(4)(5) | | | Asset Management & Custody Banks | | | | | | |
| Venture capital investing in automotive-related companies | | | | | | | | | |
| LLC Interests (acquired 12/1/17) | (M) (L3) | | | | 0 | | | 0 | | | | 147,330 | |
| | | | | | | | | |
| D-Wave Systems, Inc. (3)(4)(6) | | | Technology Hardware, Storage & Peripherals | | | | | | |
| Developing high-performance quantum computing systems | | | | | | | | | |
| Series 1 Class B Convertible Preferred Stock (acquired 9/30/08) | (M) (L3) | | | | 1,144,869.00 | | | 1,002,074 | | | | 1,604,156 | |
| Series 1 Class C Convertible Preferred Stock (acquired 9/30/08) | (M) (L3) | | | | 450,450.00 | | | 487,804 | | | | 644,450 | |
| Series 1 Class D Convertible Preferred Stock (acquired 9/30/08) | (M) (L3) | | | | 855,131.00 | | | 748,473 | | | | 1,223,419 | |
| Series 1 Class E Convertible Preferred Stock (acquired 11/24/10) | (M) (L3) | | | | 269,280.00 | | | 248,049 | | | | 401,869 | |
| Series 1 Class F Convertible Preferred Stock (acquired 11/24/10) | (M) (L3) | | | | 258,721.00 | | | 238,323 | | | | 386,111 | |
| Series 1 Class H Convertible Preferred Stock (acquired 6/27/14) | (M) (L3) | | | | 460,866.00 | | | 909,088 | | | | 935,062 | |
| Series 2 Class D Convertible Preferred Stock (acquired 9/30/08) | (M) (L3) | | | | 678,264.00 | | | 736,019 | | | | 970,379 | |
| Series 2 Class E Convertible Preferred Stock (acquired 6/1/12-3/22/13) | (M) (L3) | | | | 513,900.00 | | | 659,493 | | | | 802,780 | |
| Series 2 Class F Convertible Preferred Stock (acquired 6/1/12-3/22/13) | (M) (L3) | | | | 493,747.00 | | | 633,631 | | | | 771,298 | |
| | | | | | | 5,662,954 | | | | 7,739,524 | |
| | | | | | | | | |
The accompanying notes are an integral part of these consolidated financial statements.
14
| | | | | | | | | | | | | | | | | | | | | | | | | | | | | |
| 180 DEGREE CAPITAL CORP. CONSOLIDATED SCHEDULE OF INVESTMENTS AS OF DECEMBER 31, 2019 | | | | | | | | | |
| | | | | | | | | |
| Method of
Valuation (1) | | Industry | | Shares/Principal | | Cost | | Value |
| | | | | | | | | | | | | | | | | | | | | | | | | | | | | |
| Investments in Unaffiliated Companies (2) - | | | | | | | | | |
| 59.3% of net assets at value (cont.) | | | | | | | | | |
| | | | | | | | | |
| Privately Held Companies (Illiquid) - | | | | | | | | | |
| 31.0% of net assets at value (cont.) | | | | | | | | | |
| | | | | | | | | |
| Fleet Health Alliance, LLC (3)(4) | | | Health Care Technology | | | | | | |
| Developing software for information transfer amongst healthcare providers and consumers | | | | | | | | | |
| Unsecured Convertible Bridge Note, 0%, (acquired 4/22/16, no maturity date) | (I) (L3) | | | | $ | 225,000 | | | $ | 225,000 | | | $ | 56,250 | |
| | | | | | | | | |
| Lodo Therapeutics Corporation (3) | | | Pharmaceuticals | | | | | | |
| Developing and commercializing novel therapeutics derived from a metagenome-based Natural Product Discovery Platform | | | | | | | | | |
| Series A Convertible Preferred Stock (acquired 12/21/15-4/22/16) | (I) (L3) | | | | 658,190 | | | | 658,190 | | | | 777,986 | |
| Secured Convertible Bridge Note, 6% PIK, (acquired 6/27/19, maturing 5/7/21) | (M) (L3) | | | | $ | 474,019 | | | | 488,668 | | | | 488,668 | |
| | | | | | | | | 1,146,858 | | | | 1,266,654 | |
| | | | | | | | | |
| Magnolia Neurosciences Corporation (3)(4) | | | Pharmaceuticals | | | | | | |
| Developing and commercializing novel therapeutics for treatment of neurodegeneration | | | | | | | | | |
| Series A Convertible Preferred Stock (acquired 8/3/18) | (I) (L3) | | | | 862,872 | | | | 862,872 | | | | 874,652 | |
| | | | | | | | | |
| Nanosys, Inc. (3)(4) | | | Specialty Chemicals | | | | | | |
| Developing inorganic nanowires and quantum dots for use in LED-backlit devices | | | | | | | | | |
| Series C Convertible Preferred Stock (acquired 4/10/03) | (M) (L3) | | | | 803,428 | | | | 1,500,000 | | | | 0 | |
| Series D Convertible Preferred Stock (acquired 11/7/05) | (M) (L3) | | | | 1,016,950 | | | | 3,000,003 | | | | 1,408,908 | |
| Series E Convertible Preferred Stock (acquired 8/13/10) | (M) (L3) | | | | 433,688 | | | | 496,573 | | | | 594,688 | |
| | | | | | | | | 4,996,576 | | | | 2,003,596 | |
| | | | | | | | | |
| NanoTerra, Inc. (3)(4) | | | Research & Consulting Services | | | | | | |
| Developing surface chemistry and nano-manufacturing solutions | | | | | | | | | |
| Warrants for Common Stock expiring on 2/22/21 (acquired 2/22/11) | (I) (L3) | | | | 4,462 | | | | 69,168 | | | | 0 | |
| Warrants for Series A-3 Preferred Stock expiring on 11/15/22 (acquired 11/15/12) | (I) (L3) | | | | 47,508 | | | | 35,403 | | | | 0 | |
| | | | | | | | | 104,571 | | | | 0 | |
| | | | | | | | | |
The accompanying notes are an integral part of these consolidated financial statements.
15
| | | | | | | | | | | | | | | | | | | | | | | | | | | | | |
| 180 DEGREE CAPITAL CORP. CONSOLIDATED SCHEDULE OF INVESTMENTS AS OF DECEMBER 31, 2019 | | | | | | | | | |
| | | | | | | | | |
| Method of
Valuation (1) | | Industry | | Shares/Principal | | Cost | | Value |
| | | | | | | | | | | | | | | | | | | | | | | | | | | | | |
| Investments in Unaffiliated Companies (2) - | | | | | | | | | |
| 59.3% of net assets at value (cont.) | | | | | | | | | |
| | | | | | | | | |
| Privately Held Companies (Illiquid) - | | | | | | | | | |
| 31.0% of net assets at value (cont.) | | | | | | | | | |
| | | | | | | | | |
| Petra Pharma Corporation (3) | | | Pharmaceuticals | | | | | | |
| Developing small molecule inhibitors for treatment of cancer and metabolic diseases | | | | | | | | | |
| Series A Convertible Preferred Stock (acquired 12/23/15-1/8/18) | (I) (L3) | | | | 1,894,798 | | | | $ | 1,894,798 | | | | $ | 1,118,799 | |
| Secured Convertible Bridge Note, 7% PIK, (acquired 8/30/18, maturing 2/29/20) | (M) (L3) | | | | $ | 369,748 | | | | 404,423 | | | | 202,212 | |
| Secured Convertible Bridge Note, 7% PIK, (acquired 4/11/19, maturing 2/29/20) | (M) (L3) | | | | $ | 116,601 | | | | 122,527 | | | | 61,263 | |
| Secured Convertible Bridge Note, 7% PIK, (acquired 7/18/19, maturing 2/29/20) | (M) (L3) | | | | $ | 143,903 | | | | 148,512 | | | | 74,256 | |
| | | | | | | | | 2,570,260 | | | | 1,456,530 | |
| | | | | | | | | |
| Phylagen, Inc. (3)(4) | | | Research & Consulting Services | | | | | | |
| Developing technology to improve human health and business productivity | | | | | | | | | |
| Series A Convertible Preferred Stock (acquired 11/14/18) | (M) (L3) | | | | 548,031 | | | | 233,845 | | | | 374,689 | |
| | | | | | | | | |
| Total Unaffiliated Privately Held Companies (cost: $18,824,682) | | | | | | | | | $ | 29,511,039 | |
| | | | | | | | | |
| Unaffiliated Publicly Traded Securities - | | | | | | | | | |
| 28.3% of net assets at value | | | | | | | | | |
| | | | | | | | | |
| Adesto Technologies Corporation (4) | | | Semiconductors | | | | | | |
| Developing low-power, high-performance solutions for the Internet of Things (IoT) | | | | | | | | | |
| Common Stock (acquired 10/27/15-10/4/19) | (M) (L1) | | | | 197,392 | | | | $ | 1,170,825 | | | | $ | 1,677,832 | |
| | | | | | | | | |
| Emcore Corporation (4) | | | Communications Equipment | | | | | | |
| Providing mixed-signal optical products | | | | | | | | | |
| Common Stock (acquired 5/3/18-3/29/19) | (M) (L1) | | | | 652,508 | | | | 3,011,886 | | | | 1,983,624 | |
| | | | | | | | | |
| Iteris, Inc. (4) | | | Electronic Equipment & Instruments | | | | | | |
| Providing applied informatics for transportation and agriculture | | | | | | | | | |
| Common Stock (acquired 1/18/19-11/11/19) | (M) (L1) | | | | 370,600 | | | | 1,620,153 | | | | 1,849,294 | |
| | | | | | | | | |
The accompanying notes are an integral part of these consolidated financial statements.
16
| | | | | | | | | | | | | | | | | | | | | | | | | | | | | |
| 180 DEGREE CAPITAL CORP. CONSOLIDATED SCHEDULE OF INVESTMENTS AS OF DECEMBER 31, 2019 | | | | | | | | | |
| | | | | | | | | |
| Method of
Valuation (1) | | Industry | | Shares/Principal | | Cost | | Value |
| | | | | | | | | | | | | | | | | | | | | | | | | | | | | |
| Investments in Unaffiliated Companies (2) - | | | | | | | | | |
| 59.3% of net assets at value (cont.) | | | | | | | | | |
| | | | | | | | | |
| Unaffiliated Publicly Traded Securities - | | | | | | | | | |
| 28.3% of net assets at value (cont.) | | | | | | | | | |
| | | | | | | | | |
| Lantronix, Inc. (4) | | | Communications Equipment | | | | | | |
| Providing secure data access and management solutions | | | | | | | | | |
| Common Stock (acquired 9/18/18-11/11/19) | (M) (L1) | | | | 952,042 | | | | $ | 3,246,096 | | | | $ | 3,379,749 | |
| | | | | | | | | | | | | | |
| Mersana Therapeutics, Inc. (4) | | | Biotechnology | | | | | | | | | | | |
| Developing antibody drug conjugates for cancer therapy | | | | | | | | | | | | | | |
| Common Stock (acquired 7/27/12-12/31/18) | (M) (L1) | | | | 100,000 | | | | 1,466,229 | | | | 573,000 | |
| | | | | | | | | | | | | | |
| OpGen, Inc. (4)(7) | | | Biotechnology | | | | | | | | | | | |
| Developing tools for genomic sequence assembly and analysis | | | | | | | | | | | | | | |
| Warrants for the Purchase of Common Stock expiring 5/8/20 (acquired 5/5/15) | (M) (L2) | | | | 602 | | | | 425,579 | | | | 4,150 | |
| Warrants for the Purchase of Common Stock expiring 2/17/25 (acquired 5/5/15) | (I) (L3) | | | | 62 | | | | 785 | | | | 3 | |
| | | | | | | | | 426,364 | | | | 4,153 | |
| | | | | | | | | | | | | | |
| Potbelly Corporation (4) | | | Restaurants | | | | | | | | | | | |
| Fast casual dining sandwich shops | | | | | | | | | | | | | | |
| Common Stock (acquired 6/24/19-12/31/19) | (M) (L1) | | | | 1,122,049 | | | | 4,835,101 | | | | 4,735,047 | |
| | | | | | | | | |
| Quantum Corporation (4) | | | Technology Hardware, Storage & Peripherals | | | | | | |
| Providing high-density data storage and high-speed data processing solutions | | | | | | | | | |
| Common Stock (acquired 2/4/19-6/25/19) | (M) (L1) | | | | 1,723,000 | | | 4,516,873 | | | 12,784,660 | |
| | | | | | | | | |
| | | | | | | | | |
| Total Unaffiliated Publicly Traded Securities (cost: $20,293,527) | | | | | | | | | $ | 26,987,359 | |
| | | | | | | | | |
| Total Investments in Unaffiliated Companies (cost: $39,118,209) | | | | | | | | | $ | 56,498,398 | |
| | | | | | | | | |
The accompanying notes are an integral part of these consolidated financial statements.
17
| | | | | | | | | | | | | | | | | | | | | | | | | | | | | |
| 180 DEGREE CAPITAL CORP. CONSOLIDATED SCHEDULE OF INVESTMENTS AS OF DECEMBER 31, 2019 | | | | | | | | | |
| | | | | | | | | |
| Method of
Valuation (1) | | Industry | | Shares/Principal | | Cost | | Value |
| | | | | | | | | | | | | | | | | | | | | | | | | | | | | |
| Investments in Non-Controlled Affiliated Companies (2) - | | | | | | | | | |
| 30.2% of net assets at value | | | | | | | | | |
| | | | | | | | | |
| Privately Held Companies (Illiquid) - | | | | | | | | | |
| 16.9% of net assets at value | | | | | | | | | |
| | | | | | | | | |
| ABSMaterials, Inc. (3) | | | Specialty Chemicals | | | | | | |
| Developing nano-structured absorbent materials for water remediation and consumer applications | | | | | | | | | |
| Series A Convertible Preferred Stock (acquired 2/17/10-10/24/11) | (I) (L3) | | | | 390,000 | | | | $ | 435,000 | | | | $ | 22,297 | |
| Series B Convertible Preferred Stock (acquired 11/8/13-6/25/14) | (I) (L3) | | | | 1,037,751 | | | | 1,217,644 | | | | 306,556 | |
| Secured Convertible Bridge Note, 8% PIK, (acquired 1/20/16, maturing 6/30/20) | (M) (L3) | | | | $ | 100,000 | | | | 131,605 | | | | 131,605 | |
| Secured Convertible Bridge Note, 8% PIK, (acquired 3/28/17, maturing 6/30/20) | (M) (L3) | | | | $ | 25,000 | | | | 30,529 | | | | 30,529 | |
| | | | | | | | | 1,814,778 | | | | 490,987 | |
| | | | | | | | | | | | | | |
| Black Silicon Holdings, Inc. (3)(4)(8)(9) | | | Semiconductors | | | | | | | | | | | |
| Holding company for interest in a company that develops silicon-based optoelectronic products | | | | | | | | | | | | | | |
| Series A Convertible Preferred Stock (acquired 8/4/15) | (M) (L3) | | | | 233,499 | | | | 750,000 | | | | 0 | |
| Series A-1 Convertible Preferred Stock (acquired 8/4/15) | (M) (L3) | | | | 2,966,667 | | | | 890,000 | | | | 0 | |
| Series A-2 Convertible Preferred Stock (acquired 8/4/15) | (M) (L3) | | | | 4,207,537 | | | | 2,445,000 | | | | 0 | |
| Series B-1 Convertible Preferred Stock (acquired 8/4/15) | (M) (L3) | | | | 1,892,836 | | | | 1,169,561 | | | | 0 | |
| Series C Convertible Preferred Stock (acquired 8/4/15) | (M) (L3) | | | | 1,674,030 | | | | 1,171,316 | | | | 0 | |
| Secured Convertible Bridge Note, 8% PIK, (acquired 8/25/16, maturing 8/4/21) | (M) (L3) | | | | $ | 1,278,453 | | | | 1,444,368 | | | | 360,465 | |
| | | | | | | | | 7,870,245 | | | | 360,465 | |
| | | | | | | | | | | | | | |
| EchoPixel, Inc. (3)(4) | | | Health Care Equipment | | | | | | | | | | | |
| Developing virtual reality 3-D visualization software for life sciences and health care applications | | | | | | | | | | | | | | |
| Series Seed Convertible Preferred Stock (acquired 6/21/13-6/30/14) | (I) (L3) | | | | 4,194,630 | | | | 1,250,000 | | | | 1,369,554 | |
| Series Seed-2 Convertible Preferred Stock (acquired 1/22/16) | (I) (L3) | | | | 1,476,668 | | | | 500,000 | | | | 488,352 | |
| Series A-2 Convertible Preferred Stock (acquired 3/23/17) | (I) (L3) | | | | 1,471,577 | | | | 350,000 | | | | 556,486 | |
| | | | | | | | | 2,100,000 | | | | 2,414,392 | |
| | | | | | | | | |
The accompanying notes are an integral part of these consolidated financial statements.
18
| | | | | | | | | | | | | | | | | | | | | | | | | | | | | |
| 180 DEGREE CAPITAL CORP. CONSOLIDATED SCHEDULE OF INVESTMENTS AS OF DECEMBER 31, 2019 | | | | | | | | | |
| | | | | | | | | |
| Method of
Valuation (1) | | Industry | | Shares/Principal | | Cost | | Value |
| | | | | | | | | | | | | | | | | | | | | | | | | | | | | |
| Investments in Non-Controlled Affiliated Companies (2) - | | | | | | | | | |
| 30.2% of net assets at value (cont.) | | | | | | | | | |
| | | | | | | | | |
| Privately Held Companies (Illiquid) - | | | | | | | | | |
| 16.9% of net assets at value (cont.) | | | | | | | | | |
| | | | | | | | | |
| Essential Health Solutions, Inc. (3) | | | Health Care Technology | | | | | | |
| Developing software for information transfer amongst healthcare providers and consumers | | | | | | | | | |
| Common Stock (acquired 11/18/16) | (I) (L3) | | | | 200,000 | | | | $ | 20 | | | | $ | 143,349 | |
| Series A Convertible Preferred Stock (acquired 11/18/16) | (I) (L3) | | | | 2,750,000 | | | | 2,750,000 | | | | 2,868,134 | |
| Unsecured Convertible Bridge Note, 8%, (acquired 12/19/18, maturing 12/19/21) | (I) (L3) | | | | $ | 50,000 | | | | 50,000 | | | | 50,000 | |
| | | | | | | | | 2,800,020 | | | | 3,061,483 | |
| | | | | | | | | | | | | | |
| HALE.life Corporation (3)(4) | | | Health Care Technology | | | | | | | | | | | |
| Developing a platform to facilitate precision health and medicine | | | | | | | | | | | | | | |
| Common Stock (acquired 3/1/16) | (I) (L3) | | | | 1,000,000 | | | | 10 | | | | 117,016 | |
| Series Seed-1 Convertible Preferred Stock (acquired 3/28/17) | (I) (L3) | | | | 11,000,000 | | | | 1,896,920 | | | | 1,613,660 | |
| Series Seed-2 Convertible Preferred Stock (acquired 12/28/18) | (I) (L3) | | | | 12,083,132 | | | | 2,500,000 | | | | 1,853,786 | |
| | | | | | | | | 4,396,930 | | | | 3,584,462 | |
| | | | | | | | | | | | | | |
| ORIG3N, Inc. (3)(4) | | | Health Care Technology | | | | | | | | | | | |
| Developing consumer focused genetic tests | | | | | | | | | | | | | | |
| Series 1 Convertible Preferred Stock (acquired 2/5/15-8/5/15) | (H) (L3) | | | | 1,195,315 | | | | 500,000 | | | | 885,200 | |
| Series A Convertible Preferred Stock (acquired 11/25/15-9/7/16) | (H) (L3) | | | | 1,364,666 | | | | 1,500,000 | | | | 1,060,501 | |
| Series A-2 Convertible Preferred Stock (acquired 5/11/17-2/8/18) | (H) (L3) | | | | 176,386 | | | | 200,002 | | | | 146,262 | |
| | | | | | | | | 2,200,002 | | | | 2,091,963 | |
| | | | | | | | | | | | | | |
| Produced Water Absorbents, Inc. (3)(10)(11) | | | Oil & Gas Equipment & Services | | | | | | | | | | | |
| Providing integrated process separation solutions to the global oil and gas industries, enabling onsite treatment of produced and flowback water | | | | | | | | | | | | | | |
| Common Stock (acquired 4/30/16) | (M) (L3) | | | | 50,243,350 | | | | 7,670,281 | | | | 0 | |
| Warrants for Common Stock expiring upon liquidation event (acquired 4/30/16) | (M) (L3) | | | | 450,000 | | | | 65,250 | | | | 0 | |
| Senior Secured Debt, 15% commencing on 4/1/16, matured on 12/31/19 (acquired 4/1/16) | (M) (L3) | | | | $ | 2,533,766 | | | | 2,533,766 | | | | 0 | |
| | | | | | | | | 10,269,297 | | | | 0 | |
| | | | | | | | | |
The accompanying notes are an integral part of these consolidated financial statements.
19
| | | | | | | | | | | | | | | | | | | | | | | | | | | | | |
| 180 DEGREE CAPITAL CORP. CONSOLIDATED SCHEDULE OF INVESTMENTS AS OF DECEMBER 31, 2019 | | | | | | | | | |
| | | | | | | | | |
| Method of
Valuation (1) | | Industry | | Shares/Principal | | Cost | | Value |
| | | | | | | | | | | | | | | | | | | | | | | | | | | | | |
| Investments in Non-Controlled Affiliated Companies (2) - | | | | | | | | | |
| 30.2% of net assets at value (cont.) | | | | | | | | | |
| | | | | | | | | |
| Privately Held Companies (Illiquid) - | | | | | | | | | |
| 16.9% of net assets at value (cont.) | | | | | | | | | |
| | | | | | | | | |
| TARA Biosystems, Inc. (3)(4) | | | Life Sciences Tools & Services | | | | | | |
| Developing human tissue models for toxicology and drug discovery applications | | | | | | | | | |
| Common Stock (acquired 8/20/14) | (I) (L3) | | | | 2,000,000 | | | | $ | 20 | | | | $ | 757,753 | |
| Series A Convertible Preferred Stock (acquired 3/31/17) | (I) (L3) | | | | 6,878,572 | | | | 2,545,493 | | | | 3,196,883 | |
| Series A-2 Convertible Preferred Stock (acquired 4/18/19) | (I) (L3) | | | | 208,577 | | | | 100,000 | | | | 101,062 | |
| | | | | | | | | 2,645,513 | | | | 4,055,698 | |
| | | | | | | | | |
| Total Non-Controlled Affiliated Privately Held Companies (cost: $34,096,785) | | | | | | | | | $ | 16,059,450 | |
| | | | | | | | | |
| Non-Controlled Affiliated Publicly Traded Securities (2) - | | | | | | | | | |
| 13.3% of net assets at value | | | | | | | | | |
| | | | | | | | | |
| Synacor, Inc. (4)(12) | | | Application Software | | | | | | |
| Providing technology development, multiplatform services and revenue partner for video, internet and communications providers, device manufacturers, and enterprises | | | | | | | | | |
| Common Stock (acquired 4/6/17-10/1/19) | (M) (L1) | | | | 1,611,882 | | | | $ | 4,362,473 | | | | $ | 2,450,061 | |
| Stock Options for Common Stock Expiring 2/28/29 (acquired 3/1/19) (3)(13) | (I) (L3) | | | | 50,000 | | | | 0 | | | | 47,221 | |
| Stock Options for Common Stock Expiring 5/16/29 (acquired 5/16/19) (3)(13) | (I) (L3) | | | | 15,000 | | | | 0 | | | | 14,293 | |
| Restricted Stock Units (acquired 9/10/19) (3)(13) | (M) (L2) | | | | 9,463 | | | | 0 | | | | 14,384 | |
| | | | | | | | | 4,362,473 | | | | 2,525,959 | |
| | | | | | | | | | | | | | |
| TheMaven, Inc. (3)(4) | | | Interactive Media & Services | | | | | | | | | | | |
| Providing a shared digital publishing, advertising and distribution platform | | | | | | | | | | | | | | |
| Series H Convertible Preferred Stock (acquired 6/27/19) | (M) (L2) | | | | 1,320 | | | | 2,000,000 | | | | 2,647,689 | |
| Series I Convertible Preferred Stock (acquired 6/28/19) | (M) (L2) | | | | 5,000 | | | | 5,000,000 | | | | 6,615,833 | |
| Series J Convertible Preferred Stock (acquired 10/7/19) | (M) (L2) | | | | 1,000 | | | | 1,000,000 | | | | 896,209 | |
| | | | | | | | | 8,000,000 | | | | 10,159,731 | |
| | | | | | | | | |
The accompanying notes are an integral part of these consolidated financial statements.
20
| | | | | | | | | | | | | | | | | | | | | | | | | | | | | |
| 180 DEGREE CAPITAL CORP. CONSOLIDATED SCHEDULE OF INVESTMENTS AS OF DECEMBER 31, 2019 | | | | | | | | | |
| | | | | | | | | |
| Method of
Valuation (1) | | Industry | | Shares/Principal | | Cost | | Value |
| | | | | | | | | | | | | | | | | | | | | | | | | | | | | |
| Total Non-Controlled Affiliated Publicly Traded Securities (cost: $12,362,473) | | | | | | | | | $ | 12,685,690 | |
| | | | | | | | | |
| Total Investments in Non-Controlled Affiliated Companies (cost: $46,459,258) | | | | | | | | | $ | 28,745,140 | |
| | | | | | | | | |
| Total Investments in Privately Held Companies and Publicly Traded Securities (cost: $85,577,467) | | | | | | | | | $ | 85,243,538 | |
| | | | | | | | | |
| Investment in Equity Method Privately Held Company (2) - | | | | | | | | | |
| 0.2% of net assets at value | | | | | | | | | |
| | | | | | | | | |
| Privately Held Company (Illiquid) - | | | | | | | | | |
| 0.2% of net assets at value | | | | | | | | | |
| | | | | | | | | |
| Accelerator IV-New York Corporation (3)(4)(14) | | | Research & Consulting Services | | | | | | |
| Identifying and managing emerging biotechnology companies | | | | | | | | | |
| Series A Common Stock (acquired 7/21/14-12/12/18) | (E) | | | | 833,333 | | | | $ | 203,677 | | | | $ | 203,677 | |
| | | | | | | | | |
| Total Investment in Equity Method Privately Held Company (adjusted cost: $203,677) | | | | | | | | | $ | 203,677 | |
| | | | | | | | | |
| Total Investments (cost: $85,781,144) | | | | | | | | | $ | 85,447,215 | |
| | | | | | | | | |
| Derivative Investments | | | | | | | | | |
| | | | | | | | | |
| Unaffiliated Rights to Payments (Illiquid) - | | | | | | | | | |
| 1.9% of net assets at value | | | | | | | | | |
| | | | | | | | | |
| Amgen, Inc. (3)(4)(15) | | | Biotechnology | | | | | | |
| Rights to Milestone Payments from Acquisition of BioVex Group, Inc. (acquired 3/4/11) | (I) (L3) | | | | $ | 548,998 | | | $ | 548,998 | | | $ | 1,774,098 | |
| | | | | | | | | |
| TheStreet, Inc. (3)(4)(16) | | | Financial Exchanges & Data | | | | | | |
| Contingent Value Right (acquired 8/7/19) | (I) (L3) | | | | 471,521 | | | | 21,218 | | | | 21,218 | |
| | | | | | | | | |
| Xenio Holdings, Inc. (3)(4)(17) | | | Technology Hardware, Storage & Peripherals | | | | | | |
| Rights to Payments from the Merger with Xenio Systems, Inc. (acquired 10/20/17) | (I) (L3) | | | | $ | 0 | | | 0 | | | | 0 | |
| | | | | | | | | |
The accompanying notes are an integral part of these consolidated financial statements.
21
| | | | | | | | | | | | | | | | | | | | | | | | | | | | | |
| 180 DEGREE CAPITAL CORP. CONSOLIDATED SCHEDULE OF INVESTMENTS AS OF DECEMBER 31, 2019 | | | | | | | | | |
| | | | | | | | | |
| Method of
Valuation (1) | | Industry | | Shares/Principal | | Cost | | Value |
| | | | | | | | | | | | | | | | | | | | | | | | | | | | | |
| Total Unaffiliated Rights to Payments (adjusted cost: $570,216) | | | | | | | | | $ | 1,795,316 | |
| | | | | | | | | |
| Total Derivative Investments (adjusted cost: $570,216) | | | | | | | | | $ | 1,795,316 | |
| | | | | | | | | |
| Total Investments and Derivatives (cost: $86,351,360) | | | | | | | | | $ | 87,242,531 | |
The accompanying notes are an integral part of these consolidated financial statements.
22
180 DEGREE CAPITAL CORP.
NOTES TO CONSOLIDATED SCHEDULE OF INVESTMENTS AS OF DECEMBER 31, 2019
Notes to Consolidated Schedule of Investments
(1)See "Note 2. Summary of Significant Accounting Policies: Portfolio Investment Valuations."
(2)Investments in unaffiliated companies consist of investments in which we own less than five percent of the voting shares of the portfolio company. Investments in non-controlled affiliated companies consist of investments in which we own five percent or more, but less than 25 percent, of the voting shares of the portfolio company, or where we control one or more seats on the portfolio company’s board of directors but do not control the company. Investments in controlled affiliated companies consist of investments in which we own 25 percent or more of the outstanding voting rights of the portfolio company or otherwise control the company, including control of a majority of the seats on the board of directors, or more than 25 percent of the seats on the board of directors, with no other entity or person in control of more director seats than us.
(3)We are subject to legal restrictions on the sale of our investment(s) in this company. The total amount of restricted securities held is $57,805,111, or 60.7 percent of net assets.
(4)Represents a non-income producing investment. Investments that have not paid dividends or interest within the last 12 months or are on non-accrual status for at least 12 consecutive months are considered to be non-income producing.
(5)We received LLC Interests of 1.25 percent in AutoTech Ventures Management I, LLC ("AutoTech") pursuant to an Administrative Services Agreement between us and AutoTech and due to us following the termination of a former employee of the Company. These LLC Interests were separate from the compensation received for providing the administrative services under the agreement that were paid in cash. The LLC interests have a capital percentage of 0 percent.
(6)D-Wave Systems, Inc., is located and is doing business primarily in Canada. We invested in D-Wave Systems, Inc. through Parallel Universes, Inc., a Delaware company. Our investment is denominated in Canadian dollars and is translated into U.S. dollar amounts at the date of valuation. See "Note 2. Summary of Significant Accounting Policies: Foreign Currency Translation." We may be also subject to certain taxation on this investment if we choose to sell our shares prior to a sale of the company or an initial public offering. See "Note 9. Income Taxes."
(7)On August 28, 2019, OpGen, Inc. effectuated a 1:20 reverse stock split of its common stock. The warrants held by the Company are for the purchase of common stock.
(8)Represents a non-operating entity that exists to collect future payments from licenses or other engagements, monetize assets for future distributions to investors and debt holders, or is in the process of shutting down and distributing remaining assets according to a liquidation waterfall.
(9)On August 4, 2015, SiOnyx, Inc., reorganized its corporate structure to become a subsidiary of a new company, Black Silicon Holdings, Inc. Our security holdings of SiOnyx, Inc. were converted into securities of Black Silicon Holdings, Inc. SiOnyx, Inc. was then acquired by an undisclosed buyer. Black Silicon Holdings, Inc. owns a profit interest in the undisclosed buyer.
(10)Produced Water Absorbents, Inc., also does business as ProSep, Inc.
(11)The Company's senior secured debt security of Produced Water Absorbents, Inc., matured on December 31, 2019, but was not repaid. The Company has agreed to extend the maturity date of the secured debt security and an agreement is in process. The repayment of the debt is uncertain. See Note 2. "Summary of Significant Policies: Interest Income Recognition."
(12)The Company is the Investment Manager and Managing Member of 180.2 SPV Series - a Series of 180 Degree Capital Management, LLC that owns 1,241,400 shares, or 3.2 percent of the voting securities, of Synacor, Inc. ("SYNC"). When combined with the Company's ownership of 4.1 percent of the voting securities of SYNC, the Company controls 7.3 percent of the voting securities of SYNC, based on 39,188,432 shares reported in SYNC's most recent Securities and Exchange Commission ("SEC") filing, Form 10-Q, as of September 30, 2019.
The accompanying notes are an integral part of these consolidated financial statements.
23
180 DEGREE CAPITAL CORP.
NOTES TO CONSOLIDATED SCHEDULE OF INVESTMENTS AS OF DECEMBER 31, 2019
(13)The stock options and restricted stock units were issued to Kevin Rendino for service on the Board of Directors of SYNC. Mr. Rendino entered into an assignment and assumption agreement with the Company that transfers all beneficial and voting interest to the Company.
(14)Under the equity method, investments are carried at cost, plus or minus the company's equity in the increases and decreases in the investee's net assets after the date of acquisition and certain other adjustments. The Company owns approximately 9.6 percent of Accelerator IV-New York Corporation.
(15)If all the remaining milestones are met, we would receive $5,384,482. There can be no assurance as to how much of these amounts we will ultimately realize or when they will be realized, if at all.
(16)In conjunction with the sale of TheStreet, Inc. ("TST") to TheMaven, Inc. ("MVEN"), the Company received a contingent value right for its pro rata share of a potential distribution from the release of escrowed funds after January 31, 2020, related to the sale of a portion of TST's business prior to the acquisition by MVEN. The Company could receive up to approximately $0.09 per share, or approximately $42,400 if the escrow is released in full. There can be no assurance as to how much of this amount we will ultimately realize, if any.
(17)In October 2017, Xenio Systems, Inc., merged with Xenio Holdings, Inc. In conjunction with this merger, all common stock of Xenio Systems, Inc., was canceled and shareholders were granted a right to a future payment in the event of a sale of Xenio Holdings, Inc. The maximum amount we could receive from such payments is approximately $11,100. There can be no assurance as to how much of these amounts we will ultimately realize or when they will be realized, if at all.
The accompanying notes are an integral part of these consolidated financial statements.
24
180 DEGREE CAPITAL CORP.
NOTES TO CONSOLIDATED FINANCIAL STATEMENTS
NOTE 1. THE COMPANY
180 Degree Capital Corp. (f/k/a Harris & Harris Group, Inc.) (the "Company," "us," "our" and "we"), withdrew its election to be treated as a business development company on March 30, 2017, and subsequently returned to its prior status as a registered non-diversified closed-end management investment company ("Closed-End Fund" or "CEF") under the Investment Company Act of 1940 (the "1940 Act"). We operate as an internally managed investment company whereby our officers and employees, under the general supervision of our Board of Directors, conduct our operations.
H&H Ventures Management, Inc.SM ("Ventures") is a 100 percent owned subsidiary of the Company. Ventures is taxed under Subchapter C (a "C Corporation") of the Internal Revenue Code of 1986 (the "Code"). Harris Partners I, L.P, is a limited partnership and, from time to time, may be used to hold certain interests in our portfolio companies. The partners of Harris Partners I, L.P., are Ventures (sole general partner) and the Company (sole limited partner). Ventures pays taxes on income generated by its operations as well as on any non-passive investment income generated by Harris Partners I, L.P. For the year ended December 31, 2019, there was no non-passive investment income generated by Harris Partners I, L.P. Ventures, as the sole general partner, consolidates Harris Partners I, L.P. The Company consolidates Ventures for financial reporting purposes.
The Company is the Managing Member of 180 Degree Capital Management, LLC ("180CM"), a limited liability company formed to facilitate the opportunity for interested investors to co-invest alongside the Company in individual publicly traded portfolio companies. As of December 31, 2019, the Company had $2.2 million in capital under management in 180.2 SPV Series ("180.2 SPV"), a series of 180CM. The Company raised $3.85 million in capital under management in TheStreet SPV Series ("TST SPV"), a series of 180CM in November 2017. Substantially all of this capital and the gains from investment were distributed to investors in TST SPV in 2019. Approximately $13,500 in value remains in TST SPV as of December 31, 2019.
The Company is the General Partner of 180 Phoenix Fund, L.P. ("180 Phoenix"), a limited partnership formed to facilitate management of a fund that was formed to co-invest alongside the Company in its publicly traded companies on an on-going basis. As of December 31, 2019, 180 Phoenix did not have any capital under management.
The Company is also the Managing Member of H&H Co-Investment Partners, LLC, a limited liability company formed to facilitate the opportunity for interested investors to co-invest alongside the Company in its private portfolio companies. As of December 31, 2019, H&H Co-Investment Partners did not have any capital under management.
The Company may, in certain cases, receive management fees and carried interest on profits generated on invested capital from any capital under management if and when capital is raised and if and when profits are realized, respectively. The Company does not consolidate the operations of any capital managed in separate series of 180CM and it does not expect to consolidate the operations of any capital managed in separate series of H&H Co-Investment Partners or 180 Phoenix, if and when either entity has capital under management.
180 Degree Capital BD, LLC ("180BD") is a 100 percent owned subsidiary of the Company. 180BD was formed to provide services to the Company related to fundraising for co-investment funds and not for investment returns. 180BD is a registered broker-dealer with the Financial Industry Regulatory Authority ("FINRA"). The Company consolidates 180BD for financial reporting purposes. 180BD is currently a disregarded entity for tax purposes under the Code.
NOTE 2. SUMMARY OF SIGNIFICANT ACCOUNTING POLICIES
The following is a summary of significant accounting policies followed in the preparation of the consolidated financial statements:
Principles of Consolidation. The consolidated financial statements have been prepared in accordance with accounting principles generally accepted in the US ("GAAP") and Articles 6 and 12 of Regulation S-X of the SEC and include the accounts of the Company and its wholly owned subsidiaries. The Company is an investment company following accounting and reporting guidance in Accounting Standards Codification 946. In accordance with GAAP and Regulation S-X under 17 C.F.R. Part 210, the Company may only consolidate its interests in investment company subsidiaries and controlled operating companies whose business consists of providing services to the Company. Our wholly owned subsidiaries, Ventures and 180BD, are controlled operating companies that provide services to us and are, therefore, consolidated. All significant intercompany accounts and transactions have been eliminated in the consolidation.
Use of Estimates. The preparation of the consolidated financial statements in conformity with GAAP requires management to make estimates and assumptions that affect the reported amounts of assets and liabilities and contingent assets and liabilities and the reported amounts of revenues and expenses. Actual results could differ from these estimates, and the differences could be material. The most significant estimates relate to the fair valuations of our investments.
Portfolio Investment Valuations. Investments are stated at "value" as defined in the 1940 Act and in the applicable regulations of the SEC and in accordance with GAAP. Value, as defined in Section 2(a)(41) of the 1940 Act, is (i) the market price for those securities for which a market quotation is readily available and (ii) the fair value as determined in good faith by, or under the direction of, the Board of Directors for all other assets. The Valuation Committee, comprised of all of the independent Board members, is responsible for determining the valuation of the Company’s assets within the guidelines established by the Board of Directors. The Valuation Committee receives information and recommendations from management. An independent valuation firm also reviews select portfolio company valuations. The independent valuation firm does not provide independent valuations. The fair values assigned to these investments are based on available information and do not necessarily represent amounts that might ultimately be realized when that investment is sold, as such amounts depend on future circumstances and cannot reasonably be determined until the individual investments are actually liquidated or become readily marketable. The Valuation Committee values the Company's investment assets as of the end of each calendar quarter and as of any other time requested by the Board of Directors.
Accounting Standards Codification Topic 820, "Fair Value Measurements," ("ASC 820") defines fair value as the price that would be received to sell an asset or paid to transfer a liability in an orderly transaction between market participants at the measurement date (exit price). It applies fair value terminology to all valuations whereas the 1940 Act applies market value terminology to readily marketable assets and fair value terminology to other assets.
The main approaches to measuring fair value utilized are the market approach, the income approach and the hybrid approach.
•Market Approach (M): The market approach focuses on inputs and not techniques. The market approach may use quantitative inputs such as prices and other relevant information generated by market transactions involving identical or comparable assets or liabilities and the values of market multiples derived from a set of comparable companies. The market approach may also use qualitative inputs such as progress toward milestones, the long-term potential of the business, current and future financing requirements and the rights and preferences of certain securities versus those of other securities. The selection of the relevant inputs used to derive value under the market approach requires judgment considering factors specific to the significance and relevance of each input to deriving value.
•Income Approach (I): The income approach focuses on techniques and not inputs. The income approach uses valuation techniques to convert future amounts (for example, revenue, cash flows or earnings) to a single present value amount (discounted). The measurement is based on the value indicated by current market expectations about those future amounts. Those valuation techniques include present value techniques; option-pricing models, such as the Black-Scholes-Merton formula (a closed-form model) and a binomial model (a lattice model), which incorporate present value techniques; and the multi-period excess earnings method, which is used to measure the fair value of certain assets.
•Hybrid Approach (H): The hybrid approach uses elements of both the market approach and the income approach. The hybrid approach calculates values using the market and income approach, individually. The resulting values are then distributed among the share classes based on probability of exit outcomes.
ASC Topic 820 classifies the inputs used to measure fair value by these approaches into the following hierarchy:
•Level 1 (L1): Unadjusted quoted prices in active markets for identical assets or liabilities;
•Level 2 (L2): Inputs other than quoted prices included within Level 1 that are observable for the asset or liability, either directly or indirectly. These include quoted prices in active markets for similar assets or liabilities, or quoted prices for identical or similar assets or liabilities in markets that are not active, or inputs other than quoted prices that are observable for the asset or liability, either directly or indirectly, for substantially the full term of the financial instrument. Level 2 inputs are in those markets for which there are few transactions, the prices are not current, little public information exists or instances where prices vary substantially over time or among brokered market makers; and
•Level 3 (L3): Inputs to the valuation methodology are unobservable and significant to the fair value measurement. Unobservable inputs are those inputs that reflect our own assumptions that market participants would use to price the asset or liability based upon the best available information.
Financial assets and liabilities are classified in their entirety based on the lowest level of input that is significant to the fair value measurement and are not necessarily an indication of risks associated with the investment.
As of December 31, 2019, our financial statements include investments fair valued by the Board of Directors of $57,605,587 and one investment valued under the equity method at $203,677. The fair values and equity method value were determined in good faith by, or under the direction of, the Board of Directors. The fair value amount includes the values of our investments in privately held companies as well as our preferred stock of TheMaven, Inc., stock options and restricted stock units of Synacor, Inc., and our warrants of OpGen, Inc., which are securities of publicly traded companies. Our investment in Accelerator IV-New York Corporation has been historically accounted for under the equity method of accounting. Under the equity method, investments are carried at cost, plus or minus the Company’s equity in the increases and decreases in the investee’s net assets after the date of acquisition and certain other adjustments. The Company’s share of the net income or loss of the investee is included in "Share of loss on equity method investment" on the Company’s Consolidated Statement of Operations. Upon sale of investments, the values that are ultimately realized may be different from the fair value presented in the Company's financial statements. The difference could be material.
Cash. Cash includes demand deposits. Cash is carried at cost, which approximates fair value.
Restricted Cash. At December 31, 2019, we held $46,151 in "Restricted cash", as security deposits for a sub-lease. The sub-lease agreement expired at December 31, 2019. These funds are not considered part of operating cash of the Company and are payable to the sub-lease tenant.
Unaffiliated Rights to Payments. At December 31, 2019, the outstanding potential milestone payments from Amgen, Inc.’s acquisition of BioVex Group, Inc., were valued at $1,774,098. The milestone payments are derivatives and valued using the probability-adjusted, present value of proceeds from future payments that would be due upon successful completion of certain regulatory and sales milestones.
At December 31, 2019, the outstanding contingent value right from TheStreet, Inc., were valued at $21,218. At December 31, 2019, the outstanding potential rights to payments from Xenio Holdings, Inc.'s merger with Xenio Systems, Inc., were valued at $0.
Prepaid Expenses. We include prepaid insurance premiums and deferred financing charges in "Prepaid expenses." Prepaid insurance premiums are recognized over the term of the insurance contract and are included in "Insurance" in the Company's Consolidated Statement of Operations.
Property and Equipment. Property and equipment are included in "Other assets" and are carried at $17,153 at December 31, 2019, representing cost of $205,503, less accumulated depreciation of $188,350. Depreciation is provided using the straight-line method over the estimated useful lives of the property and equipment. We estimate the useful lives to be five to ten years for furniture and fixtures, and three years for computer equipment.
Post-Retirement Plan Liabilities. Until it was terminated on April 27, 2017, the Company provided a Retiree Medical Benefit Plan for employees who met certain eligibility requirements. Until it was terminated on May 5, 2011, the Company also provided an Executive Mandatory Retirement Benefit Plan for certain individuals employed by us in a bona fide executive or high policy-making position. The net periodic post-retirement benefit cost includes service cost and interest on the accumulated post-retirement benefit obligation. Unrecognized actuarial gains and losses are recognized as net periodic benefit cost, pursuant to the Company's historical accounting policy in "Salaries, bonus and benefits" in the Company's Consolidated Statement of Operations. The impact of plan amendments was amortized over the employee's average service period as a reduction of net periodic benefit cost. Unamortized prior service cost was fully amortized during 2017 as a result of the termination of the Retiree Medical Benefit Plan.
Interest Income Recognition. Interest income, including amortization of premium and accretion of discount, is recorded on an accrual basis. When accrued interest is determined not to be recoverable, the Company ceases accruing interest and writes off any previously accrued interest. Write-offs are netted in interest income. During the year ended December 31, 2019, the Company had write-offs that netted a reduction of interest income of $620,108 in cash interest ($38,657 in interest, being offset by a write-off of $658,765) on senior secured debt, secured and unsecured convertible bridge notes, interest-bearing accounts and U.S. government securities. During the year ended December 31, 2019, the Company recorded, on a net basis, $61,066 of bridge note payment-in-kind ("PIK") interest. Securities are deemed to be non-income producing if investments have not paid dividends or interest within the last 12 months or are on non-accrual status for at least 12 consecutive months.
When the fair value of a security that includes PIK interest is less than the accrued interest, the Company may place the security on non-accrued status. Starting April 1, 2018 and through December 31, 2019, Black Silicon Holdings, Inc. is on non-accrued status. During 2019, had interest been accrued, an additional $103,697 in income would have been included in "Non-controlled affiliated companies-PIK" in the Company's Consolidated Statement of Operations. Starting July 1, 2018 and through December 31, 2019, Produced Water Absorbents, Inc. ("PWA") is on non-accrued status. During 2019, had interest been accrued, an additional $559,441 in income would have been included in "Non-controlled affiliated companies-cash" in the Company's Consolidated Statement of Operations. Also during 2019, $658,765, the remaining interest accrual, previously recorded, was written-off on the senior secured debt issued by PWA to the Company due to Management's assessment of collectibility. The senior secured debt issued by PWA to the Company matured on December 31, 2019, but was not repaid. The Company and the other holder of the debt security have agreed to extend the maturity date of the debt security and an agreement is in process. The timing of repayment of the debt and the amount realized, if any, however, remains uncertain.
Yield Enhancing Fee Income on Debt Securities. Yield enhancing fee income received in connection with our non-convertible debt investments are deferred. The unearned fee income is accreted into income based on the effective interest method over the life of the investment. During the year ended December 31, 2019, total yield enhancing fees accreted into investment income was $210,086.
Fee Income for Providing Managerial Assistance to Portfolio Companies. During the year ended December 31, 2019, the Company earned $89,239 in cash income and $86,962 in non-cash income, owing to certain of its employees providing managerial assistance to and/or as members of the board of directors of TheStreet, Inc. and Synacor, Inc. The Company had write-offs of fee income for providing managerial assistance of $18,750 due from HALE.life Corporation, as the Company agreed to forgo such payments along with the other members of HALE's board of directors, during the year ended December 31, 2019. We recognize revenues from fee income for providing managerial assistance as those services are provided.
Management Fee Income and Carried Interest from Managed Funds. As of December 31, 2019, the Company manages $2.2 million of external capital as the investment manager of TST SPV and 180.2 SPV (together, the "Managed SPVs" or "Managed Funds"). The Company receives management fee income for its services as investment manager and calculated based on the investment management agreement between the Company and the Managed SPVs. Management fee income is earned and accrued from the date of inception of each Managed SPV through the date of liquidation of the Managed SPV. The management fee income will be paid to the Company upon liquidation of the Managed SPVs regardless of the performance.
The Company earned and collected $74,137 in management fee income from TST SPV, following a distribution from TheStreet, Inc., in April 2019, of which $58,551 was accrued from inception through December 31, 2018. The remaining $15,586 of earned and collected management fee income was for the period from January 1, 2019 through March 31, 2019. The Company collected an additional $15,024 of management fee income from TST SPV in August 2019, following the sale of TheStreet, Inc., to TheMaven, Inc. The Company will not earn, accrued or receive any further management fee income from TST SPV.
The inception to date accrued but not collected management fee income from 180.2 SPV for the year ended December 31, 2019, were $46,492 and is recorded in "Receivable from portfolio companies and managed funds" in the Company's Consolidated Statement of Assets and Liabilities. Management fee income for the year ended December 31, 2019, for 180.2 SPV is $24,669. Management fee income from Managed SPVs for the year ended December 31, 2019, is recorded in "Management fee income" in the Company's Consolidated Statement of Operations.
As Managing Member of the Managed SPVs, the Company is entitled to receive carried interest on realized profits generated on the managed capital and calculated based on the investment management agreement between the Company and the Managed SPVs. The Company does not include accruals for carried interest in the Consolidated Financial Statements until such carried interest is received and/or the Company concludes that it is probable that a reversal of any accrual will not occur.
The Company received and recognized $633,533 in carried interest from TST SPV during the year ended December 31, 2019, as a result of a realized gain from distributions from TheStreet, Inc. in April 2019 and August 2019, which is recorded in "Carried interest" in the Company's Consolidated Statement of Operations.
Other Income. The Company may purchase restricted securities issued by publicly traded companies that include provisions that provide for payment of partial liquidated damages in the event the issuer does not meet obligations specified in the purchase agreement or other ancillary documents associated with the transaction. These obligations most commonly are associated with the filing of registration statements and/or being up to date with the filing of the issuer's financial statements with the SEC. As of December 31, 2019, the Company is due $106,592 in partial liquidated damages from TheMaven, Inc., one of its publicly traded portfolio companies, as a result of the delay in filing of registration statements related to the Company's shares of Series H and Series I Convertible Preferred Stock and from the delay in filing of up-to-date financial information with the SEC. The amount for partial liquidated damages is recorded in "Other income" in the Company's Consolidated Statement of Operations and is included in "Receivable from portfolio companies and managed funds" in the Company's Consolidated Statement of Assets and Liabilities.
Put Options. The Company may purchase put options on publicly traded securities as an investment and/or with the intention of limiting its downside risk. When the Company purchases a put option, an amount equal to the premium paid is recorded in the Consolidated Statements of Assets and Liabilities as an investment. The Company may also purchase a put option at one price and write/sell a put option at another price in a simultaneous transaction referred to as a put spread. The amount of these assets is subsequently marked-to-market to reflect the current value of the put options. In the event that the put options are exercised, the Company would be required to deliver those shares to the counterparty. When the put options expire unexercised, the Company realizes a loss on the premium paid, or the difference between the premium paid and the premium received, as applicable. Net realized gain from investments in purchased put options and written put options was $114,202.
Rent Expense and Sub-lease Income. Our lease at 1450 Broadway, New York, New York, commenced on January 21, 2010. The lease expired on December 31, 2019. The base rent was $36 per square foot with a 2.5 percent increase per year over the 10 years of the lease, subject to a full abatement of rent for four months and a rent credit for six months throughout the lease term. The Company applied these rent abatements, credits, escalations and landlord payments on a straight-line basis in the determination of rent expense over the lease term. The security deposit held by the landlord as of December 31, 2019 is included in "Other receivables" in the Company's Consolidated Statement of Assets and Liabilities".
On June 9, 2017, the Company entered into a sub-lease for our office space in New York that began on June 15, 2017, and extended through the remainder of our lease term of December 31, 2019. The sub-lease expired on December 31, 2019. The base rent was $37 per square foot with a 3 percent increase per year, subject to an abatement of rent and a rent credit to the sub-lessee for 3.9 months. The Company applied the rent abatement and credit on a straight-line basis in the determination of rental income over the sub-lease term.
During the year ended December 31, 2019, the Company earned rental income of $248,666, from the sub-lease of our office space in New York, which is recorded as "Sub-lease income" under investment income in the Company's Consolidated Statement of Operations.
The Company currently leases and runs daily operations in approximately 1,250 square feet of office space in Montclair, New Jersey, on a month-to-month basis. The base rent is approximately $26 per square foot. Either the Company or the landlord may terminate the lease at any time with two months' written notice to either party.
Realized Gain or Loss and Unrealized Appreciation or Depreciation of Portfolio Investments. Realized gain or loss is recognized when an investment is disposed of and is computed as the difference between the Company's cost basis in the investment at the disposition date and the net proceeds received from such disposition. Realized gain or loss on investment transactions are determined by specific identification. Unrealized appreciation or depreciation is computed as the difference between the fair value of the investment and the cost basis of such investment.
Income Taxes. As we currently intend to qualify as a Regulated Investment Company ("RIC") under Subchapter M of the Code in future years and distribute any ordinary income, the Company does not accrue for income taxes. The Company has capital loss carryforwards that can be used to offset net realized capital gains. The Company also has operating loss carryforwards that can be used to offset operating income and net realized capital gains in years when we fail to qualify as a RIC. The Company recognizes interest and penalties in income tax expense. We pay federal, state and local income taxes on behalf of our wholly owned subsidiary, Ventures, which is a C Corporation. See Note 9. Income Taxes for further discussion.
Foreign Currency Translation. The accounting records of the Company are maintained in U.S. dollars. All assets and liabilities denominated in foreign currencies are translated into U.S. dollars based on the rate of exchange of such currencies against U.S. dollars on the date of valuation. The Company does not isolate the portion of the results of operations that arises from changes in foreign currency rates on investments held on its Consolidated Statement of Operations.
Securities Transactions. Securities transactions are accounted for on the date the transaction for the purchase or sale of the securities is entered into by the Company (i.e., trade date). Securities transactions outside conventional channels, such as private transactions, are recorded as of the date the Company obtains the right to demand the securities purchased or to collect the proceeds from a sale and incurs the obligation to pay for the securities purchased or to deliver the securities sold.
Concentration of Credit Risk. The Company places its cash and cash equivalents with financial institutions and, at times, cash held in depository accounts may exceed the Federal Deposit Insurance Corporation's insured limit and is subject to the credit risk of such institutions to the extent it exceeds such limit.
Concentration of Investor Risk. As of December 31, 2019, two investors, Ariel Investments, LLC and Financial Consulate Inc., owned approximately 9.6 percent and 7.0 percent, respectively, of our outstanding shares.
Recent Accounting Pronouncements and Adoptions. On July 26, 2019, the FASB issued ASU 2019-07, "Codification Updates to SEC Sections." This ASU updates the Codification to reflect previously issued SEC final rules for Disclosure Update and Simplification and Investment Company Reporting Modernization. Other miscellaneous updates are included to update language for the Codification to the electronic Code of Federal Regulations. These updates have no material impact on the Company's Consolidated Financial Statements.
On January 16, 2020, the FASB issued ASU 2020-01, "Investments - Equity Securities (Topic 321), Investments - Equity Method and Joint Ventures (Topic 323), and Derivatives and Hedging (Topic 815)." This ASU among other things clarifies that an entity should consider observable transactions that require the entity to either apply or discontinue the equity method of accounting, for the purposes of applying the measurement alternative in accordance with Topic 321 immediately before applying or upon discontinuing the equity method. The guidance is effective for fiscal years, and interim periods within those fiscal years, beginning after December 15, 2020, with early adoption permitted. Our investment in Accelerator IV-New York Corporation has been historically accounted for under the equity method of accounting. This ASU is not expected to have a material impact on the Company's financial statements as the Company holds only one immaterial equity method investment and it does not expect this investment to become material, nor does it expect to have additional equity method investments in the future.
On August 28, 2018, the FASB issued ASU 2018-13, "Disclosure Framework - Changes to the Disclosure Requirements for Fair Value Measurement." This ASU includes new, eliminated, and modified disclosure requirements. In addition, this ASU clarifies that materiality is an appropriate consideration for entities when evaluating disclosure requirements. The guidance is effective for fiscal years, and interim periods within those fiscal years, beginning after December 15, 2019. An entity is permitted to early adopt any eliminated or modified disclosures upon issuance of this ASU and delay adoption of the new disclosures until their effective date. The Company had early adopted the eliminated and modified disclosures in 2018, as permitted by this ASU, and it did not have a material impact on its Consolidated Financial Statements as the changes are solely disclosure related.
On June 16, 2016, the FASB issued ASU 2016-13, "Financial Instruments - Credit Losses (Topic 326): Measurement of Credit Losses on Financial Instruments." This ASU is intended to introduce new guidance for the accounting for credit losses on instruments within scope based on an estimate of current expected credit losses. The guidance will be effective for fiscal years, and interim periods within those fiscal years, beginning after December 15, 2019, with early adoption permitted. The Company assesses the collectibility of any interest receivables and includes such determinations in the amounts included on its Consolidated Financial Statements. All other financial instruments owned by the Company are fair valued. The Company has early adopted this ASU. The disclosure changes did not have a material impact on the Company's Consolidated Financial Statements as the amounts to be disclosed as stated prior have been determined not to be material. The FASB has an ongoing annual improvements project on this ASU and on May 15, 2019 issued one such improvement, ASU 2019-05, "Financial Instruments-Credit Losses (Topic 326)" Targeted Transition Relief." This ASU provides entities within the scope of Subtopic 326-20, Financial Instruments-Measured at Amortized Cost, with an option to irrevocably elect the fair value option in Subtopic 825-10. These improvements have no material impact on the Company's Consolidated Financial Statements. The FASB has an ongoing annual improvements project on this ASU and on November 26, 2019 issued one such improvement, ASU 2019-11, "Codification Improvements to Topic 326, Financial Instruments-Credit Losses." This ASU, among other narrow-scope improvements, clarifies guidance around how to report expected recoveries. These improvements have had no material impact on the Company's Consolidated Financial Statements.
On February 25, 2016, the FASB issued ASU 2016-02, "Leases (Topic 842)." This ASU supersedes the existing guidance for the accounting for leases. Under the new guidance, lessees are required to recognize a right-of-use asset and a lease liability for all leases. The new guidance will continue to classify leases as either financing or operating, with classification affecting the pattern of expense recognition. The accounting applied by a lessor under the new guidance will be substantially equivalent to current lease accounting guidance. This ASU is required to be applied with a modified retrospective approach to each prior reporting period presented and provides for certain practical expedients. The guidance will be effective for fiscal years, and interim periods within those fiscal years, beginning after December 15, 2018, with early adoption permitted. For leases with a term of 12 months or less, a lessee is permitted to make an accounting policy election by class of underlying asset not to recognize lease assets and lease liabilities. If a lessee makes this election, it should recognize lease expense for such leases generally on a straight-line basis over the lease term. The Company adopted this ASU in its Consolidated Financial Statements, with the accounting policy election discussed above, which is consistent with how the Company currently accounts for its leases. The Company has one lease, a month-to-month lease at its current location in Montclair, New Jersey. On March 5, 2019, the FASB issued an improvement, ASU 2019-01, "Leases (Topic 842): Codification Improvements." This ASU addresses the determination of fair value of the underlying asset by lessors that are not manufacturers ore dealers; presentation on the statement of cash flows under sales type and direct financing leases; and transition disclosures. These improvements have had no material impact on the Company's Consolidated Financial Statements.
NOTE 3. BUSINESS RISKS AND UNCERTAINTIES
Our business activities contain elements of risk. We consider the principal types of market risk to be valuation risk, diversification risk, interest rate risk and foreign currency risk. Although we are risk-seeking rather than risk-averse in our investments, we consider the management of risk to be essential to our business.
Valuation Risk
Value, as defined in Section 2(a)(41) of the 1940 Act, is (i) the market price for those securities for which market quotations are readily available and (ii) fair value as determined in good faith by, or under the direction of, the Board of Directors for all other assets. See Note 2. Summary of Significant Accounting Policies for further discussion.
We have historically invested primarily in privately held companies, the securities of which are inherently illiquid. We are currently focused on investing in what we believe are deeply undervalued microcapitalization publicly traded companies. Our publicly traded securities account for approximately 45.5 percent of the value of our portfolio of investments. Although these companies are publicly traded, their stock may not trade at high volumes and/or we may own a significant portion of a company's outstanding stock, which may restrict our ability to sell our positions in an orderly fashion and prices at which sales can be made may be volatile and materially different than the closing prices of such positions at each financial statement date. We may also be subject to restrictions on transfer and/or other lock-up provisions after these companies complete public offerings and/or if we invest in unregistered securities of public companies. Many of our privately held and publicly traded businesses tend to not have attained profitability, and many of these businesses also lack management depth and have limited or no history of operations. Because of the speculative nature of our investments and the lack of a liquid market for and restrictions on transfers of privately held investments, there is greater risk of loss relative to traditional marketable investment securities.
Approximately 66.0 percent of our portfolio was fair valued and comprised of securities of privately held companies and rights to potential future milestone payments as well as our preferred stock of TheMaven, Inc. (a Level 2 investment), stock options and restricted stock of Synacor Inc. (a Level 3 investment and a Level 2 investment, respectively), and our warrants of OpGen, Inc. (a Level 2 and Level 3 investment), which are publicly traded companies. Approximately 0.2 percent of the portion of our equity-focused portfolio that was valued according to the equity method was comprised of one privately held company. Because there is typically no public or readily ascertainable market for our interests in the small privately held companies in which we invest, the valuation of the securities in that portion of our portfolio is determined in good faith by our Valuation Committee, which is comprised of all of the independent members of our Board of Directors. The values are determined in accordance with our Valuation Procedures and are subject to significant estimates and judgments. The fair value of the securities in our portfolio may differ significantly from the values that would be placed on these securities if a ready market for the securities existed. Additionally, inputs may become available after a financial statement date that could result in a material change in value at a future financial statement date from the value reported in the current financial statements. Any changes in valuation are recorded in the Company's Consolidated Statement of Operations as "Change in unrealized appreciation (depreciation) on investments." Changes in valuation of any of our investments in privately held companies from one period to another may be significant.
Diversification Risk
While we are subject to certain diversification requirements regarding the concentration of investments in any one industry or group of industries, we do not choose investments based on a strategy of diversification. We also do not rebalance the portfolio should one of our portfolio companies increase in value substantially relative to the rest of the portfolio. Therefore, the value of our portfolio may be more vulnerable to microeconomic events affecting a single sector, industry or portfolio company and to general macroeconomic events that may be unrelated to our portfolio companies. These factors may subject the value of our portfolio to greater volatility than a company that follows a diversification strategy. As of December 31, 2019 our largest 10 investments by value accounted for approximately 78 percent of the value of our investment portfolio. Our largest three investments, by value, AgBiome, LLC, Quantum Corporation, and TheMaven, Inc., accounted for approximately 18 percent, 15 percent and 12 percent, respectively, of our investment portfolio at December 31, 2019. AgBiome, LLC, is a privately held portfolio company and Quantum Corporation and TheMaven, Inc. are publicly traded companies.
Interest Rate Risk
Interest rate sensitivity refers to the change in earnings that may result from changes in the level of interest rates. We may invest in both short- and long-term U.S. government and agency securities. To the extent that we invest in short- and long-term U.S. government and agency securities, changes in interest rates result in changes in the value of these obligations that result in an increase or decrease of our net asset value. The level of interest rate risk exposure at any given point in time depends on the market environment, the expectations of future price and market movements, and the quantity and duration of long-term U.S. government and agency securities held by the Company, and it will vary from period to period.
In addition, market interest rates for high-yield corporate debt may be an input in determining value of our investments in debt securities of privately held and publicly traded companies. Significant changes in these market rates could affect the value of our debt securities as of the valuation date of measurement of value. While we do not currently have any investments in debt securities with floating interest rates, investment income in such securities should we acquire them in the future could be adversely affected by changes in interest rates.
Foreign Currency Risk
Most of our investments are denominated in U.S. dollars, based on country of issuer. We currently have one investment denominated in Canadian dollars. We are exposed to foreign currency risk related to potential changes in foreign currency exchange rates pertaining to this investment. The potential loss in fair value on this investment resulting from a 10 percent adverse change in quoted foreign currency exchange rates is $473,178 at December 31, 2019. We do not currently hedge our exposure to fluctuations in currencies.
NOTE 4. FAIR VALUE OF INVESTMENTS
At December 31, 2019, our financial assets valued at fair value were categorized as follows in the fair value hierarchy:
| | | | | | | | | | | | | | | | | | | | | | | | | | |
| | | Fair Value Measurement at Reporting Date Using: | | | | | | |
Description | | Unadjusted Quoted Prices in Active Markets for Identical Assets (Level 1) | |
Significant Other Observable Inputs (Level 2) | |
Significant Unobservable Inputs (Level 3) | | December 31, 2019 |
| Privately Held Portfolio Companies: | | | | | | | | |
| Preferred Stock | | $ | 0 | | | $ | 0 | | | $ | 42,949,793 | | | $ | 42,949,793 | |
| Bridge Notes | | 0 | | | 0 | | | 1,455,248 | | | 1,455,248 | |
| Common Stock | | 0 | | | 0 | | | 1,018,118 | | | 1,018,118 | |
| Warrants | | 0 | | | 0 | | | 0 | | | 0 | |
| Senior Secured Debt | | 0 | | | 0 | | | 0 | | | 0 | |
| LLC Interests | | 0 | | | 0 | | | 147,330 | | | 147,330 | |
| | | | | | | | |
| Publicly Traded Portfolio Companies: | | | | | | | | |
| Common Stock | | $ | 29,433,267 | | | $ | 14,384 | | | $ | 0 | | | $ | 29,447,651 | |
| Preferred Stock | | 0 | | | 10,159,731 | | | 0 | | | 10,159,731 | |
| Warrants | | 0 | | | 4,150 | | | 3 | | | 4,153 | |
| Stock Options | | 0 | | | 0 | | | 61,514 | | | 61,514 | |
| Total Investments: | | $ | 29,433,267 | | | $ | 10,178,265 | | | $ | 45,632,006 | | | $ | 85,243,538 | |
| | | | | | | | |
| Derivative Investments: | | | | | | | | |
| Rights to Payments | | $ | 0 | | | $ | 0 | | | $ | 1,795,316 | | | $ | 1,795,316 | |
| Total Financial Assets: | | $ | 29,433,267 | | | $ | 10,178,265 | | | $ | 47,427,322 | | | $ | 87,038,854 | |
Significant Unobservable Inputs
The table below presents the valuation technique and quantitative information about the significant unobservable inputs utilized by the Company in the fair value measurements of Level 3 assets. Unobservable inputs are those inputs for which little or no market data exists and, therefore, require an entity to develop its own assumptions.
| | | | | | | | | | | | | | | | | | | | | | | |
| Fair Value as of 12/31/2019 | | Valuation Approach(es) | | Unobservable Input(s) | | Range(s) (Weighted Average(a)) |
| | | | | | | |
| | | | | Public Comparable Adjustment (Including Non-Performance Risk) | | -20.1% (-20.1%) |
| | | | | Price Per Share | | $1.30 ($1.30) |
| | | | | Volatility | | 66.5% (66.5%) |
| Preferred Stock | $ | 2,091,963 | | | Hybrid Approach | | Time to Exit / Cash Flows (Years) | | 3.4 (3.4) |
| | | | | Price Per Share | | $0.21 - $8.39 ($4.55) |
| | | | | Public Comparable Adjustment (Including Non-Performance Risk) | | -84.9% - 34.8% (2.7%) |
| | | | | Volatility | | 70.0% - 93.0% (74.8%) |
| Preferred Stock | 30,740,021 | | | Income Approach | | Time to Exit / Cash Flows (Years) | | 5.0 - 6.8 (5.1) |
| | | | | Public Comparable Adjustment (Including Non-Performance Risk) | | -22.0% (-22.0%) |
| | | | | Revenue Multiples | | 3.9 (3.9) |
| | | | | Time to Exit (Years) | | 0.4 - 1.0 (1.0) |
| | | | | Discount for Lack of Marketability | | 19.1% (19.1%) |
| Preferred Stock | 10,117,809 | | | Market Approach | | Price Per Share | | $0.68 - $2.50 ($2.09) |
| Bridge Notes | 106,250 | | | Income Approach | | Estimated Value to Cost Ratio at Payout | | 0.25 - 1.00 (0.60) |
| | | | | Revenue Multiples | | 3.9 (3.9) |
| | | | | Time to Exit (Years) | | 0.4 - 1.0 (1.0) |
| | | | | Discount for Lack of Marketability | | 19.1% (19.1%) |
| Bridge Notes | 1,348,998 | | | Market Approach | | Estimated Value to Cost Ratio at Conversion | | 1.00 (0.83) |
| | | | | Public Comparable Adjustment (Including Non-Performance Risk) | | -25.0% - 6.6% (-13.8%) |
| | | | | Volatility | | 70.0% - 74.5% (73.4%) |
| | | | | Time to Exit (Years) | | 5.0 (5.0) |
| Common Stock | 1,018,118 | | | Income Approach | | Price Per Share | | $0.21 - $1.00 ($0.52) |
| | | | | Volatility | | 71.7% (71.7%) |
| | | | | Revenue Multiples | | 1.3 (1.3) |
| | | | | Time to Exit (Years) | | 0.8 (0.8) |
| Common Stock | 0 | | | Market Approach | | Discount for Lack of Marketability | | 14.7% (14.7%) |
| | | | | Price Per Share | | $0.00 - $1.13 ($1.13) |
| | | | | Volatility | | 123.9% (123.9%) |
| Warrants | 3 | | | Income Approach | | Time to Exit (Years) | | 5.1 (5.1) |
| Warrants | 0 | | | Market Approach | | Price Per Share | | $0.00 ($0.00) |
| | | | | Revenue Multiple | | 1.3x (1.3x) |
| | | | | Exit Date | | 0.8 (0.8) |
| | | | | Volatility Rate | | 71.7% (71.7%) |
| Senior Secured Debt | 0 | | | Market Approach | | Discount for Lack of Marketability | | 14.7% (14.7%) |
| LLC Interests | 147,330 | | | Market Approach | | Bid/Ask | | $50,000-$250,000 ($150,000) |
| | | | | | | |
| | | | | | | | | | | | | | | | | | | | | | | |
| Fair Value as of 12/31/2019 | | Valuation Approach(es) | | Unobservable Input(s) | | Range(s) (Weighted Average(a)) |
| | | | | Discount for Lack of Marketability | | 14.8% (14.8%) |
| | | | | Volatility | | 71.6% (71.6%) |
| Stock Options | $ | 61,514 | | | Income Approach | | Time to Exit (Years) | | 9.2 - 9.4 (9.2) |
| | | | | Probability of Achieving Independent Milestones | | 0.0% - 75.0% (69.9%) |
| | | | | Probability of Achieving Dependent Milestones | | 3.1% - 56.3% (40.9%) |
| Rights to Payments | 1,795,316 | | | Income Approach | | Time to Cash Flows (Years) | | 0.1 - 9.0 (6.2) |
| Total | $ | 47,427,322 | | | | | | | |
(a) Weighted average based on fair value at December 31, 2019.
Valuation Methodologies and Inputs for Level 3 Assets
The following sections describe the valuation techniques and significant unobservable inputs used to measure Level 3 assets.
Preferred Stock, Preferred Units, LLC Interests, Bridge Notes and Common Stock
Preferred stock, preferred units, LLC interests, bridge notes and common stock are valued by either a market, income or hybrid approach using internal models with inputs, most of which are not market observable. Common inputs for valuing Level 3 investments include prices from recently executed private transactions in a company’s securities or unconditional firm offers, revenue multiples of comparable publicly traded companies, merger and acquisition ("M&A") transactions consummated by comparable companies, discounts for lack of marketability, rights and preferences of the class of securities we own as compared with other classes of securities the portfolio company has issued, particularly related to potential liquidity scenarios of an initial public offering ("IPO") or an acquisition transaction, estimated time to exit, volatilities of comparable publicly traded companies and management’s best estimate of risk attributable to non-performance risk. Certain securities are valued using the present value of future cash flows.
We may also consider changes in market values for sets of comparable companies when recent private transaction information is not available and/or in consideration of non-performance risk. We define non-performance risk as the risk that the price per share (or implied valuation of a portfolio company) or the effective yield of a debt security of a portfolio company, as applicable, does not appropriately represent the risk that a portfolio company with negative cash flow will be: (a) unable to raise capital, will need to be shut down and will not return our invested capital; or (b) able to raise capital, but at a valuation significantly lower than the implied post-money valuation of the last round of financing. We assess non-performance risk for each private portfolio company quarterly. Our assessment of non-performance risk typically includes an evaluation of the financial condition and operating results of the company, the company's progress towards milestones, and the long-term potential of the business and technology of the company and how this potential may or may not affect the value of the shares owned by us. An increase to the non-performance risk or a decrease in the private offering price of a future round of financing from that of the most recent round would result in a lower fair value measurement and/or a change in the distribution of value among the classes of securities we own.
Option pricing models place a high weighting on liquidation preferences, which means that small differences in how the preferences are structured can have a material effect on the fair value of our securities at the time of valuation and also on future valuations should additional rounds of financing occur with senior preferences. As such, valuations calculated by option pricing models may not increase if 1) rounds of financing occur at higher prices per share, 2) liquidation preferences include multiples on investment, 3) the amount of invested capital is small and/or 4) liquidation preferences are senior to prior rounds of financing. Additionally, an increase in the volatility assumption generally increases the enterprise value calculated in an option pricing model. An increase in the time to exit assumption also generally increases the enterprise value calculated in an option pricing model. Variations in the expected time to exit or expected volatility assumptions have a significant impact on fair value.
Bridge notes commonly contain terms that provide for the conversion of the full amount of principal, and sometimes interest, into shares of preferred stock at a defined price per share and/or the price per share of the next round of financing. The use of a discount for non-performance risk in the valuation of bridge notes would indicate the potential for conversion of only a portion of the principal, plus interest when applicable, into shares of preferred stock or the potential that a conversion event will not occur and that the likely outcome of a liquidation of assets would result in payment of less than the remaining principal outstanding of the note. An increase in non-performance risk would result in a lower fair value measurement.
Warrants and Stock Options
We use the Black-Scholes-Merton option-pricing model to determine the fair value of warrants and stock options held in our portfolio unless there is a publicly traded active market for such warrants and options or another indication of value such as a sale of the portfolio company. Option pricing models, including the Black-Scholes-Merton model, require the use of subjective input assumptions, including expected volatility, expected life, expected dividend rate, and expected risk-free rate of return. In the Black-Scholes-Merton model, variations in the expected volatility or expected term assumptions have a significant impact on fair value. Because certain securities underlying the warrants in our portfolio are not publicly traded, many of the required input assumptions are more difficult to estimate than they would be if a public market for the underlying securities existed.
An input to the Black-Scholes-Merton option-pricing model is the value per share of the type of stock for which the warrant is exercisable as of the date of valuation. This input is derived according to the methodologies discussed in "Preferred Stock, Preferred Units, LLC Interests, Bridge Notes and Common Stock."
Rights to Payments
Rights to payments are valued using a probability-weighted discounted cash flow model. As part of Amgen Inc.’s acquisition of our former portfolio company, BioVex Group, Inc., we are entitled to potential future milestone payments based upon the achievement of certain regulatory and sales milestones. We are also entitled to future payments from Xenio Holdings, Inc., which merged with one of our former portfolio companies, Xenio Systems, Inc., in the event of a sale of Xenio Holdings, Inc. We assign probabilities to the achievements of the various milestones. Milestones identified as independent milestones can be achieved irrespective of the achievement of other contractual milestones. Dependent milestones are those that can only be achieved after another, or series of other, milestones are achieved. The interest rates used in these models are observable inputs from sources such as the published interest rates for corporate bonds of the acquiring or comparable companies. In conjunction with the sale of TheStreet, Inc. ("TST") to TheMaven, Inc. ("MVEN"), the Company received a contingent value right for its pro rata share of a potential distribution from the release of escrowed funds after January 31, 2020, related to the sale of a portion of TST's business prior to the acquisition by MVEN.
Senior Secured Debt
We currently hold investments in senior secured debt securities. We value these securities either by an income or market approach. The income approach uses valuation techniques to convert future amounts (for example, cash flows or earnings) to a single present value amount (discounted). The measurement is based on the value indicated by current market expectations about those future amounts. Common inputs for valuing Level 3 debt investments include: the effective yield of the debt investment or, in the case where we have received warrant coverage, the warrant-adjusted effective yield of the security, adjustments for changes in the yields of comparable publicly traded high-yield debt funds and risk-free interest rates and an assessment of non-performance risk. For debt investments valued by the income approach, an increase in yields would result in a lower fair value measurement. Furthermore, yields would decrease, and value would increase, if the company is exceeding targets and risk has been substantially reduced from the level of risk that existed at the time of investment. Yields would increase, and values would decrease, if the company is failing to meet its targets and risk has been increased from the level of risk that existed at the time of investment. The market approach distributes an estimated value of the entity through the liquidation waterfall to derive value. Common inputs for valuing by the market approach include: multiples of publicly traded comparable companies, time to expected return/exit, discounts for lack of marketability and probability weighted expected return models.
Changes in Valuation Approaches
During the year ended December 31, 2019, the following changes in valuation methodology occurred since December 31, 2018:
•We changed the valuation methodology of our securities of Phylagen, Inc., from the income approach to the market approach owing to a sale of shares in a secondary market transaction.
•We changed the valuation methodology of our securities of Nanosys, Inc., from the income approach to the market approach to reflect a change in the status of the business.
•We changed the valuation methodology of our unsecured convertible bridge note in Essential Health Solutions, Inc., from the market approach to the income approach to reflect our election to have the note repaid instead of converting into equity of the company.
The following chart shows the components of change in the financial assets categorized as Level 3 for the year ended December 31, 2019.
| | | | | | | | | | | | | | | | | | | | | | | | | | | | | | | | | | | | | | | | | | | | | | | |
| | Beginning
Balance
1/1/2019 | | Total
Realized
(Losses) Gains
Included in
Changes in
Net Assets | | Transfers | | Total
Unrealized
Appreciation (Depreciation)
Included in
Changes in
Net Assets | | Investments in
Portfolio
Companies,
Interest on
Bridge Notes,
and
Amortization
of Loan
Fees, Net | | Disposals
and
Settlements | | Ending
Balance
12/31/2019 | | Amount of Total
Appreciation (Depreciation) for the
year Included in
Changes in Net
Assets Attributable
to the Change in
Unrealized Gains or
Losses Relating to
Assets Still Held at
the Reporting Date |
| | | | | | | | | | | | | | | |
| Preferred Stock | $ | 45,226,020 | | | $ | (1,642,663) | | 1 | | $ | 0 | | | $ | (674,294) | | | $ | 100,000 | | | $ | (59,270) | | | $ | 42,949,793 | | | $ | (2,317,545) | |
| | | | | | | | | | | | | | | |
| Bridge Notes | 1,421,280 | | | (131,321) | | 1 | | 0 | | | (379,872) | | | 795,446 | | | (250,285) | | | 1,455,248 | | | (509,703) | |
| | | | | | | | | | | | | | | |
| Common Stock | 933,963 | | | 0 | | | 0 | | | 84,155 | | | 0 | | | 0 | | | 1,018,118 | | | 84,155 | |
| | | | | | | | | | | | | | | |
| Warrants | 32,089 | | | (26,357) | | 1 | | 0 | | | (5,729) | | | 0 | | | 0 | | | 3 | | | (31,844) | |
| | | | | | | | | | | | | | | |
| Senior Secured Debt | 76,863 | | | 0 | | | 0 | | | (286,949) | | | 210,086 | | | 0 | | | 0 | | | (286,949) | |
| | | | | | | | | | | | | | | |
| LLC Interests | 150,000 | | | 0 | | | 0 | | | (2,670) | | | 0 | | | 0 | | | 147,330 | | | (2,670) | |
| | | | | | | | | | | | | | | |
| Stock Options | 69,163 | | | 0 | | | 0 | | | (7,649) | | | 0 | | | 0 | | | 61,514 | | | 61,514 | |
| | | | | | | | | | | | | | | |
| Rights to Payments | 2,019,283 | | | 0 | | | 0 | | | (245,185) | | | 21,218 | | | 0 | | | 1,795,316 | | | (245,185) | |
| | | | | | | | | | | | | | | |
| Total | $ | 49,928,661 | | | $ | (1,800,341) | | | $ | 0 | | | $ | (1,518,193) | | | $ | 1,126,750 | | | $ | (309,555) | | | $ | 47,427,322 | | | $ | (3,248,227) | |
1 Represents gross realized losses.
We elected to use beginning of the year values to recognize transfers in and out of Level 3 investments, when transfers occur.
NOTE 5. INDUSTRY DIVERSIFICATION
The following table shows the percentage of our net assets invested by industry as of December 31, 2019.
| | | | | | | | | | | | | | | | | | | | | | | |
| Industry | Value as of December 31, 2019 | | % of Net Assets | | | Value as of December 31, 2019 | | % of Net Assets | |
| Application Software | | | | | $ | 2,525,959 | | | 2.7% | |
| Unaffiliated Portfolio Companies | $ | 0 | | | 0.0% | | | | | |
| Non-Controlled Affiliated Portfolio Companies | 2,525,959 | | | 2.7% | | | | | |
| Controlled Affiliated Portfolio Companies | 0 | | | 0.0% | | | | | |
| Asset Management & Custody Banks | | | | | 147,330 | | | 0.2% | |
| Unaffiliated Portfolio Companies | 147,330 | | | 0.2% | | | | | |
| Non-Controlled Affiliated Portfolio Companies | 0 | | | 0.0% | | | | | |
| Controlled Affiliated Portfolio Companies | 0 | | | 0.0% | | | | | |
| Biotechnology | | | | | 2,351,251 | | | 2.5% | |
| Unaffiliated Portfolio Companies | 2,351,251 | | | 2.5% | | | | | |
| Non-Controlled Affiliated Portfolio Companies | 0 | | | 0.0% | | | | | |
| Controlled Affiliated Portfolio Companies | 0 | | | 0.0% | | | | | |
| Communications Equipment | | | | | 5,363,373 | | | 5.6% | |
| Unaffiliated Portfolio Companies | 5,363,373 | | | 5.6% | | | | | |
| Non-Controlled Affiliated Portfolio Companies | 0 | | | 0.0% | | | | | |
| Controlled Affiliated Portfolio Companies | 0 | | | 0.0% | | | | | |
| Electronic Equipment & Instruments | | | | | 1,849,294 | | | 1.9% | |
| Unaffiliated Portfolio Companies | 1,849,294 | | | 1.9% | | | | | |
| Non-Controlled Affiliated Portfolio Companies | 0 | | | 0.0% | | | | | |
| Controlled Affiliated Portfolio Companies | 0 | | | 0.0% | | | | | |
| Fertilizers & Agricultural Chemicals | | | | | | | 15,591,814 | | | 16.4% | |
| Unaffiliated Portfolio Companies | 15,591,814 | | | 16.4% | | | | | | | |
| Non-Controlled Affiliated Portfolio Companies | 0 | | | 0.0% | | | | | | | |
| Controlled Affiliated Portfolio Companies | 0 | | | 0.0% | | | | | | | |
| Financial Exchanges & Data | | | | | 21,218 | | | 0.0% | |
| Unaffiliated Portfolio Companies | 21,218 | | | 0.0% | | | | | |
| Non-Controlled Affiliated Portfolio Companies | 0 | | | 0.0% | | | | | |
| Controlled Affiliated Portfolio Companies | 0 | | | 0.0% | | | | | |
| Health Care Equipment | | | | | 2,414,392 | | | 2.5% | |
| Unaffiliated Portfolio Companies | 0 | | | 0.0% | | | | | |
| Non-Controlled Affiliated Portfolio Companies | 2,414,392 | | | 2.5% | | | | | |
| Controlled Affiliated Portfolio Companies | 0 | | | 0.0% | | | | | |
| Health Care Technology | | | | | 8,794,158 | | | 9.2% | |
| Unaffiliated Portfolio Companies | 56,250 | | | 0.0% | | | | | |
| Non-Controlled Affiliated Portfolio Companies | 8,737,908 | | | 9.2% | | | | | |
| Controlled Affiliated Portfolio Companies | 0 | | | 0.0% | | | | | |
| Interactive Media & Services | | | | | 10,159,731 | | | 10.7% | |
| Unaffiliated Portfolio Companies | 0 | | | 0.0% | | | | | |
| Non-Controlled Affiliated Portfolio Companies | 10,159,731 | | | 10.7% | | | | | |
| Controlled Affiliated Portfolio Companies | 0 | | | 0.0% | | | | | |
| | | | | | | |
| | | | | | | |
| | | | | | | | | | | | | | | | | | | | | | | |
| Industry | Value as of December 31, 2019 | | % of Net Assets | | | Value as of December 31, 2019 | | % of Net Assets | |
| Life Sciences Tools & Services | | | | | $ | 4,055,698 | | | 4.3% | |
| Unaffiliated Portfolio Companies | 0 | | | 0.0% | | | | | |
| Non-Controlled Affiliated Portfolio Companies | $ | 4,055,698 | | | 4.3% | | | | | |
| Controlled Affiliated Portfolio Companies | 0 | | | 0.0% | | | | | |
| Pharmaceuticals | | | | | 3,597,836 | | | 3.8% | |
| Unaffiliated Portfolio Companies | 3,597,836 | | | 3.8% | | | | | |
| Non-Controlled Affiliated Portfolio Companies | 0 | | | 0.0% | | | | | |
| Controlled Affiliated Portfolio Companies | 0 | | | 0.0% | | | | | |
| Research & Consulting Services | | | | | 578,366 | | | 0.6% | |
| Unaffiliated Portfolio Companies | 374,689 | | | 0.4% | | | | | |
| Non-Controlled Affiliated Portfolio Companies | 203,677 | | | 0.2% | | | | | |
| Controlled Affiliated Portfolio Companies | 0 | | | 0.0% | | | | | |
| Restaurants | | | | | 4,735,047 | | | 5.0% | |
| Unaffiliated Portfolio Companies | 4,735,047 | | | 5.0% | | | | | |
| Non-Controlled Affiliated Portfolio Companies | 0 | | | 0.0% | | | | | |
| Controlled Affiliated Portfolio Companies | 0 | | | 0.0% | | | | | |
| Semiconductors | | | | | 2,038,297 | | | 2.2% | |
| Unaffiliated Portfolio Companies | 1,677,832 | | | 1.8% | | | | | |
| Non-Controlled Affiliated Portfolio Companies | 360,465 | | | 0.4% | | | | | |
| Controlled Affiliated Portfolio Companies | 0 | | | 0.0% | | | | | |
| Specialty Chemicals | | | | | 2,494,583 | | | 2.6% | |
| Unaffiliated Portfolio Companies | 2,003,596 | | | 2.1% | | | | | |
| Non-Controlled Affiliated Portfolio Companies | 490,987 | | | 0.5% | | | | | |
| Controlled Affiliated Portfolio Companies | 0 | | | 0.0% | | | | | |
| Technology Hardware, Storage & Peripherals | | | | | 20,524,184 | | | 21.6% | |
| Unaffiliated Portfolio Companies | 20,524,184 | | | 21.6% | | | | | |
| Non-Controlled Affiliated Portfolio Companies | 0 | | | 0.0% | | | | | |
| Controlled Affiliated Portfolio Companies | 0 | | | 0.0% | | | | | |
| Total | $ | 87,242,531 | | | | | $ | 87,242,531 | | | |
NOTE 6. DERIVATIVES
At December 31, 2019, we had rights to milestone payments from Amgen, Inc.’s acquisition of our former portfolio company, BioVex Group, Inc. These rights to milestone payments were fair valued at $1,774,098 as of December 31, 2019. At December 31, 2019, the outstanding contingent value right from TheStreet, Inc., were valued at $21,218. At December 31, 2019, we had rights to payments from Xenio Holdings, Inc.'s merger with Xenio Systems, Inc. These rights to payments were fair valued at $0 as of December 31, 2019.
We also purchased and sold put options during the year. A put option gives its holder the right to sell a specific security at a specific price (known as the exercise strike price) by a certain date.
Transactions in put options during the year ended December 31, 2019, were as follows:
| | | | | | | | | | | | | | |
| | Number of Contracts | | | Premium | |
| | | | |
| Put options outstanding as of December 31, 2018 | | 0 | | | $ | 0 | |
| Put options purchased | | (1,100) | | | (720,543) | |
| Put options written | | 1,100 | | | 467,452 | |
| Put options expired | | 0 | | | 0 | |
| Purchased put options terminated in closing transactions | | 1,100 | | | 1,029,701 | |
| Written put options terminated in closing transactions | | (1,100) | | | (662,408) | |
| Put options outstanding as of December 31, 2019 | | 0 | | | $ | 114,202 | |
The following tables present the value of derivatives held at December 31, 2019, and the effect of derivatives held during the year the year ended December 31, 2019, along with the respective location in the Company's Consolidated Financial Statements.
Consolidated Statement of Assets and Liabilities:
| | | | | | | | | | | | | | | | | | | | | | | | | | |
| | | Assets | | | | Liabilities | | |
| Derivatives Instruments - Unaffiliated Rights to Payments | | Location | | Fair Value | | Location | | Fair Value |
| | | | | | | | |
| Amgen, Inc. Rights to Milestones Payments from Acquisition of BioVex Group, Inc. | | Investments | | $ | 1,774,098 | | | -- | | | -- | |
| | | | | | | | |
| TheStreet, Inc., Contingent Value Right | | Investments | | $ | 21,218 | | | -- | | | -- | |
| | | | | | | | |
| Xenio Holdings, Inc. Rights to Potential Payments from Merger with Xenio Systems, Inc. | | Investments | | $ | 0 | | | -- | | | -- | |
| | | | | | | | |
| Total | | | | $ | 1,795,316 | | | | | |
Consolidated Statement of Operations:
| | | | | | | | | | | | | | | | | | | | |
| Derivatives Instruments | | Location | | Net Realized
Gain/(Loss) | | Net Change in Unrealized Appreciation
(Depreciation) |
| | | | | | |
| Amgen, Inc. Rights to Milestones Payments from Acquisition of BioVex Group, Inc. | | Net Change in Unrealized Appreciation on Investments | | -- | | | $ | (245,185) | |
| | | | | | |
| TheStreet, Inc., Contingent Value Right | | Net Change in Unrealized Appreciation on Investments | | -- | | | $ | 0 | |
| | | | | | |
| Xenio Holdings, Inc. Rights to Potential Payments from Merger with Xenio Systems, Inc. | | Net Change in Unrealized Appreciation on Investments | | -- | | | $ | 0 | |
| | | | | | |
| Exchange Traded Fund Options | | Net Realized Gain from Investments | | $ | 114,202 | | | -- | |
| | | | | | |
| Total | | | | $ | 114,202 | | | $ | (245,185) | |
NOTE 7. OFFICERS' AND BOARD OF DIRECTORS' COMPENSATION
The aggregate compensation (salaries, bonus, 401(k) employer match, medical and dental benefits) paid by the Company during the year ended December 31, 2019, to its officers amounted to $3,363,107, including $2,091,005 in bonuses paid in 2019. In addition, and similar to prior years, the Compensation Committee awarded a deferred bonus as of December 31, 2019, to certain of the Company's officers of $763,927 payable only upon achievement of certain metrics defined by the Compensation Committee over the next two years. As of December 31, 2019, $317,030 related to this deferred bonus was included in accounts payable, which represents the time-elapsed portion of the deferred bonus accrued on a straight-line basis through December 31, 2019 based on each metric measurement date. The Compensation Committee also determined that the metrics for payment of $173,250 of the deferred compensation from 2017 were met as of December 31, 2019. The 2019 expense of $57,172 represents the additional time-elapsed portion of the 2017 deferred bonus accrued on a straight-line basis during the year ended December 31, 2019, based on the metric measurement date.
The aggregate compensation paid by the Company to the independent members of its Board of Directors during the year ended December 31, 2019 was $277,500.
Certain officers and directors currently and may in the future serve as members of the board of directors of our portfolio companies, including our controlled portfolio companies. These officers and directors do not receive any compensation for serving in such roles directly from the portfolio companies. Any such cash compensation paid by portfolio companies to members of their respective boards of directors is paid directly to the Company. In the case of securities-based compensation (restricted stock or stock options), the officer or director due such compensation assigns all beneficial interest, including but not limited to economic benefit and voting control, to such securities over to the Company.
NOTE 8. EMPLOYEE BENEFITS
401(k) Plan
We adopted a 401(k) Plan covering substantially all of our employees. Matching contributions to the plan are at the discretion of the Compensation Committee. For the year ended December 31, 2019, the Compensation Committee approved a 100 percent match, which amounted to approximately $88,000.
Medical Benefit Retirement Plan
We historically administered a plan to provide medical and dental insurance for retirees and their spouses who, at the time of their retirement, attained certain years of service with us and a certain age (the "Medical Benefit Retirement Plan"). On April 27, 2017, the Board of Directors terminated the plan. The termination does not affect benefits accrued by former employees who are grandfathered under the former terms of the plan, and the termination of the plan does not affect benefits accrued by certain former employees who were grandfathered under the amended terms of the plan. The Medical Benefit Retirement Plan was terminated for all other employees.
The plan is unfunded and has no assets. The following disclosures about changes in the benefit obligation under the plan to provide medical and dental insurance for retirees are as of the measurement date of December 31, 2019:
| | | | | |
| 2019 |
| |
| Accumulated post-retirement benefit obligation - December 31, 2018 | $ | 963,015 | |
| Interest cost | 37,225 | |
| Actuarial loss | 130,036 | |
| Benefits paid | (53,722) | |
| Accumulated post-retirement benefit obligation - December 31, 2019 | $ | 1,076,554 | |
In accounting for the plan, the assumption made for the discount rate was 2.92 percent for the year ended December 31, 2019. The discount rate was calculated using the December 31, 2019 FTSE Pension Liability Index. The assumed health care cost trend rates is assumed to be 7.00 percent in 2020 grading down to 6.25 percent uniformly over 3 years and then following the Getzen model thereafter for medical and 5 percent per year for dental.
The effect on the medical plan disclosure information of a one percentage point change in the assumed health care cost trend rate for each future year is shown below.
| | | | | | | | | | | |
| 1% Decrease
in Rates | Assumed
Rates | 1% Increase
in Rates |
| | | |
| Aggregated service and interest cost | $ | 34,334 | | $ | 37,225 | | $ | 40,770 | |
| Accumulated post-retirement benefit obligation | $ | 985,935 | | $ | 1,076,554 | | $ | 1,184,206 | |
The net periodic post-retirement benefit cost for the year is determined as the sum of service cost for the year, interest on the accumulated post-retirement benefit obligation, and amortization of the transition obligation (asset) less previously accrued expenses over the average remaining service period of employees expected to receive plan benefits.
The following is the net periodic post-retirement benefit cost for the year ended December 31, 2019:
| | | | | |
| 2019 |
| Interest cost on accumulated post-retirement benefit obligation | $ | 37,225 | |
| Amortization of net losses | 1,314 | |
| Net periodic post-retirement benefit cost | $ | 38,539 | |
| |
The Company estimates the following benefits to be paid in each of the following years:
| | | | | |
| 2020 | $ | 58,908 | |
| 2021 | $ | 81,697 | |
| 2022 | $ | 84,368 | |
| 2023 | $ | 86,673 | |
| 2024 | $ | 88,424 | |
| 2025 through 2029 | $ | 325,515 | |
| |
For the year ended December 31, 2019, net unrecognized actuarial loss of $128,722 resulted primarily from the decrease in the discount rate, which represents $130,036 of actuarial loss arising during the year, and by a reclassification adjustment of $1,314 that increased the net periodic benefit cost for the year.
Executive Mandatory Retirement Benefit Plan
On May 5, 2011, the Board of Directors terminated the Amended and Restated Executive Mandatory Retirement Benefit Plan. Our former President accrued benefits under this plan prior to his retirement, and the termination of this plan has no impact on his accrued benefits. At December 31, 2019, we had $180,649 accrued for benefits for this former employee under the plan, which is included in "Post-retirement plan liabilities" on the Company's Consolidated Statement of Assets and Liabilities.
NOTE 9. INCOME TAXES
We filed for the 1999 tax year to elect treatment as a RIC under Subchapter M of the Code and qualified for the same treatment for the years 2000 through 2015, and in 2017. We did not qualify as a RIC under Subchapter M of the Code in 2016 and in 2018. We did not have net taxable income in 2016 and 2018, so our failure to qualify as a RIC did not result in a tax liability for the Company. We qualified as a RIC under Subchapter M of the Code in 2019. We currently intend to qualify as a RIC in subsequent tax years, but we cannot guarantee we will do so.
Under certain circumstances, even if we qualified for Subchapter M treatment for a given year, we might act in a subsequent year to ensure that we would be taxed in that subsequent year as a C Corporation, rather than as a RIC. We will fail to qualify for RIC tax treatment for a taxable year if we do not satisfy the 90 percent Income Test or Annual Distribution Requirement for such year. In the event we do not satisfy the 90 percent Income Test, the Diversification Tests or the Annual Distribution Requirement for any taxable year, we will be subject to federal tax with respect to all our taxable income, whether or not distributed. In addition to the corporate tax that would be paid by the Company, all our distributions to shareholders in that situation generally will be taxable as ordinary dividends and generally subject to up to a 30 percent withholding tax if received by a non-U.S. shareholder, although such dividends may qualify for long-term capital gain treatment as "qualified dividends" for U.S. shareholders meeting certain holding period requirements. If the aggregate values of our non-qualifying assets remain below 50 percent of total assets and no non-qualifying asset represents more than 25 percent of the total assets, we will continue to pass the Diversification Tests. Rather than selling portfolio companies that are performing well in order to pass our RIC diversification tests, we may opt instead not to qualify as a RIC. We will choose to take such action only if we believe that the result of the action will benefit the Company and our shareholders.
We note that our ownership of D-Wave Systems, Inc. is currently held through Parallel Universes, Inc., which holds shares of D-Wave Systems, Inc. through a Canadian limited company, 4169841 Canada Ltd. ("CanCo"). We have rights to seek a reorganization of D-Wave Systems, Inc. upon certain events including a sale and/or an initial public offering of the company that we currently believe will enable us to use our accumulated operating and capital loss carryforwards to offset any gains from that investment. Should we decide to sell our shares of D-Wave Systems, Inc., ahead of such reorganization or if we are not able to complete such reorganization due to changes in tax laws or other factors, our returns on investment may be decreased due to taxation at the Parallel Universes, Inc. and/or CanCo entity levels. We do not currently plan to sell our shares prior to an event that would trigger our reorganization rights.
The Company's status as a RIC is irrevocable, but qualification is measured annually. Given the Company's status as a RIC and that the ability or inability to use such operating loss carryforwards depends on qualification metrics measured in each taxable year separate from prior years, the Company does not include a deferred tax asset and valuation allowance on its Consolidated Statement of Assets and Liabilities.
For federal tax purposes, the Company’s 2016 through 2018 tax years remain open for examination by the tax authorities under the normal three-year statute of limitations. Generally, for New Jersey state tax purposes, the Company’s 2015 through 2018 tax years remain open for examination by the tax authorities under a four-year statute of limitations. The Company will file its 2019 federal and state taxes under extensions which were filed earlier in 2020.
For the year ended December 31, 2019, the Company recorded a consolidated expense of $1,267 in federal, state and local income taxes.
We pay federal, state and local taxes on behalf of Ventures, which is taxed as a C Corporation. For the year ended December 31, 2019, our income tax benefit for Ventures was $810.
With our qualification as a RIC in 2019, the Company's updated certain components of capital accounts on a tax-basis in 2019, to reflect a return of capital statement of position ("ROCSOP") adjustment. This ROCSOP adjustment includes the reclassification of $4,813,941 of accumulated net operating loss and $53,779 of accumulated net realized loss into additional paid in capital. This reclassification results primarily from certain non-deductible expenses and net operating loss. There is no impact to net asset value per share as a result of this ROCSOP adjustment. This adjustment may change in future years if the Company does not qualify as a RIC in a given tax year.
For the year ended December 31, 2019, the Company recorded aggregate unrealized appreciation of $29,574,847, aggregate unrealized depreciation of $28,683,676 and net unrealized appreciation is $891,171. The aggregate book cost of investments is $86,351,360. For the year ended December 31, 2019, the Company recorded aggregate tax unrealized appreciation of $29,460,691, aggregate tax unrealized depreciation of $28,281,195 and net tax unrealized appreciation is $1,179,496. The aggregate tax cost of investments is $86,063,035.
Post-enactment losses have no expiration date in years where we qualify as a RIC. As of December 31, 2019, we had post-enactment loss carryforwards under the provisions of the Regulated Investment Company Modernization Act of 2010 (the "Act") of $3,400,173 long term. As of December 31, 2019, we had capital losses, which were derived during years when the Company failed as a RIC, totaling $15,856,257, which may only be carried forward for 5 years.
On December 22, 2017, the Tax Cuts and Jobs Act of 2017 (the "2017 Act") was enacted, which among other changes, lowered the tax rates for corporations and how future loss carryforwards can be used against future gains. The change of the federal corporate tax rate from 35 percent to 21 percent in the 2017 Act may impact future decisions regarding the issuance of deemed dividends should the Company fail to qualify as a RIC under Subchapter M of the Code and be in a net taxable gain position on investments.
NOTE 10. COMMITMENTS
On December 12, 2019, the Company entered into a subscription agreement with B. Riley Principal Merger Corp. ("BRPM") to purchase 421,053 shares of BRPM common stock and 150,000 warrants for the purchase of BRPM common stock at a strike price of $11.50 per share for aggregate consideration of $4,000,000. The closing of this investment is subject to certain conditions and expected to close on the day immediately prior to the consummation of the merger between BRPM and Alta Equipment Holdings, Inc. ("Alta"). We invested our commitment on February 11, 2020, and the merger of BRPM with Alta closed on February 14, 2020. At closing, BRPM changed its name to Alta Equipment Group Inc., and the company's common stock and warrants trade on the NYSE under the new symbols of ALTG and ALTGW, respectively.
As of December 31, 2019, the Company has no commitment or contingencies to invest additional capital in any of its privately held portfolio companies. Portfolio companies may seek additional capital in the future and any decision by the Company to not participate in the round of financing could result in outcomes that negatively impact the value of the Company's securities of those portfolio companies.
On March 23, 2017, we signed a month-to-month lease for approximately 1,250 square feet of office space located at 7 N. Willow Street, Suite 4B, Montclair, New Jersey. Upon an event of default, the lease provides that the landlord may terminate the lease and require us to pay all rent that would have been payable during the remainder of the lease or until the date the landlord re-enters the premises.
NOTE 11. PORTFOLIO PURCHASES AND SALES
During the year ended December 31, 2019:
| | | | | | | | | | | |
| Company | Purchases/Cost | | Sales Proceeds/Distributions |
| Adesto Technologies Corporation | $ | 40,596 | | | $ | 8,261,648 | |
| Airgain, Inc. | 688,550 | | | 3,393,494 | |
| Emcore Corporation | 327,389 | | | 0 | |
| Intermolecular, Inc. | 1,548,227 | | | 3,235,135 | |
| Iteris, Inc. | 2,604,884 | | | 1,214,114 | |
| Lantronix, Inc. | 1,770,516 | | | 0 | |
| Mersana Therapeutics, Inc. | 0 | | | 1,169,363 | |
| PC-TEL, Inc. | 2,019,605 | | | 3,084,013 | |
| Potbelly Corporation | 4,835,101 | | | 0 | |
| Quantum Corporation | 5,516,172 | | | 2,237,380 | |
| Synacor, Inc. (1) | 24,077 | | | 0 | |
| TheMaven, Inc. | 8,000,000 | | | 0 | |
| TheStreet, Inc. (2) | 118,050 | | | 11,403,657 | |
| Miscellaneous Common Stocks (3)(4) | 725,593 | | | 703,164 | |
| Total Public Portfolio Purchases/Cost and Sales Proceeds/Distributions | $ | 28,218,760 | | | $ | 34,701,968 | |
| | | |
| Coba Therapeutics Corporation | $ | 0 | | | $ | 20,285 | |
| Genome Profiling LLC | 0 | | | 230,000 | |
| Lodo Therapeutics Corporation | 474,019 | | | 0 | |
| NGX Bio, Inc. | 0 | | | 34,269 | |
| Petra Pharma Corporation | 260,504 | | | 0 | |
| Phylagen, Inc. | 0 | | | 25,000 | |
| SynGlyco, Inc. | 0 | | | 12,104 | |
| TARA Biosystems, Inc. | 100,000 | | | 0 | |
| Total Private Portfolio Purchases/Cost and Sales Proceeds | $ | 834,523 | | | $ | 321,658 | |
| Total Portfolio Purchases/Cost and Sales Proceeds/Distributions | $ | 29,053,283 | | | $ | 35,023,626 | |
Note: The table above does not include purchases of short-term U.S. Treasury securities whose maturities at the time of acquisition were one year or less during the year ended December 31, 2019. The Company did not sell any such securities during the year ended December 31, 2019. The table above also does not include transactions in short-term put options whose maturities at the time of acquisition were one year or less during the year ended December 31, 2019.
(1) During the year ended December 31, 2019, the Company received restricted stock units from Synacor, Inc. ("SYNC") which were issued to the Company for Kevin Rendino's service on the Board of Directors of SYNC. These restricted stock units had a cost basis of $12,963 on the date the restricted stock units vested.
(2) During the year ended December 31, 2019, the Company received restricted stock units from TheStreet, Inc. ("TST") which were issued to the Company for Kevin Rendino's service on the Board of Directors of TST. These restricted stock units had a cost basis of $73,999, on the date the restricted stock units vested. During the year ended December 31, 2019, the Company received contingent value right for its pro rata share of a potential distribution from the release of escrowed funds from TST, which was valued at $21,218. The contingent value right is a holding of the Company and has a cost basis of $21,218.
Amounts related to restricted stock units are also presented as "Fee income for providing managerial assistance to portfolio companies-non-cash" on the Company's Consolidated Statement of Cash Flows.
(3) Miscellaneous Common Stocks are unrestricted common stocks of publicly traded companies that the Company has not disclosed publicly.
(4) The Company received a distribution of shares of common stock. These shares had a cost basis of $1,607 on the date of distribution and is also presented as "Other income-non-cash" on the Company's Consolidated Statement of Cash Flows.
NOTE 12. SHARE REPURCHASE PROGRAM
On August 1, 2019, our Board reauthorized the repurchase of up to $2.5 million of the Company's common stock within a six-month period from the date of notice to investors, which notice was mailed on or about August 16, 2019. As of December 31, 2019, no repurchases had occurred. On February 20, 2020, our Board reauthorized the repurchase of up to $2.5 million of the Company's common stock within a six-month period from the date of notice to investors, which notice was mailed on or about February 26, 2020.
NOTE 13. RELATED PARTY TRANSACTIONS
We have historically provided managerial assistance to some of our portfolio companies, including serving as members of the board of directors. In certain cases, we receive fees for providing such assistance. During the year ended December 31, 2019, we received fees totaling $89,239 in cash and $86,962 in non-cash, included in the Company's Consolidated Statement of Operations in "Fee income for providing managerial assistance to portfolio companies."
NOTE 14. INVESTMENTS IN AND ADVANCES TO AFFILIATES - SCHEDULE 12-14
| | | | | | | | | | | | | | | | | | | | | | | | | | | | | | | | | | | | | | | | | | | | | | | | | | |
| Name of Issuer | | Title of Issue or Nature of Indebtedness (A) | | Amount of Dividends or Interest Credited to Income (B) | | Net Realized Gain (Loss) | | Value as of December 31, 2018 | | Gross Additions (C) | | Gross Reductions (D) | | Net Change in Unrealized Appreciation (Depreciation) | | Value as of December 31, 2019 |
| NON-CONTROLLED AFFILIATED PRIVATELY HELD COMPANIES(E): | | | | | | | | | | | | | | | | |
| ABSMaterials, Inc. | | Series A Convertible Preferred Stock | | $ | 0 | | | $ | 0 | | | $ | 15,864 | | | $ | 6,433 | | | $ | 0 | | | $ | 6,433 | | | $ | 22,297 | |
| | Series B Convertible Preferred Stock | | 0 | | | 0 | | | 286,562 | | | 19,994 | | | 0 | | | 19,994 | | | 306,556 | |
| | Secured Convertible Bridge Note | | 10,000 | | | 0 | | | 152,134 | | | 10,000 | | | 0 | | | 0 | | | 162,134 | |
| Black Silicon Holdings, Inc. | | Series A Convertible Preferred Stock | | $ | 0 | | | $ | 0 | | | $ | 0 | | | $ | 0 | | | $ | 0 | | | $ | 0 | | | $ | 0 | |
| | Series A-1 Convertible Preferred Stock | | 0 | | | 0 | | | 0 | | | 0 | | | 0 | | | 0 | | | 0 | |
| | Series A-2 Convertible Preferred Stock | | 0 | | | 0 | | | 0 | | | 0 | | | 0 | | | 0 | | | 0 | |
| | Series B-1 Convertible Preferred Stock | | 0 | | | 0 | | | 0 | | | 0 | | | 0 | | | 0 | | | 0 | |
| | Series C Convertible Preferred Stock | | 0 | | | 0 | | | 0 | | | 0 | | | 0 | | | 0 | | | 0 | |
| | Secured Convertible Bridge Notes (F) | | 0 | | | 0 | | | 476,187 | | | 0 | | | (115,722) | | | (115,722) | | | 360,465 | |
| Coba Therapeutics Corporation | | Convertible Bridge Note (G) | | $ | 0 | | | $ | (131,321) | | | $ | 21,776 | | | $ | 0 | | | $ | (21,776) | | | $ | 129,830 | | | $ | 0 | |
| EchoPixel, Inc. | | Series Seed Convertible Preferred Stock | | $ | 0 | | | 0 | | $ | 1,201,023 | | | $ | 168,531 | | | $ | 0 | | | $ | 168,531 | | | $ | 1,369,554 | |
| | Series Seed-2 Convertible Preferred Stock | | 0 | | | 0 | | | 429,732 | | | 58,620 | | | 0 | | | 58,620 | | | 488,352 | |
| | Series A-2 Convertible Preferred Stock | | 0 | | | 0 | | | 499,616 | | | 56,870 | | | 0 | | | 56,870 | | | 556,486 | |
| Essential Health Solutions, Inc. | | Common Stock | | $ | 0 | | | $ | 0 | | | $ | 128,339 | | | $ | 15,010 | | | $ | 0 | | | $ | 15,010 | | | $ | 143,349 | |
| | Series A Convertible Preferred Stock | | 0 | | | 0 | | | 2,781,300 | | | 86,834 | | | 0 | | | 86,834 | | | 2,868,134 | |
| | Convertible Bridge Note (H) | | 4,001 | | | 0 | | | 50,142 | | | 0 | | | (142) | | | 0 | | | 50,000 | |
| HALE.life Corporation | | Common Stock | | $ | 0 | | | $ | 0 | | | $ | 146,462 | | | $ | 0 | | | $ | (29,446) | | | $ | (29,446) | | | $ | 117,016 | |
| | Series Seed-1 Convertible Preferred Stock | | 0 | | | 0 | | | 2,147,894 | | | 0 | | | (534,234) | | | (534,234) | | | 1,613,660 | |
| | Series Seed-2 Convertible Preferred Stock | | 0 | | | 0 | | | 2,500,871 | | | 0 | | | (647,085) | | | (647,085) | | | 1,853,786 | |
| | | | | | | | | | | | | | | | |
| | | | | | | | | | | | | | | | | | | | | | | | | | | | | | | | | | | | | | | | | | | | | | | | | | |
| Name of Issuer | | Title of Issue or Nature of Indebtedness (A) | | Amount of Dividends or Interest Credited to Income (B) | | Net Realized Gain (Loss) | | Value as of December 31, 2018 | | Gross Additions (C) | | Gross Reductions (D) | | Net Change in Unrealized Appreciation (Depreciation) | | Value as of December 31, 2019 |
| NON-CONTROLLED AFFILIATED PRIVATELY HELD COMPANIES(E): | | | | | | | | | | | | | | | | |
| NGX Bio, Inc. | | Series Seed Convertible Preferred Stock | | $ | 0 | | | $ | (486,261) | | | $ | 17,273 | | | $ | 0 | | | $ | (17,273) | | | $ | 482,729 | | | $ | 0 | |
| | Series Seed 2 Convertible Preferred Stock | | 0 | | | (493,197) | | | 8,550 | | | 0 | | | (8,550) | | | 491,448 | | | 0 | |
| | Series Seed 3 Convertible Preferred Stock | | 0 | | | (672,602) | | | 17,256 | | | 0 | | | (17,256) | | | 669,073 | | | 0 | |
| ORIG3N, Inc. | | Series 1 Convertible Preferred Stock | | $ | 0 | | | $ | 0 | | | $ | 1,232,502 | | | $ | 0 | | | $ | (347,302) | | | $ | (347,302) | | | $ | 885,200 | |
| | Series A Convertible Preferred Stock | | 0 | | | 0 | | | 1,431,936 | | | 0 | | | (371,435) | | | (371,435) | | | 1,060,501 | |
| | Series A-2 Convertible Preferred Stock | | 0 | | | 0 | | | 189,592 | | | 0 | | | (43,330) | | | (43,330) | | | 146,262 | |
| Produced Water Absorbents, Inc. | | Warrants for Common Stock | | $ | 0 | | | $ | 0 | | | $ | 0 | | | $ | 0 | | | $ | 0 | | | $ | 0 | | | $ | 0 | |
| | Common Stock | | 0 | | | 0 | | | 0 | | | 0 | | | 0 | | | 0 | | | 0 | |
| | Senior Secured Debt (I) | | (448,679) | | | 0 | | | 76,863 | | | 0 | | | (76,863) | | | (286,949) | | | 0 | |
| TARA Biosystems, Inc. | | Common Stock | | $ | 0 | | | 0 | | $ | 659,162 | | | $ | 98,591 | | | $ | 0 | | | $ | 98,591 | | | $ | 757,753 | |
| | Series A Convertible Preferred Stock | | 0 | | | 0 | | | 2,842,393 | | | 354,490 | | | 0 | | | 354,490 | | | 3,196,883 | |
| | Series A-2 Convertible Preferred Stock | | 0 | | | 0 | | | 0 | | | 101,062 | | | 0 | | | 1,062 | | | 101,062 | |
| Total Non-Controlled Affiliated Privately Held Companies | | | | $ | (434,678) | | | $ | (1,783,381) | | | $ | 17,313,429 | | | $ | 976,435 | | | $ | (2,230,414) | | | $ | 264,012 | | | $ | 16,059,450 | |
| NON-CONTROLLED AFFILIATED PUBLICLY TRADED SECURITIES(E): | | | | | | | | | | | | | | | | |
| Intermolecular, Inc. | | Common Stock | | $ | 0 | | | $ | 358,246 | | | $ | 1,425,846 | | | $ | 0 | | | $ | (1,425,846) | | | $ | (97,184) | | | $ | 0 | |
| Synacor, Inc. | | Common Stock | | $ | 0 | | | $ | 0 | | | $ | 2,361,053 | | | $ | 89,008 | | | $ | 0 | | | $ | 64,930 | | | $ | 2,450,061 | |
| | Stock Options | | 0 | | | 0 | | | 0 | | | 61,514 | | | 0 | | | 61,514 | | | 61,514 | |
| | Restricted Stock Units | | 0 | | | 0 | | | 0 | | | 14,384 | | | 0 | | | 14,384 | | | 14,384 | |
| TheMaven, Inc. | | Series H Convertible Preferred Stock | | $ | 0 | | | $ | 0 | | | $ | 0 | | | $ | 2,647,689 | | | $ | 0 | | | $ | 647,689 | | | $ | 2,647,689 | |
| | Series I Convertible Preferred Stock | | 0 | | | 0 | | | 0 | | | 6,615,833 | | | 0 | | | 1,615,833 | | | 6,615,833 | |
| | Series J Convertible Preferred Stock | | 0 | | | 0 | | | 0 | | | 896,209 | | | 0 | | | (103,791) | | | 896,209 | |
| TheStreet, Inc. | | Common Stock | | $ | 0 | | | $ | 6,357,095 | | | $ | 9,477,161 | | | $ | 0 | | | $ | (9,477,161) | | | $ | (4,527,427) | | | $ | 0 | |
| | Stock Options | | 0 | | | 0 | | | 4,495 | | | 0 | | | (4,495) | | | (4,495) | | | 0 | |
| | Restricted Stock Units | | 0 | | | 0 | | | 64,668 | | | 0 | | | (64,668) | | | (64,668) | | | 0 | |
| | | | | | | | | | | | | | | | |
| | | | | | | | | | | | | | | | | | | | | | | | | | | | | | | | | | | | | | | | | | | | | | | | | | |
| Name of Issuer | | Title of Issue or Nature of Indebtedness (A) | | Amount of Dividends or Interest Credited to Income (B) | | | Net Realized Gain (Loss) | | | Value as of December 31, 2018 | | | Gross Additions (C) | | | Gross Reductions (D) | | | Net Change in Unrealized Appreciation (Depreciation) | | | Value as of December 31, 2019 | |
| Total Non- Controlled Affiliated Publicly Traded Securities | | | | $ | 0 | | | $ | 6,715,341 | | | $ | 13,333,223 | | | $ | 10,324,637 | | | $ | (10,972,170) | | | $ | (2,393,215) | | | $ | 12,685,690 | |
| Total Non- Controlled Affiliated Privately Held Companies and Publicly Traded Securities | | | | $ | (434,678) | | | $ | 4,931,960 | | | $ | 30,646,652 | | | $ | 11,301,072 | | | $ | (13,202,584) | | | $ | (2,129,203) | | | $ | 28,745,140 | |
| | | | | | | | | | | | | | | | |
| EQUITY METHOD PRIVATELY HELD COMPANY: | | | | | | | | | | | | | | | | |
| Accelerator IV-New York Corporation | | Series A Common Stock | | $ | 0 | | | $ | 0 | | | $ | 246,229 | | | $ | 0 | | | $ | (42,552) | | | $ | 0 | | | $ | 203,677 | |
| Total Equity Method Privately Held Company | | | | $ | 0 | | | $ | 0 | | | $ | 246,229 | | | $ | 0 | | | $ | (42,552) | | | $ | 0 | | | $ | 203,677 | |
(A)Common stock, warrants, membership units and, in some cases, preferred stock are generally non-income producing and restricted. The principal amount of debt and the number of shares of common and preferred stock and number of membership units are shown in the accompanying Consolidated Schedule of Investments as of December 31, 2019.
(B)Represents the total amount of interest or dividends and yield enhancing fees on debt securities credited/(debited) to income for the portion of the year an investment was a control or affiliate investment, as appropriate. Amounts credited to preferred or common stock represent accrued bridge note interest related to conversions that occurred during the year ended December 31, 2019.
(C)Gross additions include increases in investments resulting from new portfolio investments, paid-in-kind interest or dividends, the amortization of discounts and fees. Gross additions also include net increases in unrealized appreciation or decreases in unrealized depreciation.
(D)Gross reductions include decreases in investments resulting from principal collections related to investment repayments or sales, the amortization of premiums and acquisition costs. Gross reductions also include net increases in unrealized depreciation or decreases in unrealized appreciation.
(E)"Non-Controlled Affiliated" is defined as ownership of five percent or more, but less than 25 percent, of the voting shares of the portfolio company, or where we hold the right to appoint one or more members to the portfolio company’s board of directors, but less than 25 percent of the members of the board of directors.
(F)Debt security is on non-accrual status as of April 1, 2018 and, therefore, is considered non-income producing as of the year ended December 31, 2019.
(G)Debt security was on non-accrual status as of January 1, 2019 and, was considered non-income producing prior the Company receiving a liquidating distribution in May 2019.
(H)Accrued interest on debt security was reclassified from PIK to cash during the year ended December 31, 2019.
(I)Debt security is on non-accrual status as of July 1, 2018.
* Information related to the amount of equity in the net profit and loss for the year for the investments listed has not been included in this schedule. This information is not considered to be meaningful owing to the complex capital structures of the portfolio companies, with different classes of equity securities outstanding with different preferences in liquidation. These investments are not consolidated, nor are they accounted for under the equity method of accounting, with the exception of Accelerator IV-New York Corporation, which is accounted for under the equity method.
** "Controlled Affiliated" is defined as control of 50.1 percent or more of the voting securities outstanding and/or 50.1 percent or more control of the appointment of members of the board of directors. There were no such holdings as of the year ended December 31, 2019.
| | | | | | | | | | | | | | | | | | | | | | | | | | | | | |
| Line for Schedule of Investments | Method / Level | | Primary Industry | | # of Shares Purchased/Principal | | | Cost of TURN's Investment | | | Valuation | |
| NON-CONTROLLED AFFILIATED COMPANIES | | | | | | | | | |
| PRIVATELY HELD COMPANIES | | | | | | | | | |
| ABSMaterials, Inc. | | | Specialty Chemicals | | | | | | |
| Series A Convertible Preferred Stock (acquired 2/17/10-10/24/11) | (I) (L3) | | | | 390,000 | | | $ | 435,000 | | | $ | 22,297 | |
| Series B Convertible Preferred Stock (acquired 11/8/13-6/25/14) | (I) (L3) | | | | 1,037,751 | | | 1,217,644 | | | 306,556 | |
| Secured Convertible Bridge Note, 8% PIK, (acquired 1/20/16, maturing 6/30/20) | (M) (L3) | | | | $ | 100,000 | | | 131,605 | | | 131,605 | |
| Secured Convertible Bridge Note, 8% PIK, (acquired 3/28/17, maturing 6/30/20) | (M) (L3) | | | | $ | 25,000 | | | 30,529 | | | 30,529 | |
| | | | | | | $ | 1,814,778 | | | $ | 490,987 | |
| Black Silicon Holdings, Inc. | | | Semiconductors | | | | | | |
| Series A Convertible Preferred Stock (acquired 8/4/15) | (M) (L3) | | | | 233,499 | | | $ | 750,000 | | | $ | 0 | |
| Series A-1 Convertible Preferred Stock (acquired 8/4/15) | (M) (L3) | | | | 2,966,667 | | | 890,000 | | | 0 | |
| Series A-2 Convertible Preferred Stock (acquired 8/4/15) | (M) (L3) | | | | 4,207,537 | | | 2,445,000 | | | 0 | |
| Series B-1 Convertible Preferred Stock (acquired 8/4/15) | (M) (L3) | | | | 1,892,836 | | | 1,169,561 | | | 0 | |
| Series C Convertible Preferred Stock (acquired 8/4/15) | (M) (L3) | | | | 1,674,030 | | | 1,171,316 | | | 0 | |
| Secured Convertible Bridge Note, 8% PIK, (acquired 8/25/16, maturing 8/4/21) | (M) (L3) | | | | $ | 1,278,453 | | | 1,444,368 | | | 360,465 | |
| | | | | | | | $ | 7,870,245 | | | $ | 360,465 | |
| EchoPixel, Inc. | | | Health Care Equipment | | | | | | | | |
| Series Seed Convertible Preferred Stock (acquired 6/21/13-6/30/14) | (I) (L3) | | | | 4,194,630 | | | $ | 1,250,000 | | | $ | 1,369,554 | |
| Series Seed-2 Convertible Preferred Stock (acquired 1/22/16) | (I) (L3) | | | | 1,476,668 | | | 500,000 | | | 488,352 | |
| Series A-2 Convertible Preferred Stock (acquired 3/23/17) | (I) (L3) | | | | 1,471,577 | | | 350,000 | | | 556,486 | |
| | | | | | | | $ | 2,100,000 | | | $ | 2,414,392 | |
| Essential Health Solutions, Inc. | | | Health Care Technology | | | | | | | | |
| Common Stock (acquired 11/18/16) | (I) (L3) | | | | 200,000 | | | | $ | 20 | | | | $ | 143,349 | |
| Series A Convertible Preferred Stock (acquired 11/18/16) | (I) (L3) | | | | 2,750,000 | | | 2,750,000 | | | 2,868,134 | |
| Unsecured Convertible Bridge Note, 8%, (acquired 12/19/18, maturing 12/19/21) | (I) (L3) | | | | $ | 50,000 | | | 50,000 | | | 50,000 | |
| | | | | | | | $ | 2,800,020 | | | $ | 3,061,483 | |
| | | | | | | | | |
| | | | | | | | | | | | | | | | | | | | | | | | | | | | | |
| Line for Schedule of Investments | Method / Level | | Primary Industry | | # of Shares Purchased/Principal | | | Cost of TURN's Investment | | | Valuation | |
| NON-CONTROLLED AFFILIATED COMPANIES | | | | | | | | | |
| PRIVATELY HELD COMPANIES | | | | | | | | | |
| HALE.life Corporation | | | Health Care Technology | | | | | | | | | |
| Common Stock (acquired 3/1/16) | (I) (L3) | | | | 1,000,000 | | | $ | 10 | | | $ | 117,016 | |
| Series Seed-1 Convertible Preferred Stock (acquired 3/28/17) | (I) (L3) | | | | 11,000,000 | | | 1,896,920 | | | 1,613,660 | |
| Series Seed-2 Convertible Preferred Stock (acquired 12/28/18) | (I) (L3) | | | | 12,083,132 | | | 2,500,000 | | | 1,853,786 | |
| | | | | | | $ | 4,396,930 | | | $ | 3,584,462 | |
| ORIG3N, Inc. | | | Health Care Technology | | | | | | |
| Series 1 Convertible Preferred Stock (acquired 2/5/15-8/5/15) | (H) (L3) | | | | 1,195,315 | | | $ | 500,000 | | | $ | 885,200 | |
| Series A Convertible Preferred Stock (acquired 11/25/15-9/7/16) | (H) (L3) | | | | 1,364,666 | | | | 1,500,000 | | | | 1,060,501 | |
| Series A-2 Convertible Preferred Stock (acquired 5/11/17-2/8/18) | (H) (L3) | | | | 176,386 | | | | 200,002 | | | | 146,262 | |
| | | | | | | $ | 2,200,002 | | | $ | 2,091,963 | |
| Produced Water Absorbents, Inc. | | | Oil & Gas Equipment & Services | | | | | | | | | |
| Common Stock (acquired 4/30/16) | (M) (L3) | | | | 50,243,350 | | | $ | 7,670,281 | | | $ | 0 | |
| Warrants for Common Stock expiring upon liquidation event (acquired 4/30/16) | (M) (L3) | | | | 450,000 | | | 65,250 | | | 0 | |
| Senior Secured Debt, 15% commencing on 4/1/16, matured on 12/31/19 (acquired 4/1/16) | (M) (L3) | | | | $ | 2,533,766 | | | 2,533,766 | | | 0 | |
| | | | | | | $ | 10,269,297 | | | $ | 0 | |
| TARA Biosystems, Inc. | | | Life Sciences Tools & Services | | | | | | | | | |
| Common Stock (acquired 8/20/14) | (I) (L3) | | | | 2,000,000 | | | $ | 20 | | | $ | 757,753 | |
| Series A Convertible Preferred Stock (acquired 3/31/17) | (I) (L3) | | | | 6,878,572 | | | 2,545,493 | | | 3,196,883 | |
| Series A-2 Convertible Preferred Stock (acquired 4/18/19) | (I) (L3) | | | | 208,577 | | | 100,000 | | | 101,062 | |
| | | | | | | $ | 2,645,513 | | | $ | 4,055,698 | |
| Total Non-Controlled Affiliated Privately Held Portfolio (16.9%) | | | | | | | | $ | 34,096,785 | | | $ | 16,059,450 | |
| | | | | | | | | |
| | | | | | | | | | | | | | | | | | | | | | | | | | | | | |
| Line for Schedule of Investments | Method / Level | | Primary Industry | | # of Shares Purchased/Principal | | | Cost of TURN's Investment | | | Valuation | |
| NON-CONTROLLED AFFILIATED COMPANIES | | | | | | | | | |
| PUBLICLY TRADED SECURITIES | | | | | | | | | | | | |
| Synacor, Inc. | | | Application Software | | | | | | | | | |
| Common Stock (acquired 4/6/17-10/1/19) | (M) (L1) | | | | 1,611,882 | | | $ | 4,362,473 | | | $ | 2,450,061 | |
| Stock Options for Common Stock Expiring 2/28/29 (acquired 3/1/19) | (I) (L3) | | | | 50,000 | | | 0 | | | 47,221 | |
| Stock Options for Common Stock Expiring 5/16/29 (acquired 5/16/19) | (I) (L3) | | | | 15,000 | | | 0 | | | 14,293 | |
| Restricted Stock Units (acquired 9/10/19) | (M) (L2) | | | | 9,463 | | | 0 | | | 14,384 | |
| | | | | | | | $ | 4,362,473 | | | $ | 2,525,959 | |
| TheMaven, Inc. | | | Interactive Media & Services | | | | | | | | |
| Series H Convertible Preferred Stock (acquired 6/27/19) | (M) (L2) | | | | 1,320 | | | $ | 2,000,000 | | | $ | 2,647,689 | |
| Series I Convertible Preferred Stock (acquired 6/28/19) | (M) (L2) | | | | 5,000 | | | 5,000,000 | | | 6,615,833 | |
| Series J Convertible Preferred Stock (acquired 10/7/19) | (M) (L2) | | | | 1,000 | | | 1,000,000 | | | 896,209 | |
| | | | | 7,320 | | | 8,000,000 | | | 10,159,731 | |
| Total Non-Controlled Affiliated Publicly Traded Securities (13.3%) | | | | | | | $ | 12,362,473 | | | $ | 12,685,690 | |
| EQUITY METHOD PRIVATELY HELD COMPANY | | | | | | | | | | | |
| Accelerator IV-New York Corporation | | | Research & Consulting Services | | | | | | |
| Series A Common Stock (acquired 7/21/14-12/12/18) | (E) | | | | 833,333 | | | $ | 203,677 | | | $ | 203,677 | |
| Total Equity Method Privately Held Company (0.2%) | | | | | | | $ | 203,677 | | | $ | 203,677 | |
| Total Investments in Non-Controlled Affiliated Companies Privately Held Companies and Publicly Traded Securities and Equity Method Privately Held Company (30.4%) | | | | | | | $ | 46,662,935 | | | $ | 28,948,817 | |
Report of Independent Registered Public Accounting Firm
To the Board of Directors and Shareholders of 180 Degree Capital Corp.
Opinion on the Financial Statements
We have audited the accompanying consolidated statement of assets and liabilities, including the consolidated schedule of investments, of 180 Degree Capital Corp. and its subsidiaries (the "Company") as of December 31, 2019, the related consolidated statements of operations and cash flows for the year ended December 31, 2019, the consolidated statements of changes in net assets for each of the two years in the period ended December 31, 2019, including the related notes, and the consolidated financial highlights for each of the five years in the period ended December 31, 2019 (collectively referred to as the “consolidated financial statements”). In our opinion, the consolidated financial statements present fairly, in all material respects, the financial position of the Company as of December 31, 2019, the results of its operations and its cash flows for the year then ended, the changes in its net assets for each of the two years in the period ended December 31, 2019 and the financial highlights for each of the five years in the period ended December 31, 2019 in conformity with accounting principles generally accepted in the United States of America.
Basis for Opinion
These consolidated financial statements are the responsibility of the Company’s management. Our responsibility is to express an opinion on the Company’s consolidated financial statements based on our audits. We are a public accounting firm registered with the Public Company Accounting Oversight Board (United States) (PCAOB) and are required to be independent with respect to the Company in accordance with the U.S. federal securities laws and the applicable rules and regulations of the Securities and Exchange Commission and the PCAOB.
We conducted our audits of these consolidated financial statements in accordance with the standards of the PCAOB. Those standards require that we plan and perform the audit to obtain reasonable assurance about whether the consolidated financial statements are free of material misstatement, whether due to error or fraud.
Our audits included performing procedures to assess the risks of material misstatement of the consolidated financial statements, whether due to error or fraud, and performing procedures that respond to those risks. Such procedures included examining, on a test basis, evidence regarding the amounts and disclosures in the consolidated financial statements. Our audits also included evaluating the accounting principles used and significant estimates made by management, as well as evaluating the overall presentation of the consolidated financial statements. Our procedures included confirmation of securities owned as of December 31, 2019 by correspondence with the custodian, transfer agent, portfolio companies and broker; when replies were not received from portfolio companies and broker, we performed other auditing procedures. We believe that our audits provide a reasonable basis for our opinion.
/s/ PricewaterhouseCoopers LLP
New York, New York
February 24, 2020
We have served as the Company’s auditor since 2002.
Privacy Policy
We are committed to protecting your privacy. This privacy notice explains the privacy policies of 180 Degree Capital Corp. and its affiliates. This notice supersedes any other privacy notice you may have received from 180 Degree Capital Corp.
Generally, we do not receive any non-public personal information relating to our shareholders, although certain non-public personal information of our shareholders may become available to us. We maintain physical, electronic, and procedural safeguards, according to strict standards of security and confidentiality, all information we receive about you. The only information we collect from you is your name, address, and number of shares you hold. This information is used only so that we can send you annual reports and other information about us, and send you proxy statements or other information required by law. When the Company shares non-public shareholder personal information referred to above, the information is made available for limited business purposes and under controlled circumstances designed to protect our shareholders' privacy. We do not permit use of shareholder information for any non-business or marketing purpose, nor do we permit third parties to rent, sell, trade or otherwise release or disclose information to any other party.
We do not share this information with any non-affiliated third party except as described below.
•180 Degree Capital Corp. and affiliate employees. It is our policy that only our authorized employees who need to know your personal information will have access to it. Our personnel who violate our privacy policy are subject to disciplinary action.
•Service Providers. We may disclose your personal information to companies that provide services on our behalf, such as record keeping and mailing you information. These companies are required to protect your information and use it solely for the purpose for which they received it.
•Courts and Government Officials. If required by law, we may disclose your personal information in accordance with a court order or at the request of government regulators. Only that information required by law, subpoena, or court order will be disclosed.
Proxy Voting
We vote proxies relating to our portfolio securities in the best interest of our shareholders. We review on a case-by-case basis each proposal submitted to a shareholder vote to determine its impact on the portfolio securities held by us. Although we generally vote against proposals that may have a negative impact on our portfolio securities, we may vote for such a proposal if there exists compelling long-term reasons to do so.
Our proxy voting decisions are made by our Portfolio Managers, who are responsible for monitoring each of our investments. To ensure that our vote is not the product of a conflict of interest, we require that: (i) anyone involved in the decision making process disclose to our Chief Compliance Officer any potential conflict that he or she is aware of and any contact that he or she has had with any interested party regarding a proxy vote; and (ii) employees involved in the decision making process or vote administration are prohibited from revealing how we intend to vote on a proposal in order to reduce any attempted influence from interested parties.
Information regarding how the Company voted proxies relating to portfolio securities during the most recent 12-month period ended June 30 is available, without charge, upon request, by calling the Company toll-free at 833-293-1769 and on the SEC's website at http://www.sec.gov.
Portfolio Holdings
The Company files its complete schedule of portfolio holdings with the SEC for the first and third quarters of each fiscal year on Form N-Q. The Company's Forms N-Q are available on the SEC's website at http://www.sec.gov and may be reviewed and copied at the SEC's Public Reference Room in Washington D.C. Information on the operation of the Public Reference Room may be obtained by calling 1-800-SEC-0330.
180 Degree Capital Corp.
Board of Directors
| | | | | | | | |
Stacy R. Brandom1,2,4 | Charles E. Ramsey2,3,4 | Richard P. Shanley1,2,3,4,5 |
Parker A. Weil1,2,3 | Kevin M. Rendino6 | Daniel B. Wolfe |
1. Member of Audit Committee 2. Member of Valuation Committee 3. Member of Compensation Committee
4. Member of Nominating Committee 5. Lead Independent Director 6. Chairman of the Board
Officers
| | | | | |
| Kevin M. Rendino | Chairman, Chief Executive Officer and Portfolio Manager |
| Daniel B. Wolfe | President, Chief Financial Officer, Chief Compliance Officer and Portfolio Manager |
| Alicia M. Gift | Senior Controller, Secretary and Treasurer |
| Robert E. Bigelow III | Vice President, Head of Fund Development |
7 N. Willow Street, Suite 4B
Montclair, New Jersey 07042
Phone: 973-746-4500 Fax: 973-746-4508
Website: www.180degreecapital.com Email: ir@180degreecapital.com
Counsel: Schulte Roth & Zabel LLP
Independent Registered Public Accounting Firm: PricewaterhouseCoopers LLP
Custodian of Securities: US Bank, N.A.
Transfer Agent & Registrar: American Stock Transfer & Trust Company, LLC
Stockholder Relations Department
6201 15th Avenue
Brooklyn, New York 11219
877-260-8188
Website: www.astfinancial.com Email: info@astfinancial.com
HOUSEHOLDING OPT-OUT NOTICE
To reduce expenses, we may only mail one copy of the 180 Degree Capital Corp.'s shareholder updates, such as prospectus, annual report, semi-annual report, to those addresses shared by two or more accounts. If you are not a direct shareholder (i.e., you hold your shares of us in a brokerage account), please contact your financial institution to opt out of householding. If you are a direct shareholder (i.e., you hold your shares of us at our transfer agent) and wish to receive individual copies of these documents, please call us toll-free at 833-293-1769. We will begin sending you individual copies thirty days after receiving your request.
Item 2. Code of Ethics.
The Board has adopted a code of ethics applicable to our senior executive officers that is designed to promote honest and ethical conduct, including the ethical handling of actual or apparent conflicts of interest between personal and professional relationships (the "Code of Conduct"). Our Code of Conduct is available on the Company's website at https://ir.180degreecapital.com/governance-docs. The Company did not make any substantive amendments to the Code of Conduct, nor grant any waivers from any provisions of the Code of Conduct during the reporting period.
Item 3. Audit Committee Financial Expert.
The Board has determined that all of the members of the Company's Audit Committee of the Board, Stacy R. Brandom, Richard P. Shanley and Parker A. Weil, meet the definition of "audit committee financial expert" as that term is defined by the SEC and are "independent" pursuant to paragraph (a)(2) of this Item.
Item 4. Principal Accountant Fees and Services.
The information set forth under the captions "Audit Committee's Pre-Approval Policies" and "Fees Paid to PwC for 2019 and 2018" in the Proxy Statement for the 2019 Annual Meeting of Shareholders, to be filed pursuant to Regulation 14A under the Exchange Act (the "2020 Proxy Statement") is herein incorporated by reference.
Item 5. Audit Committee List of Registrants.
The information set forth under the caption "Audit Committee" in our 2020 Proxy Statement is herein incorporated by reference.
Item 6. Investments.
(a) The schedule of investments in securities of unaffiliated issuers is included as part of the report to stockholders filed under Item 1 of this form.
(b) Not applicable.
Item 7. Disclosure of Proxy Voting Policies and Procedures for Closed-End Management Investment Companies.
We vote proxies relating to our portfolio securities in the best interest of our shareholders. We review on a case-by-case basis each proposal submitted to a shareholder vote to determine its impact on the portfolio securities held by us. Although we generally vote against proposals that may have a negative impact on our portfolio securities, we may vote for such a proposal if there exists compelling long-term reasons to do so.
Our proxy voting decisions are made by our Portfolio Managers, who are responsible for monitoring each of our investments. To ensure that our vote is not the product of a conflict of interest, we require that: (i) anyone involved in the decision making process disclose to our Chief Compliance Officer any potential conflict that he or she is aware of and any contact that he or she has had with any interested party regarding a proxy vote; and (ii) employees involved in the decision making process or vote administration are prohibited from revealing how we intend to vote on a proposal in order to reduce any attempted influence from interested parties.
Item 8. Portfolio Managers of Closed-End Management Investment Companies.
(a)(1) As of December 31, 2019, Kevin M. Rendino and Daniel B. Wolfe are primarily responsible for the day-to-day management of the Company's portfolio as Portfolio Managers.
Mr. Rendino has served as Chairman and Chief Executive Officer of the Company since March 2017 and as a member of the Board since June 2016. From 2012 to 2016, Mr. Rendino served as Chairman and Chief Executive Officer of RGJ Capital, where he led a Graham and Dodd approach to value investing. His team focused on a blend of long-only ideas and pair trades when a statistical anomaly and inconsistency between two variables are identified. From November 2017 to August 2019, Mr. Rendino served as a director of TheStreet, Inc., a publicly traded company in which we had an investment. Since March 2019, Mr. Rendino serves as a director of Synacor, Inc., a publicly traded company in which we have an investment.
Mr. Wolfe has served as President since January 2009, as Chief Financial Officer and Chief Compliance Officer since July 2016, and as Portfolio Manager and a member of the Company's Board since March 2017. He served as Chief Operating Officer and a Managing Director from January 2008 to June 30, 2016. He served as Chief Financial Officer from January 2008 to December 31, 2012, as Treasurer from May 2008 to December 31, 2012, and from July 2016 to April 2017. He is a member of the board of directors of Black Silicon Holdings, Inc., a privately held company in which we have an investment. He has also served as a member of the board of directors of privately held and publicly traded companies in which we have had investments.
(a)(2) Not applicable.
(a)(3) The principal elements of our executive compensation program for 2019 are base salary, bonus, other benefits and perquisites, and severance benefits. The Compensation Committee of the Board believes that each element is essential to achieve the Company’s objectives as set forth above.
Base Salaries. We recognize the need to pay our named executive officers, and other employees, a competitive annual base salary. We review base salaries for our named executive officers annually, often employing data provided from independent compensation consultants. Base salaries have historically been adjusted annually for inflation and also based on changes in the marketplace and an executive’s individual performance, salary position among peers, career growth potential and/or a change in responsibilities.
Cash Bonuses. The Company provides annual bonuses at the discretion of the Committee derived from a number of quantitative and qualitative inputs including, but not limited to:
•Performance against individual and corporate targets and goals;
•Performance as compared to indices and other observable entities that track or invest in microcapitalization publicly traded companies;
•Full year actual versus estimated expenses and expenses as a percentage of assets;
•Changes in the price per share of the Company’s stock, including dividends, if any;
•Changes in the net asset value of the Company, including dividends, if any; and
•The importance of retaining employees.
The weighting of these inputs in the Committee’s determinations of bonuses are adjusted based on a retrospective full analysis of individual and corporate achievements and challenges during the year under consideration.
Severance Benefits. To further incentivize and retain Messrs. Rendino and Wolfe, we entered into an Executive Severance Agreement with each executive.
Each of Messrs. Rendino and Wolfe's Executive Severance Agreement provides that the executive will receive the following severance benefits in the event that an executive’s employment is terminated by us other than for “cause” or an executive resigns for “good reason.”
•Twelve months of base salary to be paid in cash periodically in accordance with the Company’s normal payroll policies;
•a portion of executive’s incentive compensation in cash for the fiscal year in which executive's employment terminates, pro-rated based on time employed during the fiscal year, only to be paid to the extent that performance metrics in the plan are achieved and at the same time as payments to other executives in the applicable incentive compensation plan are paid; and
•Twelve months of COBRA premiums.
Further, under the terms of each Executive Severance Agreement for Messrs. Rendino and Wolfe, in the event an executive’s employment is terminated other than for “cause” or an executive resigns for “good reason” within the period commencing three months prior to a change in control and ending 12 months after a change in control, the severance will consist of:
•Twelve months of base salary to be paid in a single cash lump-sum;
•a portion of an executive’s incentive compensation in cash for the fiscal year in which executive's employment terminates, pro-rated based on time employed during the fiscal year;
•Twelve months of COBRA premiums.
For purposes of the Executive Severance Agreements, "cause" generally means:
•an act of dishonesty made in connection with the executive’s responsibilities as an employee;
•conviction of, or plea of nolo contendere to, a felony or any crime involving fraud or embezzlement;
•gross misconduct;
•unauthorized use or disclosure of any proprietary information or trade secrets;
•willful breach of any obligations under any written agreement or covenant with the Company;
•failure to cooperate in good faith with a governmental or internal investigation; or
•continued failure to perform duties after receiving a written demand of performance.
For purposes of the Executive Severance Agreements, "good reason" generally means a voluntary termination following the occurrence of one or more of the following, without the executive’s consent that is not cured within 30 days of notice to the Company:
•a material reduction of responsibilities;
•a material reduction in base salary; or;
•a material change (at least 50 miles) in the geographic location of Executive’s primary work facility or location.
(a)(4) As of December 31, 2019, Mr. Rendino and Mr. Wolfe beneficially owned equity securities of the Company valued over $1,000,000 and between $500,001 and $1,000,000, respectively.
Item 9. Purchases of Equity Securities by Closed-End Management Investment Company and Affiliated Purchasers.
| | | | | | | | | | | | | | |
| Period 2019 | (a) Total Number of Shares Purchased | (b) Average Price Paid Per Share | (c) Total Number of Shares Purchased as Part of Publicly Announced Plans or Programs | (d) Approximate Dollar Value of Shares that May Yet Be Purchased Under the Plans or Programs |
| 01/01 - 01/31 | 0 | | 0 | | 0 | | $ | 2,500,000 | |
| 02/01 - 02/28 | 0 | | 0 | | 0 | | 2,500,000 | |
| 03/01 - 03/31 | 0 | | 0 | | 0 | | 2,500,000 | |
| 04/01 - 04/30 | 0 | | 0 | | 0 | | 2,500,000 | |
| 05/01 - 05/31 | 0 | | 0 | | 0 | | 2,500,000 | |
| 06/01 - 06/30 | 0 | | 0 | | 0 | | 2,500,000 | |
| 07/01 - 07/31 | 0 | | 0 | | 0 | | 2,500,000 | |
| 08/01 - 08/31 | 0 | | 0 | | 0 | | 2,500,000 | |
| 09/01 - 09/30 | 0 | | 0 | | 0 | | 2,500,000 | |
| 10/01 - 10/31 | 0 | | 0 | | 0 | | 2,500,000 | |
| 11/01 - 11/30 | 0 | | 0 | | 0 | | 2,500,000 | |
| 12/01 - 12/31 | 0 | | 0 | | 0 | | 2,500,000 | |
| | | | |
| Total for Year | 0 | | | 0 | | |
On August 1, 2019, our Board reauthorized the repurchase of up to $2.5 million of the Company's common Stock within a six-month period from the date of notice to investors, which notice was mailed on or about August 16, 2019. As of December 31, 2019, no repurchases had occurred.
On February 20, 2020, our Board reauthorized the repurchase of up to $2.5 million of the Company's common Stock within a six-month period from the date of notice to investors, which notice is expected to be mailed on or about February 26, 2020.
Item 10. Submission of Matters to a Vote of Shareholders.
There have been no material changes to the procedures by which shareholders may recommend nominees to the registrant's Board of Directors as set forth in the registrant's Proxy Statement, dated April 29, 2019.
Item 11. Controls and Procedures.
(a) Based on an evaluation of the Registrant's Disclosure Controls and Procedures (as defined in Rule 30a-3(c) under the Investment Company Act of 1940, the “Disclosure Controls”) as of a date within 90 days prior to the filing date (the “Filing Date”) of this Form N-CSR (the “Report”), the Chief Executive Officer (its principal executive officer) and Chief Financial Officer (its principal financial officer) have concluded that the Disclosure Controls are reasonably designed to ensure that information required to be disclosed by the Registrant in the Report is recorded, processed, summarized and reported by the Filing Date, including ensuring that information required to be disclosed in the Report is accumulated and communicated to the Registrant's management, including the Registrant's principal executive officer and principal financial officer, as appropriate to allow timely decisions regarding required disclosure.
(b) There were no changes in the Registrant’s internal control over financial reporting (as defined in Rule 30a-3(d) under the Investment Company Act of 1940) that occurred during the Registrant’s last fiscal quarter that have materially affected or are reasonably likely to materially affect the Registrant’s internal control over financial reporting.
Item 12. Disclosure of Securities Lending Activities for Closed-End Management Investment Companies.
(a) Not applicable.
(b) Not applicable.
Item 13. Exhibits.
(a)(1) The Code of Conduct is available on the Company's website at https://ir.180degreecapital.com/governance-docs.
(a)(3) Not applicable.
(a)(4) Not applicable.
SIGNATURES
Pursuant to the requirements of the Securities Exchange Act of 1934 and the Investment Company Act of 1940, the Registrant has duly caused this report to be signed on its behalf by the undersigned, thereunto duly authorized.
180 DEGREE CAPITAL CORP.
| | | | | |
| By: | /s/ Daniel B. Wolfe |
| | Name: Daniel B. Wolfe |
| | Title: President and Chief Financial Officer |
| | |
| | Date: February 24, 2020 |
Pursuant to the requirements of the Securities Exchange Act of 1934 and the Investment Company Act of 1940, this report has been signed below by the following persons on behalf of the Registrant and in the capacities and on the dates indicated.
| | | | | | | | | | | | | | |
| By: | /s/ Kevin M. Rendino | | By: | /s/ Daniel B. Wolfe |
| | Name: Kevin M. Rendino | | | Name: Daniel B. Wolfe |
| | Title: Chief Executive Officer | | | Title: President and Chief Financial Officer |
| | (Principal Executive Officer) | | | (Principal Financial Officer) |
| | | | | |
| | Date: February 24, 2020 | | | Date: February 24, 2020 |