UNITED STATES
SECURITIES AND EXCHANGE COMMISSION
Washington, D.C. 20549
FORM N-CSR
CERTIFIED SHAREHOLDER REPORT OF REGISTERED
MANAGEMENT INVESTMENT COMPANY
Investment Company Act file number 811-07074
| | |
| 180 DEGREE CAPITAL CORP. |
| (Exact Name of Registrant as Specified in Its Charter) |
| | | | | | | | |
| 7 N. Willow Street, Suite 4B, Montclair NJ | | 07042 |
| (Address of Principal Executive Offices) | | (Zip Code) |
| | |
Daniel B. Wolfe
President and Chief Financial Officer
180 Degree Capital Corp.
7 N. Willow Street, Suite 4B
Montclair, NJ 07042 |
| (Name and address of agent for service) |
|
Copy to:
John J. Mahon, Esq.
Schulte Roth & Zabel, LLP
1152 Fifteenth Street, NW
Suite 850
Washington, DC 20005
(202) 729-7477 |
Registrant's telephone number, including area code: (973) 746-4500
Date of fiscal year end: December 31
Date of reporting period: December 31, 2021
Item 1. Report to Shareholders.
Fellow Shareholders,
I have learned so many valuable lessons over the years about investing, particularly from being around so many smart investors, all with markedly varying investment processes. From my very first days at Merrill Lynch Asset Management (“MLAM”), I had the luxury of having mentors who cared very deeply about my growth and my career. I am deeply indebted to people like Arthur Zeikel, Norm Harvey, Paul Hoffman, and Bob Martorelli for their guidance over the years. Arthur Zeikel was an icon in the investing world, and his recent passing got me thinking about all that he taught me. Arthur was a legendary value investor and headed up research and managed investments for Dreyfus Corporation. In the mid 1970’s, he was brought to Merrill Lynch to start and become President of MLAM. He eventually hired my former boss, Paul Hoffman, to run the first manufactured product from MLAM, the Merrill Lynch Basic Value Fund (“Basic Value”). Arthur built a business of portfolio managers and products that produced superior returns for its shareholders and MLAM became one of the more widely respected asset managers on Wall Street. He was a better person and leader than he was an investor; and he was a great investor. Managing money isn't easy and we all have challenging performance times. What I loved and respected the most about Arthur was his ability to support his portfolio managers when they would go through spotty performance periods, rather than pounce on them. Supporting folks through tough periods built loyalty and camaraderie throughout MLAM during those years. No portfolio manager can effectively manage money if he/she has a boss that is going to fire that person for one bad performance period. Part of any investor’s track record will encompass periods of underperformance no matter how good of an investor he/she is. We are all destined to have underperforming portfolios at one point or another. Arthur accepted those periods from his portfolio managers and always encouraged them to learn from their mistakes and to maintain the courage of their convictions and to think long term. He was the greatest, and I miss his leadership. Arthur once published a letter in the mid 1990’s he had written to his daughter about his advice for investing, and in memory of him, I am going to copy and paste it here. It’s gold. RIP Arthur.
From: Arthur Zeikel (Father)
To: Jill Anne Zeikel (Daughter)
Date: Oct. 17, 1994
Re: Managing Your Own Portfolio
Personal portfolio management is not a competitive sport. It is, instead, an important individualized effort to achieve some predetermined financial goal by balancing one's risk-tolerance level with the desire to enhance capital wealth. Good investment management practices are complex and time consuming, requiring discipline, patience, and consistency of application. Too many investors fail to follow some simple, time-tested tenets that improve the odds of achieving success and, at the same time, reduce the anxiety naturally associated with an uncertain undertaking.
I hope the following advice will help:
A fool and his money are soon parted. Investment capital becomes a perishable commodity if not handled properly. Be serious. Pay attention to your financial affairs. Take an active, intensive interest. If you don't, why should anyone else?
There is no free lunch. Risk and return are interrelated. Set reasonable objectives using history as a guide. All returns relate to inflation. Better to be safe than sorry. Never up, never in. Most investors underestimate the stress of a high-risk portfolio on the way down.
Don't put all your eggs in one basket. Diversify. Asset allocation determines the rate of return. Stocks beat bonds over time.
Never overreach for yield. Remember, leverage works both ways. More money has been lost searching for yield than at the point of a gun (Ray DeVoe).
Spend interest, never principal, If at all possible, take out less than comes in. Then a portfolio grows in value and lasts forever. The other way around, it can be diminished quite rapidly.
You cannot eat relative performance. Measure results on a total return, portfolio basis against your own objectives, not someone else's.
Don't be afraid to take a loss. Mistakes are part of the game. The cost price of a security is a matter of historical insignificance, of interest only to the IRS. Averaging down, which is different from dollar cost averaging, means the first
decision was a mistake. It is a technique used to avoid admitting a mistake or to recover a loss against the odds. When in doubt, get out. The first loss is not only the best but is also usually the smallest.
Watch out for fads. Hula hoops and bowling alleys (among others) didn't last. There are no permanent shortages (or oversupplies). Every trend creates its own countervailing force. Expect the unexpected.
Act. Make decisions. No amount of information can remove all uncertainty. Have confidence in your moves. Better to be approximately right than precisely wrong.
Take the long view. Don't panic under short-term transitory developments. Stick to your plan. Prevent emotion from overtaking reason. Market timing generally doesn't work. Recognize the rhythm of events.
Remember the value of common sense. No system works all of the time. History is a guide, not a template.
This is all you really need to know.
Love, Dad
There are so many things I have learned over the years, but I think the one thing that has helped me the most is that no matter what type of market environment you are in, be who you are, be true to yourself, and be true to your investment process. Focus on your own task at hand, the funds that you manage and don’t dwell on what others do. I started working at MLAM on July 1, 1990. On August 2, 1990, Saddam Hussein invaded Kuwait. From that day, a recession ensued in the US, the market swooned, and we faced a savings and loan (S&L)/banking collapse that was greater than at any time since the Great Depression. I was told to pack my bags, go to California and research all the S&L’s such as HomeFed and GlenFed. By the time I got home, hundreds of S&Ls had failed against the backdrop of over-leverage and non-performing loans. Over the course of the next couple years, 1/3 of all S&Ls went bankrupt. Many banks suffered as well for the same reasons as loans went sour and capital ratios declined at an alarming rate. Many banks were forced to sell to healthier banks with stronger capital positions. It was a disaster year for bank stocks, and thus a disaster year for value investors who committed a great portion of their portfolios to the sector. Up until that year, Basic Value had never had a down year, and low and behold, I showed up as an analyst on the eve of the Fund having its worst year in its recorded history. 1990 was a mini-version of the 2008 subprime mortgage crisis. It was also a period when growth stock investing significantly out-performed value stock investing, which is not too dissimilar from what we have seen in the markets over the last few years.
Coming back to 1990, my boss, Paul Hoffman was beside himself. He cared so deeply about the Basic Value shareholders and took Basic Value’s underperformance very personally. He had never experienced a year like 1990 when he underperformed the broad indices by a fairly healthy margin. From time to time, the MLAM portfolio managers would do panel discussions in front of distribution networks that sold our products to retail investors. It was the end of 1990, and Paul was in a foul mood. All anyone was talking about was the demise of banks and the damage they caused portfolio managers who owned them. Paul was on a panel with a few of our other portfolio managers; one managed a tech fund, one managed a growth fund, one managed a Japan-focused fund, and the last a global growth fund. On these panels, each portfolio manager would open up, talk about their process, what they owned and how they had performed in 1990. Paul went first and spoke of the financial crisis and how that negatively impacted Basic Value’s performance. He talked about Basic Value’s portfolio construction, what we were buying and selling, and his outlook for 1991. When the other portfolio managers started to talk, instead of talking about what they owned, they talked about what they didn’t own. The tech fund portfolio manager began his discussion by stating he didn’t own Citigroup or Nations Bank (as if a tech fund would ever own a bank). The next portfolio manager led by saying, “We don’t own banks and I don’t know why anyone would.” I watched the anger creep into Paul‘s face. It started to feel like a dog pile as each portfolio manager was patting himself on the back for not owning a group of stocks that THEY WOULD NEVER HAVE OWNED IN THE FIRST PLACE given their investment process and the asset classes they were focused on. I saw the steam coming off of Paul’s head, and finally he snapped and screamed, “For the Love of God. Would you shut your mouths and stop talking about things you don’t know and start talking about things you might know something about.” He then stormed off in anger. Perfect mic drop moment, and he was right. We were value investors that owned financials. That's who we were and we talked about what we owned, or didn’t own within our value universe. The fact that certain managers were trying to prop themselves up by talking about a group of stocks that were completely outside of their fund’s charters was irrational and irrelevant. It was so distasteful to listen to. Could you imagine me starting a shareholder letter and stating, “We didn’t own Facebook (Meta Platforms) this quarter and that helped our performance.” What? I learned from Paul, and what was clearly one of his investment commandments, that a portfolio manager should keep the blinders on and focus on your own business and not get involved in others. By the way, 1991 turned out to be one of the best years Basic Value ever had, and trust me, it wasn’t because we sold banks to buy the names that the rest of the portfolio managers were pitching during that panel discussion.
Fast forward to 2000, ten years removed from the Hoffman explosion. Paul had retired and I was given the opportunity to take over for him and add Basic Value to the six or seven other funds I was already managing. It was the dot.com bubble, if you will recall. It was a period where any company that ended with “.com” traded at what seemed like 200x revenue. We were in a new world order where, because of the advent of the internet, investors were speculating on any internet related company.
Multiples and valuations were discussed based on the number of Ph.D.s on staff or eyeballs looking at websites rather than traditional financial metrics like revenue, earnings or EBITDA. The Nasdaq Composite Index was in the midst of a 400% gain over a four-year period. It was tech, tech, tech at the expense of everything else. With Arthur retired, MLAM, known for being a value shop, set out to create its own growth/tech funds because at the time that was the flavor of the month, and we didn't have many applicable product offerings. We recruited several expensive portfolio managers from other firms and launched a series of internet and growth funds (yes, at the peak of the market). Have you ever met the “Masters of the Universe”? We were hiring them left and right. Pick any tech investor in January 2000 and you would be assured of being in the company of greatness. I remember walking into one of the “new geniuses” in the hallway and he was carrying 10 or so shirts that had been dry cleaned (our office was connected to a hotel). I attempted to make small talk, and, in the conversation, he alerted me to the fact that one of the conditions of his hire was housing in the hotel and free dry cleaning. What? I wanted to vomit. How does the topic of who pays for dry cleaning come up in an interview? I know you are going to pay me millions of dollars, but if you don't pay for my dry cleaning, it's a no go! Whatever. By the way, he lived an hour from the office. I lived an hour and 10 minutes away. He couldn’t drive home every night like I did? We were fast becoming a department of haves and have-nots and I was part of the latter group. These were the new sheriffs in town. The gold miners. Us “value” investors were old-school relic dinosaurs. Warren Buffett was a has been, and Julian Robertson, a sensible value investor, closed his fund in March 2000 due to redemptions. In his letter to investors that can be found at https://money.cnn.com/2000/03/30/mutualfunds/q_funds_tiger/sidebar.htm, Robertson spoke about the plunging prices of so-called "old economy" value stocks. While volatile technology stocks have soared, out-of-favor value stocks had been trading at bargain prices. “The result of the demise of value investing and investor withdrawals has been financial erosion, stressful to us all," Robertson wrote. “And there is no real indication that a quick end is in sight.”
We weren't immune to the redemptions either as I had to deal with $1 billion of redemptions in the first quarter of 2000. Each and every day I came to work, I needed to sell $15 million stocks to meet those redemptions. While at the same time, MLAM was launching a super charged growth fund and raised $1 billion overnight. It was an incredibly painful period for me as I attempted to justify to shareholders why our fund should continue to exist when tech/growth funds were rocketing to the moon. Thinking about working with people who demanded dry cleaning from their new employer made me angry. I literally had my boxes packed, as I was ready to get fired any day. Arthur was no longer around to provide his outstanding leadership and guidance. It was just a frustrating period for the “old guard.” We had our own versions of portfolio manager panels that Hoffman attended back in 1990, except for me, it was a portfolio manager lunch hosted by the new President of MLIM (we changed our name to Merrill Lynch Investment Mangers). We had all the new hot shots and a few of the old guard (hard to believe at 34 years old I was the old guard) at the lunch. It was a chance for the new President to get the team together and provide their views of their funds and the market. It was the worst lunch of my life. The dry-cleaning guy started off not talking about any of his momentum growth stocks but how the old economy was dead and buried. He said the internet would change how people work and expected a stay-at-home economy (he was sort of right 20 years too early and for the wrong reasons). Against that backdrop, he pitched Gillette (I owned it) as a short because we would all be at home, and nobody would shave. He ran a long only fund and couldn't short, so what was the point of his comments? Me saying to myself, “Serenity now, serenity now. Pass the butter please.” The next guy was our tech manager, who instead of pitching a bunch of dotcoms (that would eventually collapse), he started talking about why Caterpillar Tractor (as it was known at the time) was a screaming short because there would be no new construction of anything in the stay-at-home economy. Like the last portfolio manager, he also ran a long only fund and shorting Caterpillar was not something he could do. Caterpillar was a significant holding for Basic Value, and as I felt my blood boiling, I channeled my inner Paul Hoffman and went off, “I CAN'T TAKE IT ANYMORE. Shut up and start talking about what you own and not opining on my portfolio. What does Gillette and Caterpillar have to do with your Fund! You guys can't even short stocks in your fund so what’s the @#)(*#$)_@* point. Seriously, shut up!” In case it's not obvious, that was a very frustrating time for us value guys.
As a side note, the fund that was launched with a $10 net asset value per share (“NAV”) and $1 billion in assets, had a $1 NAV and $100 million assets a year later. Nice work guys. MLIM morphed itself into something it wasn't at the exact wrong time of the growth/tech craze; and as a result, hurt a lot of shareholders of those new funds along the way. We pretty much violated each and every one of Arthur’s points in his letter to his daughter. Most or all of all the hot shots brought in to “save” our company with their souped-up growth and tech funds weren't employed by us two years later. It was an institutional failure of our organization and shareholders suffered as a result. The good news for MLIM at least was we saved money on our income statement for no longer providing dry cleaning for the “superstars”!
The point of all of this for 180 is we love what we are doing and know who we are. We are laser focused on small cap/micro-cap activism with a Graham and Dodd value approach. Being true to yourself and your process is the number one lesson I have learned through my 30+ year career in investing. I know the FAANG stocks and growth stocks in general have outperformed value for years, and if investors have made money over the years by investing in those asset classes, good for them. I don't feel a need to pontificate on strategies unrelated to what we are trying to accomplish for our shareholders. We are confident that we will be able to provide above average returns over a market cycle, and we hope the last five years of 180 provides a strong indication that our investment process can be successful. That doesn’t mean that we will outperform every quarter, or for that matter every year. It also doesn’t mean that our way of investing is the only method that provides shareholders with an opportunity to outperform and create wealth. I do think that over our five years as a company we have demonstrated that the strategy we set forth when we began has served our shareholders quite well. I don’t think we should be the only fund in our
shareholders’ portfolios, but I do think we can be a very valuable piece because we provide low correlation to the rest of the market and have the ability to provide asymmetric returns.
We had a nice quarter, and an even better year. For the quarter we grew our NAV 2.8% to $10.66 and our cash and securities of public and related companies represented $76.7 million, or $7.39 per share. In Q4 2021 we generated a +6.1% gross total return while the Russell Microcap Index declined, -2.7%. This quarter wasn’t without its challenges as our outperformance from our public assets was offset with a $1.6 million or $0.15 per share reduction in net assets and NAV respectively in our legacy private assets. For the year, we grew our NAV by +14.9% against the backdrop of a +34.7% (or +38.2% including carried interest from our separately managed account (“SMA”)) gross total return for our public market and related assets. The +34.7% gross total return in 2021 compares quite favorably to the +19.3% total return for the Russell Microcap Index. With 180 now completing our fifth full year of performance for our public market investing strategy, we are proud to report we achieved a +373.6% gross total return (or +405.5% including carried interest from our SMA) versus +73.8% total return for the Russell Microcap Index.
As we mentioned during the year, 180 was pursuing SPAC sponsorship opportunities with who we believe are value added partners or management teams and have demonstrated a core competency in sourcing merger candidates. The first of these efforts is Parabellum Acquisition Corp. (PRBM). We are thrilled the company had a successful IPO this past year, raising $143.75 million. 180 was the lead investor in the sponsor and Daniel Wolfe serves on PRBM’s Board of Directors on behalf of 180. We are excited to be working on this effort with the founders of PRBM, Narbeh Derhacobian and Ron Shelton, the former CEO and CFO of Adesto Technologies Corp. With the IPO behind us, PRBM is now on the hunt for target companies. 180’s holdings of PRBM are currently owned through the sponsor, Parabellum Acquisition Holdings, LLC. The fair value of our holdings of PRBM as of the end of Q4 2021 was approximately $6.7 million on a cost basis of approximately $2.7 million. In addition to PRBM, we continue to work with another partner in connection with exploring a SPAC sponsor group investment opportunity, although we cannot assure you when or if such investment will ultimately be consummated. We look forward to being able to discuss these continuing efforts in more detail in the future.
I think it's fair to say that I have tried to provide as much transparency as possible around our private holdings and relayed that we were becoming increasingly bullish on our ability to monetize some of them. It definitely has pained me at times that we were not at liberty to freely talk more specifically about which companies were exploring such opportunities. That said, we have been able to make two significant announcements subsequent to the end of 2021 from Petra Pharma Corporation (potential for a significant milestone payment from its acquisition by Eli Lilly and Company) and D-Wave Systems, Inc. (potential public listing through a merger with a SPAC, DPCM Capital, Inc. (XPOA)). If both come to fruition, we have the opportunity to convert a significant part of our private portfolio into cash in 2022.
Net Asset Value Per Share
Our NAV increased this quarter from $10.37 to $10.66, an increase of 2.8%. TURN has three principal components to the variance in our NAV: our public portfolio, our private portfolio, and our expenses. For the quarter, our public portfolio including carried interest generated from our SMA caused our NAV to increase by $0.64 per share, while our private portfolio companies decreased our NAV by $0.15. Operating expenses, ongoing expenses and the year-end bonus pool decreased NAV by $0.20.
| | | | | | | | | | | | | | | |
| Quarter | | 1 Year | 3 Year | Inception to Date
(5 Year) |
| Q4 2021 | | Q4 2020-
Q4 2021 | Q4 2018-
Q4 2021 | Q4 2016-Q4 2021 |
| | | | | |
| | | | | |
| | | | | |
| Change in NAV | 2.8% | | 14.9% | 34.6% | 51.9% |
| | | | | |
| Russell Microcap Index | (2.7%) | | 19.3% | 76.6% | 73.8% |
| Russell Microcap Value Index | 0.9% | | 33.6% | 74.9% | 72.0% |
| Russell 2000 | 2.1% | | 14.8% | 72.7% | 76.2% |
| | | | | |
| | | | | |
| | | | | |
As I said above, we were able to grow our cash plus securities of public and related companies to $76.7 million and you can see the progress we have made in our five-year history to remake our business towards the ultimate goal of having 100% of our balance sheet in cash plus securities of public and related companies.
* Q4 2021 includes carried interest and net of cash to be paid for 2021 bonuses and 2019 and 2020 deferred bonuses.
And relative to our NAV, as you can see from the following chart before and after the beginning of 180, we have made considerable strides in growing our NAV.
On a relative basis, our stock price total return of +77.5% has also exceeded the Russell Microcap Index total return of +73.8% since our inception as is shown in the chart below:
Public Portfolio
In the chart below, you see our quarter-to-date, one-year, three-year, and now 5-year (since inception) gross total return performance from our public investment strategy. For Q4 2021, we showed a gross total return for our public portfolio of +6.1% (+9.0% including carried interest), versus a gross total return for the Russell Microcap Index of -2.7% and a gross total return for the Russell Microcap Value Index of +0.9%. For all of 2021, our +34.7% gross total return (+38.2% including carried interest) compares favorably to +19.3% total return for the Russell Microcap and +33.6% total return for the Russell Microcap Value Index. Since we have started, we have generated a +373.6 gross total return (+405.5% including carried interest) for our public assets versus the +73.8% total return for the Russell Microcap Index.1
| | | | | | | | | | | | | | | |
| Quarter | | 1 Year | 3 Year | Inception to Date
(5 Year) |
| Q4 2021 | | Q4 2020-
Q4 2021 | Q4 2018-
Q4 2021 | Q4 2016-Q4 2021 |
TURN Public Portfolio
Gross Total Return (Excluding SMA Carried Interest) | 6.1% | | 34.7% | 160.9% | 373.6% |
TURN Public Portfolio
Gross Total Return (Including SMA Carried Interest) | 9.0% | | 38.2% | 178.5% | 405.5% |
| | | | | |
| | | | | |
| | | | | |
| Russell Microcap Index | (2.7%) | | 19.3% | 76.6% | 73.8% |
| Russell Microcap Value Index | 0.9% | | 33.6% | 74.9% | 72.0% |
| Russell 2000 | 2.1% | | 14.8% | 72.7% | 76.2% |
| | | | | |
| | | | | |
| | | | | |
1 Past performance shown in the tables above and throughout this letter is not an indication or guarantee of future performance. Amounts gross unrealized and realized total returns compounded on a quarterly basis. 180 is an internally managed registered closed end fund and does not have an external manager that is paid fees based on assets and/or returns. 180 also has a material portion of its investment portfolio in legacy privately held investments. Please see 180's filings with the SEC, including its 2021 Annual Report filed on Form N-CSR for information on its expenses and expense ratios.
Let’s dig into the significant sources of the changes in value in our public portfolio in Q4 2021.
Sources of material increases in value:
•Synalloy Corporation (SYNL) – SYNL stock increased from $10.99 to $16.43 per share as the company reported blow-out Q3 2021 results that were above expectations for revenues, margins, and net earnings. The new management team, led by Chairman Ben Rosenzweig and CEO Chris Hutter have been exceptional in their efforts to turnaround the business inherited from the former inept management team. The company completed a rights offering at $12.75 raising $10 million. 180 purchased 50,168 shares in the rights offering, which included oversubscribing beyond our pro rata share of the offering. SYNL increased our NAV by $2.0 million, or +$0.19 per share.
•TheMaven, Inc. (MVEN) - In August 2021, MVEN regained compliance with SEC reporting requirements by filing its financial statements through Q2 2021. The volume weighted average price per share to reach 1% of outstanding tradable stock (VWAP) increased from $0.5550 to $0.6477 during the quarter. The company provided business updates that included showing better than expected 2021 revenue of $180 million and a less than expected negative impact to TheStreet.com's subscription business following the departure of Jim Cramer. MVEN increased our NAV by $1.5 million, or +$0.14 per share. We note that in February 2022, TheMaven changed its name to The Arena Group and now trades on the NYSE American exchange under the symbol AREN.
•Everspin Technologies, Inc. (MRAM) – MRAM announced much better than expected results for Q3 2021 including an IP license deal that added $5.3 million in cash to the balance sheet. The stock increased from $6.58 to a high of over $13.00. We sold our entire position in the quarter at an average price of $10.67 per share generating a $1.8 million, or approximately 59%, gain over the 10 months we owned the stock. For the quarter MRAM increased our NAV by $1.4 million, or +$0.13 per share.
•Lantronix, Inc. (LTRX) – LTRX reported strong results for Q3 2021 and provided better than expected guidance. The stock increased 34.5% in the quarter to $7.83. In the quarter, 180 sold 208,478 shares at an average price of $8.02 and then purchased 121,336 shares at an average price of $7.39. LTRX increased our NAV by $0.9 million, or +$0.09 per share.
Sources of material decrease in value:
•Potbelly Corporation (PBPB) – In Q4 2021, PBPB stock price declined 17.7% to $5.58. While the company announced Q3 2021 results that showed continued improvement in the business, the onset of the Omicron variant caused investors to worry about the impact it would have on PBPB business. 180 purchased 239,589 shares at an average price of $5.84, We believe this business under the leadership of Robert Wright and Steve Cirulis will show meaningful improvement over the ensuing years and deliver double-digit EBITDA margins. PBPB decreased our NAV by $1.6 million, or -$0.15 per share.
•comScore, Inc. (SCOR) – SCOR declined 14.4% to $3.34 during the quarter. While the company delivered better than expected results in Q3 2021, including revenues, EBITDA margins, and net income, the company continues to struggle to convince investors that it is on a sustained growth trajectory and can begin to generate meaningful positive cash flows. In our view, the catalyst for change will come from SCOR’s new CFO, Jon Carpenter, who came from Nielsen and Publishers Clearinghouse and has real operating experience. We believe he will simplify the SCOR story, change the reporting lines of the business which should highlight its digital revenues, and ensure the company will invest its assets in higher return revenue and margin opportunities. We purchased 505,731 shares of SCOR at an average price of $3.52, and it is now a 7.9% position. SCOR caused our NAV to decline $0.7 million, or -$0.07 per share.
We publicly announced one new position in the quarter: RF Industries, Ltd. (RFIL)
We closed out of two of our publicly announced positions in the quarter: Everspin Technologies, Inc. (MRAM) and Zymergen, Inc. (ZY; shares received from the sale of our legacy private company, Lodo Therapeutics Corporation)
Private Portfolio
For the quarter, our private portfolio decreased in value by $1.6 million, or -$0.15 per share. The largest decreases in value occurred in Nanosys, Inc., Seaport Diagnostics, Inc., and EchoPixel, Inc. In almost every shareholder letter, we state that while we desire to shepherd our existing private portfolio to exits or explore opportunities to sell our positions in those companies, we have the luxury of being able to sell our private holdings when we believe it makes sense for shareholders, rather than being forced to do so to survive. As stated above, we are pleased to report two events that we believe increase the likelihood we have
the opportunity to realize a cash payment from our rights to milestone payments from the acquisition of Petra Pharma Corporation by Eli Lilly and Company, and to monetize our position in D-Wave Systems, Inc.
In a presentation to investors in December 2021, Lilly noted that it expected to start human studies of the mutant-selective PI3Kα inhibitor developed by Petra in the first half of 2022. Although 180 cannot assure our investors when such an event may occur, if at all, such an event would trigger a contractual payment to former Petra shareholders, including 180. The $6.8 million payment, if received, would increase cash per share by $0.66.
D-Wave Systems announced its intent to become a publicly traded company through a merger with DPCM Capital, Inc., (“XPOA”), a special purpose acquisition company (“SPAC”). If the transaction is completed as currently agreed to by each party, 180 would hold approximately 900,000 shares of common stock of the merged company.
According to D-Wave and XPOA, the transaction is expected to enhance D-Wave’s leadership in commercial quantum computing and accelerate quantum use cases into significant customer segments, including manufacturing, logistics, pharmaceuticals, finance, and government. Upon closing of the transaction, shares of D-Wave Quantum Inc., a newly formed parent company of D-Wave and XPOA, are expected to trade on the NYSE under the symbol “QBTS.”
D-Wave and XPOA stated the transaction values D-Wave at an equity value of approximately $1.2 billion USD. The transaction also includes an innovative incentive structure, whereby a bonus pool of 5 million shares will be allocated pro rata to non-redeeming public stockholders of XPOA, effectively reducing their cost basis. A similar bonus pool of up to 1.8 million shares has been established for Private Investment in Public Equity ("PIPE”) investors to ensure the same effective cost basis for PIPE investors as for public stockholders of XPOA.
D-Wave and XPOA further noted that the transaction, which has been unanimously approved by the Board of Directors of D-Wave as well as the Board of Directors of XPOA, is expected to close in the second quarter of 2022, subject to the satisfaction of customary closing conditions, including the approval of the stockholders of XPOA.
EXPENSES
As we have noted in previous letters, we have dramatically reduced our cost structure under our new strategy. In 2016, before our Fund’s change in investment focus and management team, our operating expenses, excluding stock-based compensation and interest on outstanding debt, averaged approximately $1.3 million per quarter. For Q4 2021, our regular operating expenses, excluding severance costs, equaled approximately $750,000. Given our persistent and outsized performance for the full year 2021, the Compensation Committee approved an additional accrual of approximately $1.3 million for the 2021 bonus pool. We will maintain a lean cost structure (outside of fixed expenses for being a public company) focusing our expenses on activities solely designed to enhance our investment performance or to increase our revenues from managing outside capital.
TURN/NAV: SUM OF THE PARTS
As of the end of Q4 2021, TURN traded at 69% of NAV. Our securities of publicly traded and related companies, cash, and other assets net of liabilities and including carried interest from our SMA were $7.28 per share. Our stock price was $7.35. If we received 100% credit for the value of these assets net of liabilities, the market is ascribing a value of approximately $0.07 per share or $726,000, to our private portfolio. Given our private assets are valued at approximately $35.0 million, the market is discounting the value of our private portfolio assets by approximately 98% as of the end of Q4 2021. As a reminder, if achieved, the first milestone payment from the acquisition of Petra to TURN is $6.8 million, or $0.66 per share.
At the end of the day, the private portfolio is becoming less and less important to our success. From the chart below, look at how dramatically different our balance sheet looks today versus almost five years ago.
CONCLUSION
As we kickoff 2022, we believe the small cap market has rarely, if ever, been as attractive as it currently is. While the small cap market underperformed when compared to large cap stocks during 2021, we believe there are multiple reasons for optimism and an improving landscape for investments in small cap equities as 2022 unfolds.
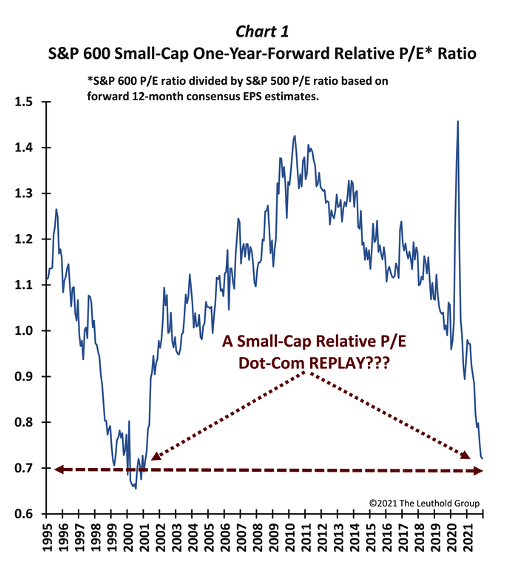
One traditional method of assigning relative value to companies is by comparing their price to earnings multiple (“P/E”). When viewed this way, and seen in the chart below, credited to The Leuthold Group, the relative value of small cap companies to large cap companies is nothing short of remarkable. Specifically, the ratio of P/E multiples for the small cap S&P 600 compared to that of the S&P 500 is at just north of 0.7, a level not seen since 2000 during the dot-com bubble.
A deeper dive into the numbers depicted on the chart above provides additional context. In 2000, the market was in the midst of the dot-com bubble, which burst not long after. Tech stocks at the time were trading at high P/E multiples that had never been seen before. This, of course, translated to an inflated P/E multiple for the S&P 500 as a whole. While small cap stocks were significantly undervalued to the S&P 500 on a relative basis, they weren't necessarily as undervalued in absolute terms.
One further point is that it wasn’t just small cap stocks that were undervalued relative to tech stocks and hence the S&P 500 P/E multiples across every market sector were significantly lower than those for tech stocks during this period. In other words, nearly the entire stock market was mispriced based on P/E multiples – not just the small and micro-cap markets.
This stands in sharp contrast to the current market. Whereas nearly every market was undervalued on a P/E multiple basis in 2000, in the current market, nearly every sector is overvalued compared to the small cap market on a P/E multiple basis.
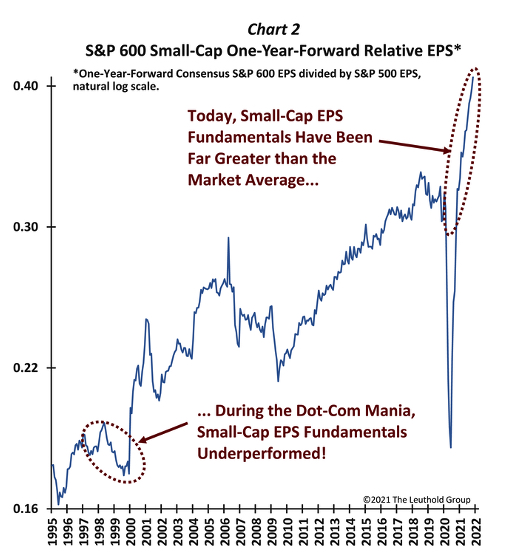
What makes this current opportunity in small caps even more compelling is that it is not just driven by attractive relative P/E multiples. Back in 2000, one argument and justification for lower P/E multiples for small caps was that the forward earnings per share (”EPS”) consensus was lower than that for the S&P 500. In the current market, however, the situation is the exact opposite. Currently, the consensus forward EPS estimates for the S&P 600 are the highest they have been relative to the S&P 500 going back to 1995. The chart below shows this relationship:
So unlike 2000 when small cap stocks traded at depressed P/E multiples due at least in part to underperforming earnings, the current small cap market is trading at these same depressed levels despite superior expected earnings.
180 is bullish on the investment opportunities in our microcap/small cap universe over the coming months, and we are excited to take advantage of what we currently think is indiscriminate selling. The Russell Microcap Index is down 21% in less than three months, which, when analyzed with the date presented above, we believe creates some exciting investment opportunities as we move through 2022.
Now to start the year, investors are fixated on the inflationary and disrupted supply chain environment that is likely to lead to higher interest rates. COVID-19 never seems to go away, and we have the potential for a Russian invasion of Ukraine which is causing concerns for risk assets. Put simply, it is a market filled with fear. The inflationary supply chain issues are real and are providing a serious headwind for the market and the economy. As you know, I love reading about some of the world's best investors. Warren Buffet once said, "Over time people get smarter but not wiser. They don't get emotionally stable. All the conditions for extreme overvaluation or undervaluation absolutely exist, the way they did 50 years ago. You can teach people
all you want, tell them to read Graham's book, you can send them to graduate school, but when they are scared, they really get scared." Well, the markets are presently experiencing extreme volatility and vicious selling. We are living though what appears to be a very “scared” market. While our investment results for the history of 180 have shown great outperformance, we are not immune from the sell-off that has occurred to start the year. We have had a number of large selloffs in our five-year history and yet through it all, our public and related asset gross total return is +373.6%. While it is never fun to live through nasty sell-offs, we need washouts like we are currently experiencing to find the stocks that offer enormous upside. While our Q4 2021 was very good relative to the indices, it is better to judge us on the totality of our long-term results.
With the conclusion of the first five-years of 180, we believe it is time to be more proactive about getting our name in front of potential new investors. We announced in November 2021, that we joined FLX Distribution’s platform toward increasing third-party assets under management. In conjunction with this effort, we have engaged Peaks Strategies to help us expand our public relations efforts. We have also launched a new website and updated our logo. We’re proud of what we have accomplished since 2017, and look forward to more actively getting in front of potential new shareholders and/or clients for management of third-party capital.
We have completely remade our business and created a real business with a real name in the microcap world. When I first joined the Board of Directors in mid-2016, we had just approximately $17 million in cash and securities of public companies net of outstanding debt. As the end of Q4 2021 we have approximately $76.7 million on our balance sheet and grew the net assets for our SMA client from $25 million to $38 million. The market for microcaps is ripe with inefficiencies and asymmetric risk/reward characteristics. If you get your stock picking right, you can achieve outsized returns. Based on our research, we believe some of the individual companies we own have upside of 100% over a three-year cycle. We have permanent capital and the opportunity to take advantage of the current dislocation is easier for us because we don’t have to sell to service redemptions. We are here for the long haul, we are going to make rational objective decisions, and we are going to use our activist approach when the situation calls for it. We look forward to reviewing our subsequent quarters as the year unfolds.
Thank you for your continued support.
Kevin Rendino
Chairman and Chief Executive Officer
Forward-Looking Statements
This shareholder letter may contain statements of a forward-looking nature relating to future events. These forward-looking statements are subject to the inherent uncertainties in predicting future results and conditions. These statements reflect the Company's current beliefs, and a number of important factors could cause actual results to differ materially from those expressed in this press release. Please see the Company's securities filings filed with the Securities and Exchange Commission for a more detailed discussion of the risks and uncertainties associated with the Company's business and other significant factors that could affect the Company's actual results. Except as otherwise required by Federal securities laws, the Company undertakes no obligation to update or revise these forward-looking statements to reflect new events or uncertainties. The reference and link to any websites have been provided as a convenience, and the information contained on such website is not incorporated by reference into this shareholder letter. 180 Degree Capital Corp. is not responsible for the contents of third-party websites.
| | |
180 DEGREE CAPITAL CORP.
CONSOLIDATED STATEMENT OF ASSETS AND LIABILITIES |
| | | | | |
| | December 31, 2021 |
| ASSETS | |
| Investments in securities and other financial instruments, at value: | |
| Unaffiliated publicly traded equity and equity-related securities (cost: $21,354,961) | $ | 29,078,904 | |
| Unaffiliated legacy privately held equity and equity-related securities (cost: $12,886,349) | 21,641,386 | |
| Non-controlled affiliated publicly traded equity and equity-related securities (cost: $31,949,232) | 36,359,588 | |
| Non-controlled affiliated legacy privately held equity and equity-related securities (cost: $11,942,463) | 5,275,293 | |
| Controlled affiliated equity and equity-related securities (cost: $2,830,646) | 6,832,700 | |
| Unaffiliated derivative securities (cost: $149,042) | 54,666 | |
| Non-controlled affiliated derivative securities (cost: $224,849) | 205,313 | |
| Unaffiliated rights to payments (cost: $6,869,436) | 8,012,759 | |
| Cash | 4,157,676 | |
| Receivable from managed funds | 2,319,258 | |
| Receivable from portfolio companies | 891,937 | |
| Receivable from securities sold | 73,159 | |
| Prepaid expenses | 352,665 | |
| Lease-asset | 109,680 | |
| Other receivables | 10,127 | |
| Other assets | 26,856 | |
| Total assets | $ | 115,401,967 | |
| LIABILITIES & NET ASSETS | |
| |
| Bonus payable (Note 7) | $ | 3,306,875 | |
| Post-retirement plan liabilities | 799,890 | |
| Accounts payable and accrued liabilities | 500,576 | |
| Lease obligation | 109,680 | |
| Payable for securities purchased | 74,970 | |
| Severance | 34,024 | |
| Total liabilities | $ | 4,826,015 | |
| Commitments and contingencies (Note 10) | |
| Net assets | $ | 110,575,952 | |
| Net assets are comprised of: | |
| Preferred stock, $0.10 par value, 2,000,000 shares authorized; none issued | $ | 0 | |
| Common stock, $0.03 par value, 15,000,000 shares authorized; 11,541,079 issued* | 334,594 | |
| Additional paid in capital | 118,997,664 | |
| Total accumulated distributable loss | (4,150,781) | |
| Treasury stock, at cost 1,167,259 shares* | (4,605,525) | |
| Net assets | $ | 110,575,952 | |
| Shares outstanding | 10,373,820 | |
| Net asset value per outstanding share | $ | 10.66 | |
*Reflects a 1-for-3 reverse stock split that became effective on January 4, 2021. Refer to Note 1. The Company, for further information.
The accompanying notes are an integral part of these consolidated financial statements.
13
| | |
180 DEGREE CAPITAL CORP.
CONSOLIDATED STATEMENT OF OPERATIONS |
| | | | | |
| Year Ended
December 31, 2021 |
| Income: | |
| Carried interest | $ | 2,167,107 | |
| Interest from: | |
| Unaffiliated companies-PIK | 10,363 | |
| Non-controlled affiliated companies-cash | (8,154) | |
| Non-controlled affiliated companies-PIK | 301,431 | |
| Other income | 253,660 | |
| Board fees from portfolio companies-cash | 23,250 | |
| Board fees from portfolio companies-non-cash | 31,449 | |
| Management fee income | 6,083 | |
| Dividend income | 5,977 | |
| Total income | 2,791,166 | |
| Operating fees and expenses: | |
| Salaries, bonus and benefits | 4,621,152 | |
| Professional | 653,492 | |
| Insurance | 309,923 | |
| Directors | 285,000 | |
| Administration and operations | 275,662 | |
| Severance | 65,493 | |
| Custody | 31,032 | |
| Rent | 27,233 | |
| Other | 7,535 | |
| Total operating expenses | 6,276,522 | |
| Net investment loss before income tax expense | (3,485,356) | |
| Income tax expense | 1,272 | |
| Net investment loss | (3,486,628) | |
| Net realized gain (loss) from investments: | |
| Unaffiliated publicly traded equity and equity-related securities | 10,257,981 | |
| Unaffiliated legacy privately held equity and equity-related securities | (894,294) | |
| Non-controlled affiliated publicly traded equity and equity-related securities | 1,012,087 | |
| Non-controlled affiliated legacy privately held equity and equity-related securities | (8,447,220) | |
| Net realized gain from investments | 1,928,554 | |
| Realized gain from funds held in escrow | 163,043 | |
| Net realized gain | 2,091,597 | |
| Change in unrealized appreciation (depreciation) on investments: | |
| Unaffiliated publicly traded equity and equity-related securities | 270,245 | |
| Unaffiliated legacy privately held equity and equity-related securities | 2,659,811 | |
| Non-controlled affiliated publicly traded equity and equity-related securities | 4,598,704 | |
| Non-controlled affiliated legacy privately held equity and equity-related securities | 4,291,042 | |
| Controlled affiliated equity and equity-related securities | 4,002,054 | |
| Unaffiliated rights to payments | (168,667) | |
| Net change in unrealized appreciation on investments | 15,653,189 | |
| Net realized gain from investments and change in unrealized appreciation on investments | 17,744,786 | |
| Net increase in net assets resulting from operations | $ | 14,258,158 | |
The accompanying notes are an integral part of these consolidated financial statements.
14
| | |
180 DEGREE CAPITAL CORP.
CONSOLIDATED STATEMENT OF CASH FLOWS |
| | | | | |
| Year Ended
December 31, 2021 |
| Cash flows used in operating activities: | |
| Net increase in net assets resulting from operations | $ | 14,258,158 | |
| Adjustments to reconcile net increase in net assets resulting from operations to net cash used in operating activities: |
| Net realized gain from investments | (2,091,597) | |
| Net change in unrealized appreciation on investments | (15,653,189) | |
| Depreciation of fixed assets | 7,532 | |
| Accretion of bridge note PIK interest income | (311,794) | |
| Board fees from portfolio companies-non-cash | (31,449) | |
| Purchase of unaffiliated publicly traded equity and equity-related securities | (26,608,470) | |
| Purchase of non-controlled affiliated publicly traded equity and equity-related securities | (19,680,825) | |
| Purchase of controlled affiliated equity and equity-related securities | (2,830,646) | |
| Proceeds from sale of unaffiliated publicly traded equity and equity-related securities | 36,559,597 | |
| Proceeds from sale of non-controlled affiliated publicly traded and equity-related securities | 5,833,019 | |
| Proceeds from sale of non-controlled affiliated legacy privately held equity and equity-related securities | 970,788 | |
| Proceeds from funds held in escrow from sales of investments | 323,683 | |
| Changes in assets and liabilities: | |
| Increase in receivable from sales of securities | (73,159) | |
| Decrease in receivable from managed funds | 319,122 | |
| Increase in receivable from portfolio securities | (96,944) | |
| Increase in prepaid expenses | (26,720) | |
| Decrease in interest receivable | 8,154 | |
| Increase in other receivables | (908) | |
| Decrease in other assets | 3,843 | |
| Increase in bonus payable | 1,948,953 | |
| Decrease in post-retirement plan liabilities | (42,476) | |
| Decrease in payable for securities purchased | (144,175) | |
| Decrease in accounts payable and accrued liabilities | (15,539) | |
| Increase in accrued severance | 34,024 | |
| Net cash used in operating activities | (7,341,018) | |
| Cash flows from investing activities: | |
| Purchase of fixed assets | (10,391) | |
| Net cash used in investing activities | (10,391) | |
| Net decrease in cash and restricted cash | (7,351,409) | |
| Cash and restricted cash at beginning of the year | 11,509,085 | |
| Cash at end of the year | $ | 4,157,676 | |
| Supplemental disclosures of cash flow information: | |
| Income taxes paid | $ | 1,272 | |
| |
The accompanying notes are an integral part of these consolidated financial statements.
15
| | |
180 DEGREE CAPITAL CORP.
CONSOLIDATED STATEMENTS OF CHANGES IN NET ASSETS |
| | | | | | | | | | | |
| Year Ended
December 31, 2021 | | Year Ended December 31, 2020 |
| | | |
| Changes in net assets from operations: | | | |
| Net investment loss | $ | (3,486,628) | | | $ | (510,224) | |
| Net realized gain (loss) on investments | 2,091,597 | | | (1,071,992) | |
| Net change in unrealized appreciation on investments | 15,653,189 | | | 2,709,272 | |
| Share of loss on equity method investment | 0 | | | (22,901) | |
| Net increase in net assets resulting from operations | 14,258,158 | | | 1,104,155 | |
| Net increase in net assets | 14,258,158 | | | 1,104,155 | |
| Net Assets: | | | |
| Beginning of the year | 96,317,794 | | | 95,213,639 | |
| End of the year | $ | 110,575,952 | | | $ | 96,317,794 | |
| | | |
The accompanying notes are an integral part of these consolidated financial statements.
16
| | |
180 DEGREE CAPITAL CORP.
CONSOLIDATED FINANCIAL HIGHLIGHTS |
| | | | | | | | | | | | | | | | | | | | | | | | | | | | | |
| Year Ended
Dec. 31, 2021 | | Year Ended Dec. 31 2020# | | Year Ended
Dec. 31, 2019# | | Year Ended
Dec. 31, 2018# | | Year Ended
Dec. 31, 2017# |
| | | | | | | | | |
| Per Share Operating Performance: | | | | | | | | | |
| Net asset value per share, beginning of the year | $ | 9.28 | | | $ | 9.18 | | | $ | 7.92 | | | $ | 7.80 | | | $ | 7.02 | |
Net investment loss* | (0.33) | | | (0.05) | | | (0.48) | | | (0.21) | | | (0.36) | |
Net realized gain (loss) from investments* | 0.20 | | | (0.11) | | | 0.93 | | | (0.75) | | | (1.14) | |
Net change in unrealized appreciation (depreciation) on investments and options*1 | 1.51 | | | 0.26 | | | 0.81 | | | 1.08 | | | 2.40 | |
Share of loss on equity method investment*2 | 0.00 | | | 0.00 | | | 0.00 | | | 0.00 | | | 0.00 | |
| Total* | 1.38 | | | 0.10 | | | 1.26 | | | 0.12 | | | 0.90 | |
Net (decrease) increase as a result of stock-based compensation expense*2 | 0.00 | | | 0.00 | | | 0.00 | | | 0.00 | | | (0.03) | |
Net decrease as a result of acquisition of vested restricted stock awards related to employee withholding2 | 0.00 | | | 0.00 | | | 0.00 | | | 0.00 | | | (0.06) | |
| Total (decrease) increase from capital stock transactions | 0.00 | | | 0.00 | | | 0.00 | | | 0.00 | | | (0.09) | |
Net (decrease) increase as a result of other comprehensive (loss) income*2 | 0.00 | | | 0.00 | | | 0.00 | | | 0.00 | | | (0.03) | |
| Net increase (decrease) in net asset value | 1.38 | | | 0.10 | | | 1.26 | | | 0.12 | | | 0.78 | |
| Net asset value per share, end of the year | $ | 10.66 | | | $ | 9.28 | | | $ | 9.18 | | | $ | 7.92 | | | $ | 7.80 | |
| | | | | | | | | |
| Stock price per share, end of the year | $ | 7.35 | | | $ | 6.66 | | | $ | 6.45 | | | $ | 5.25 | | | $ | 5.91 | |
| Total return based on stock price | 10.36 | % | | 3.26 | % | | 22.86 | % | | (11.17) | % | | 42.75 | % |
| Supplemental Data: | | | | | | | | | |
| Net assets, end of the year | $ | 110,575,952 | | | $ | 96,317,794 | | | $ | 95,213,639 | | | $ | 82,034,768 | | | $ | 81,042,989 | |
| Ratio of expenses, excluding taxes, to average net assets | 5.86 | % | ^ | 4.61 | % | ^ | 6.42 | % | ^ | 3.62 | % | ^ | 6.26 | % |
| Ratio of expenses, including taxes, to average net assets | 5.87 | % | ^ | 4.61 | % | ^ | 6.42 | % | ^ | 3.63 | % | ^ | 6.28 | % |
| Ratio of net investment loss to average net assets | (3.26) | % | | (0.59) | % | | (5.42) | % | | (2.82) | % | | (4.68) | % |
| Portfolio turnover | 44.46 | % | | 35.16 | % | | 30.17 | % | | 20.43 | % | | 8.83 | % |
| Number of shares outstanding, end of the year | 10,373,820 | | | 10,373,820 | | | 10,373,820 | | | 10,373,820 | | | 10,373,820 | |
# Reflect a 1-for-3 reverse stock split that became effective on January 4, 2021. Refer to Note 1. The Company, for further information.
* Based on average shares outstanding.
^ The Company has entered into an expense offsetting arrangement with one of its unaffiliated brokers relating to broker fees paid. The total broker fee charged to the Company was applied as a credit to fees charged by an affiliate of the unaffiliated broker who the Company subscribes to for data services billed during the year. The Company received an offset to expense totaling approximately $31,900, $15,700, $17,500 and $5,700 with that broker for the years ended December 31, 2020, December 31, 2019, December 31, 2018 and December 31, 2017, respectively. The Company received an offset to expense totaling approximately $84,800 with that broker for the year ended December 31, 2021.
1 Net unrealized losses include rounding adjustments to reconcile change in net asset value per share.
2 Amounts listed as zero are amounts calculated as less than $0.005.
3 Ratio of expenses, including taxes and excluding expenses related to restructuring, to quarterly average net assets for the year ended December 31, 2017 was 5.19%.
The accompanying notes are an integral part of these consolidated financial statements.
17
| | | | | | | | | | | | | | | | | | | | | | | | | | | | | |
| 180 DEGREE CAPITAL CORP. CONSOLIDATED SCHEDULE OF INVESTMENTS AS OF DECEMBER 31, 2021 |
| | | | | | | | | |
| Method of
Valuation (1) | | Industry | | Shares/Principal | | Cost | | Value |
| | | | | | | | | | | | | | | | | | | | | | | | | | | | | |
| Investments in Unaffiliated Equity and Equity-Related Securities (2) - | | | | | | | | | |
| 45.9% of net assets at value | | | | | | | | | |
| | | | | | | | | |
| Unaffiliated Publicly Traded Equity and Equity-Related Securities - | | | | | | | | | |
| 26.3% of net assets at value | | | | | | | | | |
| | | | | | | | | |
| Alta Equipment Group, Inc. (3) | | | Trading Companies & Distributors | | | | | | |
| Operates as an industrial and construction equipment company | | | | | | | | | |
| Common Stock | (M) (L1) | | | | 433,321 | | $ | 3,332,135 | | | $ | 6,343,819 | |
| | | | | | | | | |
| comScore, Inc. (3) | | | Advertising | | | | | | |
| Provides technology and services that measure audiences, brands and consumer behavior | | | | | | | | | |
| Common Stock | (M) (L1) | | | | 1,562,156 | | 5,417,532 | | | 5,217,601 | |
| | | | | | | | | |
| Enzo Biochem, Inc. (3) | | | Health Care Services | | | | | | |
| Develops health care products and provides diagnostic services | | | | | | | | | |
| Common Stock | (M) (L1) | | | | 241,182 | | 726,727 | | | 774,194 | |
| | | | | | | | | |
| Lantronix, Inc. (3) | | | Communications Equipment | | | | | | |
| Provides secure data access and management solutions | | | | | | | | | |
| Common Stock | (M) (L1) | | | | 331,101 | | 1,752,737 | | | 2,592,521 | |
| | | | | | | | | |
| PFSweb, Inc. (3) | | | IT Consulting & Other Services | | | | | | |
| Provides management services for ecommerce | | | | | | | | | |
| Common Stock | (M) (L1) | | | | 162,016 | | 1,198,424 | | | 2,086,766 | |
| | | | | | | | | |
| Quantum Corporation (3) | | | Technology Hardware, Storage & Peripherals | | | | | | |
| Provides high-density data storage and high-speed data processing solutions | | | | | | | | | |
| Common Stock | (M) (L1) | | | | 1,532,053 | | 5,376,566 | | | 8,456,933 | |
| | | | | | | | | |
| RF Industries, Ltd. (3) | | | Electronic Manufacturing Services | | | | | | |
| Provides products that enable wired and wireless communications | | | | | | | | | |
| Common Stock | (M) (L1) | | | | 213,480 | | 1,509,057 | | | 1,707,840 | |
| | | | | | | | | |
The accompanying notes are an integral part of these consolidated financial statements.
18
| | | | | | | | | | | | | | | | | | | | | | | | | | | | | |
| 180 DEGREE CAPITAL CORP. CONSOLIDATED SCHEDULE OF INVESTMENTS AS OF DECEMBER 31, 2021 |
| | | | | | | | | |
| Method of
Valuation (1) | | Industry | | Shares/Principal | | Cost | | Value |
| | | | | | | | | | | | | | | | | | | | | | | | | | | | | |
| Investments in Unaffiliated Equity and Equity-Related Securities (2) - | | | | | | | | | |
| 45.9% of net assets at value (cont.) | | | | | | | | | |
| | | | | | | | | |
| Unaffiliated Publicly Traded Equity and Equity-Related Securities - | | | | | | | | | |
| 26.3% of net assets at value (cont.) | | | | | | | | | |
| | | | | | | | | |
| Miscellaneous Common Stocks (4) | (M) (L1) | | | | | | $ | 2,041,783 | | | $ | 1,899,230 | |
| | | | | | | | | |
| Total Unaffiliated Publicly Traded Equity and Equity-Related Securities (cost: $21,354,961) | | | | | | | | | $ | 29,078,904 | |
| | | | | | | | | |
| Legacy Privately Held Equity and Equity-Related Securities - | | | | | | | | | |
| 19.6% of net assets at value | | | | | | | | | |
| | | | | | | | | |
| AgBiome, LLC (3)(5) | | | Fertilizers & Agricultural Chemicals | | | | | | |
| Develops agricultural products that reduce risk and improve yield | | | | | | | | | |
| Series A-1 Convertible Preferred Units (acquired 1/30/13) | (H) (L3) | | | | 2,000,000 | | $ | 2,000,000 | | | $ | 9,615,057 | |
| Series A-2 Convertible Preferred Units (acquired 4/9/13-10/15/13) | (H) (L3) | | | | 417,392 | | 521,740 | | | 2,007,843 | |
| Series B Convertible Preferred Units (acquired 8/7/15) | (H) (L3) | | | | 160,526 | | 500,006 | | | 784,916 | |
| | | | | | | 3,021,746 | | | 12,407,816 | |
| | | | | | | | | |
| AutoTech Ventures Management I, LLC (3)(5)(6) | | | Asset Management & Custody Banks | | | | | | |
| Venture capital investing in automotive-related companies | | | | | | | | | |
| LLC Interests (acquired 12/1/17) | (M) (L3) | | | | 0 | | 0 | | | 225,000 | |
| | | | | | | | | |
| D-Wave Systems, Inc. (3)(5)(7)(8) | | | Technology Hardware, Storage & Peripherals | | | | | | |
| Develops high-performance quantum computing systems | | | | | | | | | |
| Class A Convertible Preferred Stock (acquired 4/14/20) | (M) (L3) | | | | 1,025,045.6 | | 1,238,050 | | | 5,731,450 | |
| | | | | | | | | |
| Fleet Health Alliance, LLC (3)(5)(8) | | | Health Care Technology | | | | | | |
| Develops software for information transfer amongst healthcare providers and consumers | | | | | | | | | |
| Unsecured Convertible Bridge Note, 0%, (acquired 4/22/16, no maturity date) | (I) (L3) | | | | $ | 225,000 | | | 225,000 | | | 0 | |
| | | | | | | | | |
The accompanying notes are an integral part of these consolidated financial statements.
19
| | | | | | | | | | | | | | | | | | | | | | | | | | | | | |
| 180 DEGREE CAPITAL CORP. CONSOLIDATED SCHEDULE OF INVESTMENTS AS OF DECEMBER 31, 2021 |
| | | | | | | | | |
| Method of
Valuation (1) | | Industry | | Shares/Principal | | Cost | | Value |
| | | | | | | | | | | | | | | | | | | | | | | | | | | | | |
| Investments in Unaffiliated Equity and Equity-Related Securities (2) - | | | | | | | | | |
| 45.9% of net assets at value (cont.) | | | | | | | | | |
| | | | | | | | | |
| Legacy Privately Held Equity and Equity-Related Securities - | | | | | | | | | |
| 19.6% of net assets at value (cont.) | | | | | | | | | |
| | | | | | | | | |
| Magnolia Neurosciences Corporation (3)(5)(8) | | | Pharmaceuticals | | | | | | |
| Develops novel therapeutics for treatment of neurodegeneration | | | | | | | | | |
| Series A Convertible Preferred Stock (acquired 8/3/18) | (I) (L3) | | | | 862,872 | | $ | 862,872 | | | $ | 547,474 | |
| | | | | | | | | |
| Nanosys, Inc. (3)(5)(8)(9) | | | Specialty Chemicals | | | | | | |
| Develops inorganic nanowires and quantum dots for use in LED-backlit devices | | | | | | | | | |
| Series A-1 Convertible Preferred Stock (acquired 5/22/21) | (M) (L3) | | | | 496,572 | | 496,573 | | | 410,044 | |
| Series A-2 Convertible Preferred Stock (acquired 5/22/21) | (M) (L3) | | | | 2,232,001 | | 4,500,003 | | | 1,624,177 | |
| | | | | | | 4,996,576 | | | 2,034,221 | |
| | | | | | | | | |
| Phylagen, Inc. (3)(5)(8) | | | Research & Consulting Services | | | | | | |
| Develops technology to improve human health and business productivity | | | | | | | | | |
| Series A Convertible Preferred Stock (acquired 11/14/18) | (M) (L3) | | | | 548,031 | | 233,845 | | | 679,011 | |
| | | | | | | | | |
| Ravenna Pharmaceuticals, Inc. (3)(5)(8)(10)(11) | | | Pharmaceuticals | | | | | | |
| Holding company for intellectual property in oncology therapeutics | | | | | | | | | |
| Common Stock (acquired 5/14/20-8/26/21) | (M) (L3) | | | | 2,785,274 | | 108,258 | | | 16,414 | |
| | | | | | | | | |
| Seaport Diagnostics, Inc. (3)(5)(8)(11)(12) | | | Health Care Technology | | | | | | |
| Develops consumer focused genetic tests | | | | | | | | | |
| Series 1 Convertible Preferred Stock (acquired 2/5/15-8/5/15) | (I) (L3) | | | | 1,195,315 | | 500,000 | | | 0 | |
| Series A Convertible Preferred Stock (acquired 11/25/15-9/7/16) | (I) (L3) | | | | 1,364,666 | | 1,500,000 | | | 0 | |
| Series A-2 Convertible Preferred Stock (acquired 5/11/17-2/8/18) | (I) (L3) | | | | 176,386 | | 200,002 | | | 0 | |
| | | | | | | 2,200,002 | | | 0 | |
| | | | | | | | | |
The accompanying notes are an integral part of these consolidated financial statements.
20
| | | | | | | | | | | | | | | | | | | | | | | | | | | | | |
| 180 DEGREE CAPITAL CORP. CONSOLIDATED SCHEDULE OF INVESTMENTS AS OF DECEMBER 31, 2021 |
| | | | | | | | | |
| Method of
Valuation (1) | | Industry | | Shares/Principal | | Cost | | Value |
| | | | | | | | | | | | | | | | | | | | | | | | | | | | | |
| Total Unaffiliated Legacy Privately Held Equity and Equity-Related Securities (cost: $12,886,349) | | | | | | | | | $ | 21,641,386 | |
| | | | | | | | | |
| Total Investments in Unaffiliated Equity and Equity-Related Securities (cost: $34,241,310) | | | | | | | | | $ | 50,720,290 | |
| | | | | | | | | |
| Investments in Non-Controlled Affiliated Equity and Equity-Related Securities (2) - | | | | | | | | | |
| 37.7% of net assets at value | | | | | | | | | |
| | | | | | | | | |
| Non-Controlled Affiliated Publicly Traded Equity and Equity-Related Securities - | | | | | | | | | |
| 32.9% of net assets at value | | | | | | | | | |
| | | | | | | | | |
| Armstrong Flooring, Inc. (3)(13) | | | Building Products | | | | | | |
| Produces flooring products | | | | | | | | | |
| Common Stock | (M) (L2) | | | | 723,550 | | $ | 2,973,630 | | | $ | 1,816,111 | |
| | | | | | | | | |
| Potbelly Corporation (3)(13) | | | Restaurants | | | | | | |
| Operates a chain of sandwich shops | | | | | | | | | |
| Common Stock | (M) (L1) | | | | 1,515,163 | | 6,702,539 | | | 8,454,610 | |
| | | | | | | | | |
| Synalloy Corporation (3)(13) | | | Steel | | | | | | |
| Manufactures metals and chemicals | | | | | | | | | |
| Common Stock | (M) (L1) | | | | 373,306 | | 3,425,139 | | | 6,133,418 | |
| | | | | | | | | |
| Synchronoss Technologies, Inc. (3)(13) | | | Application Software | | | | | | |
| Provides white-label cloud storage, messaging and other digital analytic services | | | | | | | | | |
| Common Stock | (M) (L1) | | | | 4,082,578 | | 10,847,924 | | | 9,961,490 | |
| | | | | | | | | |
| TheMaven, Inc. (3)(13)(14) | | | Interactive Media & Services | | | | | | |
| Provides a shared digital publishing, advertising and distribution platform | | | | | | | | | |
| Common Stock | (M) (L2) | | | | 15,429,920 | | 8,000,000 | | | 9,993,959 | |
| | | | | | | | | |
| Total Non-Controlled Affiliated Publicly Traded Equity and Equity-Related Securities (cost: $31,949,232) | | | | | | | | | $ | 36,359,588 | |
| | | | | | | | | |
The accompanying notes are an integral part of these consolidated financial statements.
21
| | | | | | | | | | | | | | | | | | | | | | | | | | | | | |
| 180 DEGREE CAPITAL CORP. CONSOLIDATED SCHEDULE OF INVESTMENTS AS OF DECEMBER 31, 2021 |
| | | | | | | | | |
| Method of
Valuation (1) | | Industry | | Shares/Principal | | Cost | | Value |
| | | | | | | | | | | | | | | | | | | | | | | | | | | | | |
| Investments in Non-Controlled Affiliated Equity and Equity-Related Securities (2) - | | | | | | | | | |
| 37.7% of net assets at value (cont.) | | | | | | | | | |
| | | | | | | | | |
| Legacy Privately Held Equity and Equity-Related Securities - | | | | | | | | | |
| 4.8% of net assets at value | | | | | | | | | |
| | | | | | | | | |
| EchoPixel, Inc. (3)(5)(8) | | | Health Care Equipment | | | | | | |
| Develops virtual reality 3-D visualization software for life sciences and health care applications | | | | | | | | | |
| Series Seed Convertible Preferred Stock (acquired 6/21/13-6/30/14) | (I) (L3) | | | | 4,194,630 | | $ | 1,250,000 | | | $ | 520,097 | |
| Series Seed-2 Convertible Preferred Stock (acquired 1/22/16) | (I) (L3) | | | | 1,476,668 | | 500,000 | | | 186,084 | |
| Series A-2 Convertible Preferred Stock (acquired 3/23/17) | (I) (L3) | | | | 1,471,577 | | 350,000 | | | 238,390 | |
| | | | | | | 2,100,000 | | | 944,571 | |
| | | | | | | | | |
| Essential Health Solutions, Inc. (3)(8)(11) | | | Health Care Technology | | | | | | |
| Develops software for information transfer amongst healthcare providers and consumers | | | | | | | | | |
| Common Stock (acquired 11/18/16) | (I) (L3) | | | | 200,000 | | 20 | | | 0 | |
| Series A Convertible Preferred Stock (acquired 11/18/16) | (I) (L3) | | | | 2,750,000 | | 2,750,000 | | | 0 | |
| Unsecured Convertible Bridge Note, 8%, (acquired 12/19/18, matured 12/19/21) | (I) (L3) | | | | $ | 50,000 | | | 50,000 | | | 0 | |
| | | | | | | 2,800,020 | | | 0 | |
| | | | | | | | | |
| HALE.life Corporation (3)(5)(8) | | | Health Care Technology | | | | | | |
| Develops a platform to facilitate precision health and medicine | | | | | | | | | |
| Common Stock (acquired 3/1/16) | (I) (L3) | | | | 1,000,000 | | 10 | | | 31,155 | |
| Series Seed-1 Convertible Preferred Stock (acquired 3/28/17) | (I) (L3) | | | | 11,000,000 | | 1,896,920 | | | 561,053 | |
| Series Seed-2 Convertible Preferred Stock (acquired 12/28/18) | (I) (L3) | | | | 12,083,132 | | 2,500,000 | | | 668,023 | |
| | | | | | | 4,396,930 | | | 1,260,231 | |
| | | | | | | | | |
The accompanying notes are an integral part of these consolidated financial statements.
22
| | | | | | | | | | | | | | | | | | | | | | | | | | | | | |
| 180 DEGREE CAPITAL CORP. CONSOLIDATED SCHEDULE OF INVESTMENTS AS OF DECEMBER 31, 2021 |
| | | | | | | | | |
| Method of
Valuation (1) | | Industry | | Shares/Principal | | Cost | | Value |
| | | | | | | | | | | | | | | | | | | | | | | | | | | | | |
| Investments in Non-Controlled Affiliated Equity and Equity-Related Securities (2) - | | | | | | | | | |
| 37.7% of net assets at value (cont.) | | | | | | | | | |
| | | | | | | | | |
| Legacy Privately Held Equity and Equity-Related Securities - | | | | | | | | | |
| 4.8% of net assets at value (cont.) | | | | | | | | | |
| | | | | | | | | |
| TARA Biosystems, Inc. (3)(5)(8) | | | Life Sciences Tools & Services | | | | | | |
| Develops human tissue models for toxicology and drug discovery applications | | | | | | | | | |
| Common Stock (acquired 8/20/14) | (M) (L3) | | | | 2,000,000 | | $ | 20 | | | $ | 319,446 | |
| Series A Convertible Preferred Stock (acquired 3/31/17) | (M) (L3) | | | | 6,878,572 | | 2,545,493 | | | 2,670,081 | |
| Series A-2 Convertible Preferred Stock (acquired 4/18/19) | (M) (L3) | | | | 208,577 | | 100,000 | | | 80,964 | |
| | | | | | | 2,645,513 | | | 3,070,491 | |
| | | | | | | | | |
| Total Non-Controlled Affiliated Legacy Privately Held Equity and Equity-Related Securities (cost: $11,942,463) | | | | | | | | | $ | 5,275,293 | |
| | | | | | | | | |
| Total Investments in Non-Controlled Affiliated Equity and Equity-Related Securities (cost: $43,891,695) | | | | | | | | | $ | 41,634,881 | |
| | | | | | | | | |
| Controlled Affiliated Equity and Equity-Related Securities (2) - | | | | | | | | | |
| 6.2% of net assets at value | | | | | | | | | |
| | | | | | | | | |
| LS180 Acquisition Holdings, LLC (3)(5) | | | Specialized Finance | | | | | | |
| Holding company for Special Purpose Acquisition Company (SPAC) interests | | | | | | | | | |
| Membership Units (acquired 4/13/21) | (M) (L3) | | | | 1,300,000 | | $ | 13,000 | | | $ | 13,000 | |
| Unsecured Promissory Note, 0% (acquired 5/10/2021, maturing 12/31/22) | (M) (L3) | | | | $ | 50,000 | | | 50,000 | | | 50,000 | |
| Unsecured Promissory Note, 0% (acquired 9/7/21, maturing 12/31/22) | (M) (L3) | | | | $ | 50,000 | | | 50,000 | | | 50,000 | |
| | | | | | | 113,000 | | | 113,000 | |
| | | | | | | | | |
| Parabellum Acquisition Holdings, LLC (3)(5) | | | Specialized Finance | | | | | | |
| Holding company for Special Purpose Acquisition Company (SPAC) interests | | | | | | | | | |
| Membership Units (acquired 4/22/21) | (M) (L3) | | | | 693,151 | | 2,717,646 | | | 6,719,700 | |
| | | | | | | | | |
| Total Controlled Affiliated Equity and Equity-Related Securities (cost: $2,830,646) | | | | | | | | | $ | 6,832,700 | |
| | | | | | | | | |
The accompanying notes are an integral part of these consolidated financial statements.
23
| | | | | | | | | | | | | | | | | | | | | | | | | | | | | |
| 180 DEGREE CAPITAL CORP. CONSOLIDATED SCHEDULE OF INVESTMENTS AS OF DECEMBER 31, 2021 |
| | | | | | | | | |
| Method of
Valuation (1) | | Industry | | Shares/Principal | | Cost | | Value |
| | | | | | | | | | | | | | | | | | | | | | | | | | | | | |
| Total Investments in Publicly Traded Equity and Equity-Related Securities and Legacy Privately Held Equity and Equity-Related Securities (cost: $80,963,651) | | | | | | | | | $ | 99,187,871 | |
| | | | | | | | | |
| Derivative Securities - | | | | | | | | | |
| 0.2% of net assets at value | | | | | | | | | |
| | | | | | | | | |
| Unaffiliated Derivative Securities (2) - | | | | | | | | | |
| 0.0% of net assets at value | | | | | | | | | |
| | | | | | | | | |
| Magnolia Neurosciences Corporation (3)(5)(8) | | | Pharmaceuticals | | | | | | |
| Develops novel therapeutics for treatment of neurodegeneration | | | | | | | | | |
| Warrants for the Purchase of Common Stock expiring 8/3/28 (acquired 8/26/21) | (I) (L3) | | | | 138,059 | | $ | 112,854 | | | $ | 54,666 | |
| | | | | | | | | |
| NanoTerra, Inc. (3)(5)(11) | | | Research & Consulting Services | | | | | | |
| Develops surface chemistry and nano-manufacturing solutions | | | | | | | | | |
| Warrants for Series A-3 Preferred Stock expiring on 11/15/22 (acquired 11/15/12) | (I) (L3) | | | | 47,508 | | 35,403 | | | 0 | |
| | | | | | | | | |
| OpGen, Inc. (3) | | | Biotechnology | | | | | | |
| Developing tools for genomic sequence assembly and analysis | | | | | | | | | |
| Warrants for the Purchase of Common Stock expiring 2/17/25 | (I) (L3) | | | | 62 | | 785 | | | 0 | |
| | | | | | | | | |
| Total Unaffiliated Derivative Securities (cost: $149,042) | | | | | | | | | $ | 54,666 | |
| | | | | | | | | |
| Non-Controlled Affiliated Derivative Securities (2) - | | | | | | | | | |
| 0.2% of net assets at value | | | | | | | | | |
| | | | | | | | | |
| Potbelly Corporation (3)(13) | | | Restaurants | | | | | | |
| Operates a chain of sandwich shops | | | | | | | | | |
| Warrants for the Purchase of Common Stock expiring 2/12/26 | (I) (L3) | | | | 80,605 | | $ | 224,849 | | | $ | 205,313 | |
| | | | | | | | | |
| Total Non-Controlled Affiliated Derivative Securities (cost: $224,849) | | | | | | | | | $ | 205,313 | |
| | | | | | | | | |
| Total Derivative Securities (cost: $373,891) | | | | | | | | | $ | 259,979 | |
| | | | | | | | | |
| Total Investments (cost: $81,337,542) | | | | | | | | | $ | 99,447,850 | |
| | | | | | | | | |
The accompanying notes are an integral part of these consolidated financial statements.
24
| | | | | | | | | | | | | | | | | | | | | | | | | | | | | |
| 180 DEGREE CAPITAL CORP. CONSOLIDATED SCHEDULE OF INVESTMENTS AS OF DECEMBER 31, 2021 |
| | | | | | | | | |
| Method of
Valuation (1) | | Industry | | Shares/Principal | | Cost | | Value |
| | | | | | | | | | | | | | | | | | | | | | | | | | | | | |
| Other Financial Instruments (15) - | | | | | | | | | |
| | | | | | | | | |
| Unaffiliated Rights to Payments (Illiquid) (2) - | | | | | | | | | |
| 7.2% of net assets at value | | | | | | | | | |
| | | | | | | | | |
| | | Biotechnology | | | | | | |
| Rights to Milestone Payments from Acquisition of BioVex Group, Inc. (acquired 3/4/11) (3)(5)(8)(16) | (I) (L3) | | | | $ | 548,998 | | | $ | 548,998 | | | $ | 400,420 | |
| | | | | | | | | |
| | | Pharmaceuticals | | | | | | |
| Rights to Milestone Payments from Acquisition of Petra Pharma Corporation (acquired 5/14/20-8/26/21) (3)(5)(8)(17) | (I) (L3) | | | | $ | 6,320,438 | | | 6,320,438 | | | 7,612,339 | |
| | | | | | | | | |
| | | | | | | | | |
| Total Unaffiliated Rights to Payments (cost: $6,869,436) | | | | | | | | | $ | 8,012,759 | |
| | | | | | | | | |
| Total Investments in Publicly Traded and Privately Held Equity and Equity-Related Securities, Derivative Securities and Other Financial Instruments (cost: $88,206,978) | | | | | | | | | $ | 107,460,609 | |
The accompanying notes are an integral part of these consolidated financial statements.
25
180 DEGREE CAPITAL CORP.
NOTES TO CONSOLIDATED SCHEDULE OF INVESTMENTS AS OF DECEMBER 31, 2021
Notes to Consolidated Schedule of Investments
(1)See Note 2. Summary of Significant Accounting Policies: Portfolio Investment Valuations.
(2)Investments in unaffiliated securities consist of investments in which the Company owns less than five percent of the voting shares of the portfolio company. Investments in non-controlled affiliated securities consist of investments in which the Company owns five percent or more, but less than 25 percent, of the voting shares of the portfolio company, or where the Company controls one or more seats on the portfolio company’s board of directors but do not control the company. Investments in controlled affiliated securities consist of investments in which the Company owns 25 percent or more of the outstanding voting rights of the portfolio company or otherwise control the company, including control of a majority of the seats on the board of directors, or more than 25 percent of the seats on the board of directors, with no other entity or person in control of more director seats than us.
(3)Represents a non-income producing investment. Investments that have not paid dividends or interest within the last 12 months or are on non-accrual status for at least 12 consecutive months are considered to be non-income producing.
(4)The identities of these securities have been concealed to protect the Company while it completes a purchase or selling program for these securities.
(5)The Company is subject to legal restrictions on the sale of all or a portion of our investment(s) in this company. The total amount of restricted securities held is $41,816,804, or 37.8 percent of net assets.
(6)The Company received LLC Interests of 1.25 percent in AutoTech Ventures Management I, LLC ("AutoTech") pursuant to an Administrative Services Agreement between us and AutoTech and due to us following the termination of a former employee of the Company. These LLC Interests were separate from the compensation received for providing the administrative services under the agreement that were paid in cash. The LLC interests have a capital percentage of 0 percent.
(7)The Company initially invested in D-Wave Systems, Inc. starting in 2008 and through 2014, acquiring various classes of preferred stock. On April 14, 2020, D-Wave Systems, Inc. reorganized as a subsidiary of a new company, DWSI Holdings, Inc. ("DWSI"). As part of the reorganization, all of the outstanding stock of D-Wave Systems, Inc., was consolidated into a single class of preferred stock of DWSI on a one-for-one basis. DWSI then completed a 1-for-5 reverse stock split. In January 2021, D-Wave Systems completed an amalgamation of the reorganized business and changed its corporate name back to D-Wave Systems, Inc. The company is located and doing business primarily in Canada.
(8)These securities are held by the Company's wholly owned subsidiary, 180 Degree Private Holdings, LLC ("180PH"), which were transferred from the Company to 180PH in the fourth quarter of 2020. The acquisition dates of the securities reflect the dates such securities were obtained by the Company rather than the transfer date.
(9)The Company invested in Nanosys, Inc. in rounds of financing that occurred in 2003, 2004 and 2005. In May 2021, Nanosys completed a restructuring of its capitalization table that resulted in shares of Series C and Series D Preferred Stock being converted into shares of Series A-2 Preferred Stock and Series E Preferred Stock being converted into shares of Series A-1 Preferred Stock. The date of acquisition listed reflects the date of this conversion rather than the date of our investment in the company.
(10)The Company received shares of Ravenna Pharmaceuticals, Inc., as part of the consideration of the acquisition of Petra Pharma Corporation.
(11)Represents a non-operating entity that exists to collect future payments from licenses or other engagements, monetize assets for future distributions to investors and debt holders, or is in the process of shutting down and distributing remaining assets according to a liquidation waterfall.
(12)ORIG3N, Inc., changed its name to Seaport Diagnostics, Inc. in April 2021.
The accompanying notes are an integral part of these consolidated financial statements.
26
180 DEGREE CAPITAL CORP.
NOTES TO CONSOLIDATED SCHEDULE OF INVESTMENTS AS OF DECEMBER 31, 2021
(13)The Company is the Investment Manager of a separately managed account ("SMA") that owns shares of these portfolio companies. Under our investment management agreement for this SMA, the Company has the right to control the votes of the securities held by the SMA. The Company has voting ownership between 5 percent and 25 percent in these companies when the shares held by us and our SMA are aggregated.
(14)The Company received common stock from the conversion of its holdings of its Series H Convertible Preferred Stock, Series I Convertible Preferred Stock and its Series J Convertible Preferred Stock.
(15)Other financial instruments are holdings of the Company that do not meet the definition of a security or a derivative.
(16)If all the remaining milestones are met, the Company would receive $4,141,910. There can be no assurance as to how much of these amounts the Company will ultimately realize or when they will be realized, if at all.
(17)If all the remaining milestones are met, the Company would receive $86,856,139. There can be no assurance as to how much of these amounts the Company will ultimately realize or when they will be realized, if at all.
The accompanying notes are an integral part of these consolidated financial statements.
27
180 DEGREE CAPITAL CORP.
NOTES TO CONSOLIDATED FINANCIAL STATEMENTS
NOTE 1. THE COMPANY
180 Degree Capital Corp. (f/k/a Harris & Harris Group, Inc.) (the "Company," "us," "our" and "we"), withdrew its election to be treated as a business development company on March 30, 2017, and subsequently returned to its prior status as a registered non-diversified closed-end management investment company ("Closed-End Fund" or "CEF") under the Investment Company Act of 1940 (the "1940 Act"). We operate as an internally managed investment company whereby our officers and employees, under the general supervision of our Board of Directors, conduct our operations. As of May 22, 2020, we are also registered with the Securities and Exchange Commission as a Registered Investment Adviser under the Investment Advisers Act of 1940 (the "Advisers Act").
180 Degree Private Holdings, LLC ("180PH"), is a wholly owned limited liability company that was created in October 2020 to hold certain of the Company's securities of privately held companies. 180PH is consolidated for financial reporting purposes and is a disregarded entity for tax purposes under the Code.
180 Degree Capital BD, LLC ("180BD") is a 100 percent owned subsidiary of the Company. 180BD was formed to provide services to the Company related to fundraising for co-investment funds and not for investment returns. 180BD is a registered broker-dealer with the Financial Industry Regulatory Authority ("FINRA"). The Company consolidates 180BD for financial reporting purposes. 180BD is currently a disregarded entity for tax purposes under the Code.
The Company is the Managing Member of 180 Degree Capital Management, LLC ("180CM"), a limited liability company formed to facilitate the opportunity for interested investors to co-invest alongside the Company in individual publicly traded portfolio companies. As of December 31, 2021, the Company has no capital under management in 180CM. A Series of 180CM, 180.2 SPV Series ("180.2 SPV") was liquidated during the year.
The Company is the General Partner of 180 Phoenix Fund, L.P. ("180 Phoenix"), a limited partnership formed to facilitate management of a fund that was formed to co-invest alongside the Company in its publicly traded companies on an on-going basis. As of December 31, 2021, 180 Phoenix did not have any capital under management.
As of December 31, 2021, the Company has approximately $38.0 million in net assets in a separately managed account ("SMA").
In December 2021, the Company dissolved its 100 percent owned subsidiary H&H Ventures Management, Inc.("Ventures"). Ventures was taxed under Subchapter C (a "C Corporation") of the Internal Revenue Code of 1986 (the "Code"). The Company also dissolved Harris Partners I, L.P ("Partners I"), a limited partnership where the partners were Ventures (sole general partner) and the Company (sole limited partner). Ventures paid taxes on income generated by its operations as well as on any non-passive investment income generated by Partners I. For the year ended December 31, 2021, there was no non-passive investment income generated by Partners I. Ventures, as the sole general partner, consolidated Partners I. The Company consolidated Ventures for financial reporting purposes.
In December 2021, the Company also dissolved H&H Co-Investment Partners, LLC, a limited liability company formed to facilitate the opportunity for interested investors to co-invest alongside the Company in its private portfolio companies. The Company was the Managing Member H&H Co-Investment Partners.
The Company may, in certain cases, receive management fees and carried interest on profits generated on invested capital from any capital under management if and when capital is raised and if and when profits are realized, respectively. The Company does not consolidate the operations of any capital managed in separate series of 180CM, or in the separately managed account and it does not expect to consolidate the operations of any capital managed in 180 Phoenix if and when the entity has capital under management.
Following receipt of approval from shareholders at an annual meeting of shareholders held on May 14, 2020, the Company filed an amendment to its Amended and Restated Certificate of Incorporation on December 31, 2020, to affect a reverse stock split of its issued and outstanding shares of common stock, at a ratio of one share for three shares. All share amounts, per share data and operating performance have been adjusted to reflect the reverse stock split.
NOTE 2. SUMMARY OF SIGNIFICANT ACCOUNTING POLICIES
The following is a summary of significant accounting policies followed in the preparation of the consolidated financial statements:
Principles of Consolidation. The consolidated financial statements have been prepared in accordance with accounting principles generally accepted in the US ("GAAP") and Articles 6 and 12 of Regulation S-X of the SEC and include the accounts of the Company and its wholly owned subsidiaries. The Company is an investment company following accounting and reporting guidance in Accounting Standards Codification 946. In accordance with GAAP and Regulation S-X under 17 C.F.R. Part 210, the Company may only consolidate its interests in investment company subsidiaries and controlled operating companies whose business consists of providing services to the Company. Our wholly owned subsidiary, 180BD, is a controlled operating company that provide services to us and is, therefore, consolidated. All significant intercompany accounts and transactions have been eliminated in the consolidation.
Use of Estimates. The preparation of the consolidated financial statements in conformity with GAAP requires management to make estimates and assumptions that affect the reported amounts of assets and liabilities and contingent assets and liabilities and the reported amounts of revenues and expenses. Actual results could differ from these estimates, and the differences could be material. The most significant estimates relate to the fair valuations of our investments.
Portfolio Investment Valuations. Investments are stated at "value" as defined in the 1940 Act and in the applicable regulations of the SEC and in accordance with GAAP. Value, as defined in Section 2(a)(41) of the 1940 Act, is (i) the market price for those securities for which a market quotation is readily available and (ii) the fair value as determined in good faith by, or under the direction of, the Board of Directors for all other assets. The Valuation Committee, comprised of all of the independent Board members, is responsible for determining the valuation of the Company’s assets within the guidelines established by the Board of Directors. The Valuation Committee receives information and recommendations from management. An independent valuation firm also reviews select portfolio company valuations. The independent valuation firm does not provide independent valuations. The fair values assigned to these investments are based on available information and do not necessarily represent amounts that might ultimately be realized when that investment is sold, as such amounts depend on future circumstances and cannot reasonably be determined until the individual investments are actually liquidated or become readily marketable. The Valuation Committee values the Company's investment assets as of the end of each calendar quarter and as of any other time requested by the Board of Directors.
Accounting Standards Codification Topic 820, "Fair Value Measurements," ("ASC 820") defines fair value as the price that would be received to sell an asset or paid to transfer a liability in an orderly transaction between market participants at the measurement date (exit price). It applies fair value terminology to all valuations whereas the 1940 Act applies market value terminology to readily marketable assets and fair value terminology to other assets.
The main approaches to measuring fair value utilized are the market approach, the income approach and the hybrid approach.
•Market Approach (M): The market approach focuses on inputs and not techniques. The market approach may use quantitative inputs such as prices and other relevant information generated by market transactions involving identical or comparable assets or liabilities and the values of market multiples derived from a set of comparable companies. The market approach may also use qualitative inputs such as progress toward milestones, the long-term potential of the business, current and future financing requirements and the rights and preferences of certain securities versus those of other securities. The selection of the relevant inputs used to derive value under the market approach requires judgment considering factors specific to the significance and relevance of each input to deriving value.
•Income Approach (I): The income approach focuses on techniques and not inputs. The income approach uses valuation techniques to convert future amounts (for example, revenue, cash flows or earnings) to a single present value amount (discounted). The measurement is based on the value indicated by current market expectations about those future amounts. Those valuation techniques include present value techniques; option-pricing models, such as the Black-Scholes-Merton formula (a closed-form model) and a binomial model (a lattice model), which incorporate present value techniques; and the multi-period excess earnings method, which is used to measure the fair value of certain assets.
•Hybrid Approach (H): The hybrid approach uses elements of both the market approach and the income approach. The hybrid approach calculates values using the market and income approach, individually. The resulting values are then distributed among the share classes based on probability of exit outcomes.
ASC Topic 820 classifies the inputs used to measure fair value by these approaches into the following hierarchy:
•Level 1 (L1): Unadjusted quoted prices in active markets for identical assets or liabilities;
•Level 2 (L2): Inputs other than quoted prices included within Level 1 that are observable for the asset or liability, either directly or indirectly. These include quoted prices in active markets for similar assets or liabilities, or quoted prices for identical or similar assets or liabilities in markets that are not active, or inputs other than quoted prices that are observable for the asset or liability, either directly or indirectly, for substantially the full term of the financial instrument. Level 2 inputs are in those markets for which there are few transactions, the prices are not current, little public information exists or instances where prices vary substantially over time or among brokered market makers; and
•Level 3 (L3): Inputs to the valuation methodology are unobservable and significant to the fair value measurement. Unobservable inputs are those inputs that reflect our own assumptions that market participants would use to price the asset or liability based upon the best available information.
Financial assets and liabilities are classified in their entirety based on the lowest level of input that is significant to the fair value measurement and are not necessarily an indication of risks associated with the investment.
As of December 31, 2021, our financial statements include investments fair valued by the Board of Directors of $53,832,187. The fair values were determined in good faith by, or under the direction of, the Board of Directors. The fair value amount includes the values of our investments in legacy privately held companies and rights to future milestone payments, as well as our membership units of Parabellum Acquisition Holdings, LLC, an entity through which we own shares and warrants of Parabellum Acquisition Corp., our membership units of LS180 Acquisition Holdings, LLC, our common stock of TheMaven, Inc., our common stock of Armstrong Flooring, Inc., and our warrants of OpGen, Inc. and Potbelly Corporation, which are securities of publicly traded companies.
Cash. Cash includes demand deposits. Cash is carried at cost, which approximates fair value.
Restricted Cash. The Restricted cash, net of any future costs related to the expired sublease, was remitted to the sub-lease tenant during the year.
Unaffiliated Rights to Payments. At December 31, 2021, the outstanding potential milestone payments from Amgen, Inc.’s acquisition of BioVex Group, Inc., were valued at $400,420. At December 31, 2021, the outstanding potential milestone payments from the acquisition of Petra Pharma Corporation by an undisclosed acquirer unrelated to the Company were valued at $7,612,339. The milestone payments are valued using the probability-adjusted, present value of proceeds from future payments that would be due upon successful completion of certain regulatory and sales milestones. There can be no assurance as to how much of these amounts we will ultimately realize or when they will be realized, if at all.
Prepaid Expenses. We include prepaid insurance premiums and deferred financing charges in "Prepaid expenses." Prepaid insurance premiums are recognized over the term of the insurance contract and are included in "Insurance" in the Company's Consolidated Statement of Operations.
Property and Equipment. Property and equipment are included in "Other assets" and are carried at $20,590 at December 31, 2021, representing cost of $221,868, less accumulated depreciation of $201,278. Depreciation is provided using the straight-line method over the estimated useful lives of the property and equipment. We estimate the useful lives to be five to ten years for furniture and fixtures, and three years for computer equipment.
Post-Retirement Plan Liabilities. Until it was terminated on April 27, 2017, the Company provided a Retiree Medical Benefit Plan for employees who met certain eligibility requirements. Until it was terminated on May 5, 2011, the Company also provided an Executive Mandatory Retirement Benefit Plan for certain individuals employed by us in a bona fide executive or high policy-making position. The net periodic post-retirement benefit cost includes service cost and interest cost on the accumulated post-retirement benefit obligation. Unrecognized actuarial gains and losses are recognized as net periodic benefit cost, pursuant to the Company's historical accounting policy in "Salaries, bonus and benefits" in the Company's Consolidated Statement of Operations. The impact of plan amendments was amortized over the employee's average service period as a reduction of net periodic benefit cost. Unamortized prior service cost was fully amortized during 2017 as a result of the termination of the Retiree Medical Benefit Plan.
Interest Income Recognition. Interest income, including amortization of premium and accretion of discount, is recorded on an accrual basis. When accrued interest is determined not to be recoverable, the Company ceases accruing interest and writes off any previously accrued interest. Write-offs are netted in interest income. During the year ended December 31, 2021, the Company recorded on a net basis, $311,794 of bridge note payment-in-kind ("PIK") interest. Securities are deemed to be non-income producing if investments have not paid dividends or interest within the last 12 months or are on non-accrual status for at least 12 consecutive months.
When the fair value of a security that includes PIK interest is less than the accrued interest, the Company may place the security on non-accrued status. Starting April 1, 2018 and through March 31, 2021, Black Silicon Holdings, Inc., a prior legacy privately held company, was on non-accrued status. As of April 1, 2021, the debt security was considered to be income producing and interest income was accrued during the year starting from April 1, 2021. Total interest income accrued during the year ended December 31, 2021 was $348,592 and included in "Non-controlled affiliated companies-PIK" in the Company's Consolidated Statement of Operations. Starting January 1, 2021, ABSMaterials, Inc., a prior legacy privately held company, was placed on non-accrual status and all accrued interest income from prior periods of $47,161 was reversed in "Non-controlled affiliated companies-PIK" in the Company's Consolidated Statement of Operations.
Board Fees From Portfolio Companies. During the year ended December 31, 2021, the Company earned $31,449 in non-cash income, owing to certain of its employees serving as members of the board of directors of Synacor, Inc. The Company recognizes revenues from fee income from board fees as those services are provided.
Management Fees and Performance Fees/Carried Interest from Managed Funds. As a Registered Investment Adviser under the Advisers Act, the Company may be entitled to receive management fees and performance fees from clients including separately managed accounts (SMAs) and special purpose vehicles (SPVs). The Company does not currently collect a management fee on our SMA. When applicable, the Company accrues management fees on our SPVs that are to be paid upon liquidation of the entity regardless of performance. The management fees from 180.2 SPV were paid during the year following the liquidation of the entity. Performance fees or carried interest, if any, is paid annually by our SMA based on a fixed percentage of the increase in net assets during the year. Performance fees on SPVs, if any, are generally paid based on the amount of increase in net assets at the time of any distribution of capital above the amount of initial invested capital plus accrued expenses. The timing and payment terms of management fees and performance fees for future client accounts may be different than those of our current SMA and SPV.
Expenses that are the responsibility of client accounts are generally paid for by the Company and then reimbursed at a future date by the client accounts. Our SMA generally pays any reimbursable expenses within 30 days of invoice. 180.2 SPV paid the accrued amount of expenses at the time of liquidation in April 2021. As of December 31, 2021, $152,151 of expenses reimbursable to us by 180 Phoenix for formation expenses is included in “Receivable from managed funds” in our Consolidated Statement of Assets and Liabilities. If we are unable to raise funds for 180 Phoenix, or if the terms under which we raise capital do not include reimbursement for formation costs, we may not be able to collect on this receivable.
The inception to date collected management fee income from 180.2 SPV for the year ended December 31, 2021, was $77,312. Management fee income for the year ended December 31, 2021, for 180.2 SPV was $6,083. Management fee income from 180.2 SPV for the year ended December 31, 2021, is recorded in "Management fee income" in the Company's Consolidated Statement of Operations. During the year ended December 31, 2021, 180.2 SPV was liquidated.
The Company does not include accruals for carried interest in the consolidated financial statements until such carried interest is received and/or the Company concludes that it is probable that a reversal of any accrual will not occur. The Company accrued $2,167,107 in carried interest from its SMA in the year ended December 31, 2021 and is included in “Receivable from managed funds” in our Consolidated Statement of Assets and Liabilities.
Other Income. The Company may purchase restricted securities issued by publicly traded companies that include provisions that provide for payment of partial liquidated damages in the event the issuer does not meet obligations specified in the purchase agreement or other ancillary documents associated with the transaction. These obligations most commonly are associated with the filing of registration statements and/or being up to date with the filing of the issuer's financial statements with the SEC. As of December 31, 2021, the Company is due $891,937 in partial liquidated damages from TheMaven, Inc., one of its publicly traded portfolio companies, as a result of the delay in filing of registration statements related to the Company's securities of TheMaven, Inc., and from the delay in it filing of up-to-date financial information with the SEC. The amount for partial liquidated damages accrued in 2021 is $96,944 and is recorded in "Other income" in the Company's Consolidated Statement of Operations and is included in "Receivable from portfolio companies" in the Company's Consolidated Statement of Assets and Liabilities.
Black Silicon Holdings, Inc. was sold during the year. The Company received $99,129 in fees for oversight of the entity which is included in "Other income" in the Company's Consolidated Statement of Operations.
Our lease at 1450 Broadway, New York, New York, commenced on January 21, 2010. The lease expired on December 31, 2019. Under the terms of the lease, the Company provided a security deposit of $62,100 to the landlord that was to be returned to the Company, less any unpaid expenses, upon the expiration of the lease. During 2020, the Company wrote off this security deposit as not collectable. During the year ended December 31, 2021, the Company collected $57,587 from the landlord which is included in "Other income" in the Company's Consolidated Statement of Operations.
Put and Call Options. The Company may purchase options on publicly traded securities as an investment and/or with the intention of limiting its downside risk. When the Company purchases an option, an amount equal to the premium paid is recorded in the Consolidated Statements of Assets and Liabilities as an investment. The Company may also purchase an option at one price and write/sell an option at another price in a simultaneous transaction referred to as a spread. The amount of these assets is subsequently marked-to-market to reflect the current value of the options. In the event that the options are exercised, the Company would be required to deliver those shares to the counterparty. When the options expire unexercised, the Company realizes a loss on the premium paid, or the difference between the premium paid and the premium received, as applicable.
Rent Expense. The Company currently leases and runs daily operations in approximately 1,250 square feet of office space in Montclair, New Jersey. Prior to November 17, 2021, the Company leased this space on a month-to-month basis at a base rent of approximately $26 per square foot per year. On November 17, 2021, the Company entered into a three-year lease extension that set the average base rent beginning January 1, 2022, at approximately $30 per square foot over the term of the extension. Either the Company or the landlord may terminate the lease at any time with two months' written notice to either party. As of December 31, 2021, the present value of the future lease payments (lease liability) is recorded as an asset and a liability in the Company's Consolidated Statement of Assets and Liabilities. The amount is calculated using weighted average discount rate of 1.32 percent and weighted based on the terms of the the lease agreement.
Realized Gain or Loss and Unrealized Appreciation or Depreciation of Portfolio Investments. Realized gain or loss is recognized when an investment is disposed of and is computed as the difference between the Company's cost basis in the investment at the disposition date and the net proceeds received from such disposition. Realized gain or loss on investment transactions are determined by specific identification. Unrealized appreciation or depreciation is computed as the difference between the fair value of the investment and the cost basis of such investment.
Income Taxes. As discussed in Note 9. Income Taxes, the Company did not qualify as a Regulated Investment Company ("RIC") under Subchapter M of the Code in 2021 and therefore will be taxed as a C Corporation. The Company did not accrue for any income taxes as of December 31, 2021 as it did not generate ordinary income. While the Company did not qualify as a RIC in 2021, it currently intends to qualify as a RIC in future years. The Company has capital loss carryforwards that can be used to offset net realized capital gains. The Company also has operating loss carryforwards that can be used to offset operating income and net realized capital gains in years when it fail to qualify as a RIC. The Company recognizes interest and penalties in income tax expense. See Note 9. Income Taxes for further discussion.
Foreign Currency Translation. The accounting records of the Company are maintained in U.S. dollars. All assets and liabilities denominated in foreign currencies are translated into U.S. dollars based on the rate of exchange of such currencies against U.S. dollars on the date of valuation. If Company has assets denominated in foreign currencies, it does not isolate the portion of the results of operations that arises from changes in foreign currency rates on investments held on its Consolidated Statement of Operations.
Securities Transactions. Securities transactions are accounted for on the date the transaction for the purchase or sale of the securities is entered into by the Company (i.e., trade date). Securities transactions outside conventional channels, such as private transactions, are recorded as of the date the Company obtains the right to demand the securities purchased or to collect the proceeds from a sale and incurs the obligation to pay for the securities purchased or to deliver the securities sold.
Concentration of Credit Risk. The Company places its cash with financial institutions and, at times, cash held in depository accounts may exceed the Federal Deposit Insurance Corporation's insured limit and is subject to the credit risk of such institutions to the extent it exceeds such limit.
NOTE 3. BUSINESS RISKS AND UNCERTAINTIES
Our business activities contain elements of risk. We consider the principal types of market risk to be valuation risk, diversification risk, interest rate risk and foreign currency risk. Although we are risk-seeking rather than risk-averse in our investments, we consider the management of risk to be essential to our business.
Investment Objective
Our investment objective is to generate capital appreciation and current income from investments and investment-related activities such as managed funds and accounts.
Investment Strategy
Our investment strategy on future new investments is focused on generating capital appreciation and current income from investments in what we believe are deeply undervalued, small publicly traded companies where we believe we can positively impact the business and valuation through constructive activism. Historically, our investment strategy was to achieve long-term capital appreciation investing in venture capital investments, to which we provided strategic, operational and management resources, and creative financial solutions. While we continue to provide such resources to our existing legacy portfolio companies, we no longer make venture capital investments. We classify our legacy portfolio companies as Legacy Privately Held Equity and Equity-Related Securities.
We believe we combine new perspectives with the historical knowledge and experience of managing the current portfolio. Our investment approach is comprised of a patient examination of available opportunities through due diligence and close involvement with management of our portfolio companies. We invest our capital directly into portfolio companies or through purchases of securities of publicly traded companies directly and through open-market purchases. We may seek to invest our capital alongside capital from other investors through that we control.
We have discretion in the investment of our capital to achieve our objectives by investing in various types of assets, and we do not currently limit our investments to any security type. Our investments may include, among other asset types: equity, equity-related securities (including warrants and options) and debt with equity features from either private or public issuers; debt obligations of all types having varying terms with respect to security or credit support, subordination, purchase price, interest payments and maturity; foreign securities; and miscellaneous investments.
Investment Policies
Fundamental policies may not be changed without the approval of the holders of a majority of our voting securities, as defined in the 1940 Act. As a matter of fundamental policy, the Company will not:
(1) Issue senior securities, borrow money from banks, brokers or other lenders, or engage in transactions involving the issuance by us of "senior securities" representing indebtedness, except to the extent permitted under the 1940 Act or the rules, regulations or interpretations thereof.
(2) Underwrite securities of other issuers, except insofar as we may be deemed an underwriter under the Securities Act of 1933, as amended (the "Securities Act"), in connection with the disposition of our portfolio securities. We may invest in restricted securities (those that must be registered under the Securities Act before they may be offered or sold to the public) to the extent permitted by the 1940 Act or the rules, regulations or interpretations thereof.
(3) Invest more than 25% of our total assets in the securities of companies or entities engaged in any one industry, or group of industries. This limitation does not apply to investment in the securities of the U.S. Government, its agencies or instrumentalities.
(4) Purchase or sell real estate or interests in real estate (except that we may (a) purchase and sell real estate or interests in real estate in connection with the orderly liquidation of investments, or in connection with foreclosure on collateral, or (b) own the securities of companies that are in the business of buying, selling or developing real estate).
(5) Purchase or sell commodities or commodity contracts, but we may purchase and sell foreign currency and enter into foreign currency forward contracts, and may engage in other transactions in financial instruments, in each case to the extent permitted under the Company's investment policies as in effect from time to time.
(6) Make loans of money or securities to other persons, except through purchasing fixed-income securities or other debt instruments, lending portfolio securities or entering into repurchase agreements in a manner consistent with our investment policies. With respect to these investment restrictions, if a percentage restriction is adhered to at the time of entering into the investment or transaction, a later change in percentage resulting from a change in the values of investments or the value of our total assets, unless otherwise stated or required by law, will not constitute a violation of the restriction or policy.
Valuation Risk
Value, as defined in Section 2(a)(41) of the 1940 Act, is (i) the market price for those securities for which market quotations are readily available and (ii) fair value as determined in good faith by, or under the direction of, the Board of Directors for all other assets. See Note 2. Summary of Significant Accounting Policies for further discussion. In December 2020, the SEC adopted Rule 2a-5 under the 1940 Act governing fund valuation practices. The rule establishes certain requirements for determining fair value in good faith, and defines when market quotations are considered to be "readily available" for purposes of the 1940 Act. We continue to monitor and assess the impact that this provision may have on the Company's consolidated financial statements.
We historically invested in privately held companies, the securities of which are inherently illiquid. We are currently focused on investing in what we believe are deeply undervalued microcapitalization publicly traded companies. Our publicly traded and public company-related securities account for approximately 68 percent of the value of our portfolio of investments. Although these companies are publicly traded, their stock may not trade at high volumes and/or we may own a significant portion of a company's outstanding stock, which may restrict our ability to sell our positions in an orderly fashion and prices at which sales can be made may be volatile and materially different than the closing prices of such positions at each financial statement date. We may also be subject to restrictions on transfer and/or other lock-up provisions after these companies complete public offerings and/or if we invest in unregistered securities of public companies. Many of our privately held and publicly traded companies tend to not have attained profitability, and many of these companies also lack management depth and have limited or no history of operations. Because of the speculative nature of our investments and the lack of a liquid market for and restrictions on transfers of privately held investments, there is greater risk of loss relative to traditional marketable investment securities.
Approximately 50 percent of our portfolio was fair valued and comprised of securities of legacy privately held companies and rights to potential future milestone payments, as well as our common stock of Armstrong Flooring and TheMaven, Inc. (Level 2 investments) and our warrants of OpGen, Inc. and Potbelly Corporation (Level 3 investments) which are securities of publicly traded companies and our membership units of LS180 Acquisition Holdings, LLC and Parabellum Acquisition Holdings, LLC (Level 3 investments) which are holding companies for special purpose acquisition company (SPAC) interests. Because there is typically no public or readily ascertainable market for our interests in the small privately held companies in which we invest, the valuation of the securities in that portion of our portfolio is determined in good faith by our Valuation Committee, which is comprised of all of the independent members of our Board of Directors. The values are determined in accordance with our Valuation Procedures and are subject to significant estimates and judgments. The fair value of the securities in our portfolio may differ significantly from the values that would be placed on these securities if a ready market for the securities existed. Additionally, inputs may become available after a financial statement date that could result in a material change in value at a future financial statement date from the value reported in the current financial statements. Any changes in valuation are recorded in the Company's Consolidated Statement of Operations as "Change in unrealized appreciation (depreciation) on investments." Changes in valuation of any of our investments in privately held companies from one period to another may be significant.
Diversification Risk
While we are subject to certain diversification requirements regarding the concentration of investments in any one industry or group of industries, we do not choose investments based on a strategy of diversification. We also do not rebalance the portfolio should one of our portfolio companies increase in value substantially relative to the rest of the portfolio. Therefore, the value of our portfolio may be more vulnerable to microeconomic events affecting a single sector, industry or portfolio company and to general macroeconomic events that may be unrelated to our portfolio companies. These factors may subject the value of our portfolio to greater volatility than a company that follows a diversification strategy. As of December 31, 2021 our largest 10 investments by value accounted for approximately 74 percent of the value of our investment portfolio. Our largest three investments, by value, AgBiome, LLC, TheMaven, Inc., and Synchronoss Technologies, Inc., accounted for approximately 12 percent, 9 percent and 9 percent, respectively, of our investment portfolio at December 31, 2021. AgBiome, LLC, is a privately held portfolio company and TheMaven, Inc. and Synchronoss Technologies, Inc. are publicly traded companies.
Interest Rate Risk
Interest rate sensitivity refers to the change in earnings that may result from changes in the level of interest rates. We may invest in both short- and long-term U.S. government and agency securities. To the extent that we invest in short- and long-term U.S. government and agency securities, changes in interest rates result in changes in the value of these obligations that result in an increase or decrease of our net asset value. The level of interest rate risk exposure at any given point in time depends on the market environment, the expectations of future price and market movements, and the quantity and duration of long-term U.S. government and agency securities held by the Company, and it will vary from period to period.
In addition, market interest rates for high-yield corporate debt may be an input in determining value of our investments in debt securities of privately held and publicly traded companies. Significant changes in these market rates could affect the value of our debt securities as of the valuation date of measurement of value. While we do not currently have any investments in debt securities with floating interest rates, investment income in such securities should we acquire them in the future could be adversely affected by changes in interest rates, including any that might result from the anticipated transition away from the London Interbank Offered Rate ("LIBOR"). In March 2021, LIBOR's administrator announced that most LIBOR settings will no longer be published after the end of 2021, and that a majority of U.S. dollar LIBOR settings will no longer be published after June 30, 2023. To the extent we acquire investments with floating interest rates tied to LIBOR, this transition could result in losses for the Company.
Foreign Currency Risk
Our investments are not subject to foreign currency risk as they are all denominated in U.S. dollars. We have one investment in a company based in Canada, D-Wave Systems, Inc., however the price per share and terms of those shares are denominated in U.S. dollars.
Coronavirus (COVID-19) Pandemic
In March 2020, the World Health Organization declared COVID-19 (a novel coronavirus) to be a pandemic. The situation is dynamic. Global financial markets have experienced and may continue to experience significant volatility resulting from the spread of COVID-19. The outbreak of COVID-19 has resulted in travel and border restrictions, quarantines, supply chain disruptions, lower consumer demand and general market uncertainty. The global economy, the economies of certain nations and individual issuers have been and may continue to be adversely affected by COVID-19, particularly in light of the interconnectivity between economies and financial markets, all of which may negatively impact the Company's performance. In addition, COVID-19 and governmental responses to COVID-19 may negatively impact the capabilities of the Company's service providers and disrupt the Company's operations.
Beginning in the first quarter of 2021, there has been a trend in many parts of the world of increasing availability and administration of vaccines against COVID-19, as well as an easing of restrictions on social, business, travel and government activities and functions. On the other hand, infection rates and regulations continue to fluctuate in various regions and there are ongoing global impacts resulting from the pandemic, including challenges and increases in costs for logistics and supply chains, such as increased port congestion, intermittent supplier delays and a shortfall of microchip supply. Management of the Company will continue to monitor the impact of COVID-19 on its business.
NOTE 4. FAIR VALUE OF INVESTMENTS
At December 31, 2021, our financial assets valued at fair value were categorized as follows in the fair value hierarchy:
| | | | | | | | | | | | | | | | | | | | | | | | | | |
| | | Fair Value Measurement at Reporting Date Using: |
Description | | Unadjusted Quoted Prices in Active Markets for Identical Assets (Level 1) | |
Significant Other Observable Inputs (Level 2) | |
Significant Unobservable Inputs (Level 3) | | December 31, 2021 |
| Legacy Privately Held Securities: | | | | | | | | |
| Preferred Stock / Units | | $ | 0 | | | $ | 0 | | | $ | 26,324,664 | | | $ | 26,324,664 | |
| Bridge / Promissory Notes | | 0 | | | 0 | | | 0 | | | 0 | |
| Common Stock / Membership Units | | 0 | | | 0 | | | 367,015 | | | 367,015 | |
| Warrants | | 0 | | | 0 | | | 54,666 | | | 54,666 | |
| LLC Interests | | 0 | | | 0 | | | 225,000 | | | 225,000 | |
| | | | | | | | |
| Publicly Traded and Public-Related Portfolio Companies: | | | | | | | | |
| Preferred Stock | | $ | 0 | | | $ | 0 | | | $ | 0 | | | $ | 0 | |
| Bridge / Promissory Notes | | 0 | | | 0 | | | 100,000 | | | 100,000 | |
| Common Stock / Membership Units | | 53,628,422 | | | 11,810,070 | | | 6,732,700 | | | 72,171,192 | |
| Warrants | | 0 | | | 0 | | | 205,313 | | | 205,313 | |
| Total Investments: | | $ | 53,628,422 | | | $ | 11,810,070 | | | $ | 34,009,358 | | | $ | 99,447,850 | |
| | | | | | | | |
| Other Financial Instruments: | | | | | | | | |
| Rights to Milestone Payments | | $ | 0 | | | $ | 0 | | | $ | 8,012,759 | | | $ | 8,012,759 | |
| Total Financial Assets: | | $ | 53,628,422 | | | $ | 11,810,070 | | | $ | 42,022,117 | | | $ | 107,460,609 | |
Significant Unobservable Inputs
The table below presents the valuation technique and quantitative information about the significant unobservable inputs utilized by the Company in the fair value measurements of Level 3 assets. Unobservable inputs are those inputs for which little or no market data exists and, therefore, require an entity to develop its own assumptions.
| | | | | | | | | | | | | | | | | | | | | | | |
| Value as of December 31, 2021 | | Valuation Approach(es) | | Unobservable Input(s) | | Range(s) (Weighted Average(a)) |
| | | | | | | |
| | | | | Public Comparable Adjustment (Including Non-Performance Risk) | | 0.0% (0.0%) |
| | | | | Price Per Share | | $5.93 ($5.93) |
| | | | | Volatility | | 77.8% (77.8%) |
| Preferred Stock / Units | $ | 12,407,816 | | | Hybrid Approach | | Time to Exit / Cash Flows (Years) | | 5.0 (5.0) |
| | | | | | | |
| | | | | Price Per Share | | $0.00 - $1.00 ($0.40) |
| | | | | Public Comparable Adjustment (Including Non-Performance Risk) | | -75.0% - -46.4% (-60.0%) |
| | | | | Volatility | | 88.3% - 102.3% (93.3%) |
| Preferred Stock / Units | 2,721,121 | | | Income Approach | | Time to Exit / Cash Flows (Years) | | 4.1 - 5.0 (4.8) |
| | | | | Probability of Achieving Independent Milestones | | 75.0% - 99.0% (82.8%) |
| | | | | Time to Cash Flows (Years) | | 0.25 - 2.5 (1.6) |
| | | | | Volatility | | 73.0% - 144.7% (126.0%) |
| | | | | Public Comparable Adjustment (Including Non-Performance Risk) | | 81.2% (81.2%) |
| | | | | Revenue Multiples | | 8.4 (8.4) |
| | | | | Time to Exit/Lapse of Restrictions (Years) | | 0.2 - 1.0 (0.4) |
| | | | | Discount for Lack of Marketability | | 14.3% - 17.4% (15.1%) |
| Preferred Stock / Units | 11,195,727 | | | Market Approach | | Price Per Share | | $1.24 - $8.85 ($8.05) |
| Bridge / Promissory Notes | 0 | | | Income Approach | | Estimated Value to Cost Ratio at Payout | | 0.00 (0.00) |
| | | | | | | |
| | | | | | | |
| | | | | | | |
| Bridge / Promissory Notes | 100,000 | | | Market Approach | | Estimated Value to Cost Ratio at Payout | | 1.00 (1.00) |
| | | | | | | |
| | | | | | | |
| | | | | Public Comparable Adjustment (Including Non-Performance Risk) | | -75.0% (-75.0%) |
| | | | | Volatility | | 88.3% (88.3%) |
| | | | | Time to Exit (Years) | | 5.0 (5.0) |
| Common Stock / Membership Units | 31,155 | | | Income Approach | | Price Per Share | | $0.00 - $0.21 ($0.21) |
| | | | | Probability of Successful SPAC Merger Transaction | | 75% (75%) |
| | | | | Probability of Achieving Independent Milestones | | 12.5%-25.0% (20.6%) |
| | | | | Probability of Achieving Dependent Milestones | | 6.0%-9.2% (7.7%) |
| | | | | Time to Cash Flows (Years) | | 1.8-4.7 (2.9) |
| | | | | Volatility | | 78.6% (78.6%) |
| | | | | Time to Exit/Lapse of Restrictions (Years) | | 0.2 - 4.8 (0.4) |
| | | | | Discount for Lack of Marketability | | 6.9% (6.9%) |
| Common Stock / Membership Units | 7,068,560 | | | Market Approach | | Price Per Share | | $0.01 - $0.01 ($0.01) |
| | | | | Price Per Share | | $0.00 - $0.43 ($0.43) |
| | | | | Volatility | | 57.0% - 118.6% (66.5%) |
| Warrants | 259,979 | | | Income Approach | | Time to Exit (Years) | | 3.1 - 6.6 (4.6) |
| | | | | | | | | | | | | | | | | | | | | | | |
| Value as of December 31, 2021 | | Valuation Approach(es) | | Unobservable Input(s) | | Range(s) (Weighted Average(a)) |
| LLC Interests | $ | 225,000 | | | Market Approach | | Bid/Ask | | $150,000-$300,000 ($225,000) |
| | | | | Probability of Achieving Independent Milestones | | 3.4% - 90.0% (46.7%) |
| | | | | Probability of Achieving Dependent Milestones | | 0.0% - 17.0% (2.3%) |
| Rights to Milestone Payments | 8,012,759 | | | Income Approach | | Time to Cash Flows (Years) | | 0.5 - 21.0 (13.6) |
| Total | $ | 42,022,117 | | | | | | | |
(a) Weighted average based on fair value at December 31, 2021.
Valuation Methodologies and Inputs for Level 3 Assets
The following sections describe the valuation techniques and significant unobservable inputs used to measure Level 3 assets.
Preferred Stock, Preferred Units, LLC Interests, Bridge Notes, Common Stock and Common Units
Preferred stock, preferred units, LLC interests, bridge notes, common stock and common units are valued by either a market, income or hybrid approach using internal models with inputs, most of which are not market observable. Common inputs for valuing Level 3 investments include prices from recently executed private transactions in a company’s securities or unconditional firm offers, revenue multiples of comparable publicly traded companies, merger and acquisition ("M&A") transactions consummated by comparable companies, discounts for lack of marketability, rights and preferences of the class of securities we own as compared with other classes of securities the portfolio company has issued, particularly related to potential liquidity scenarios of an initial public offering ("IPO") or an acquisition transaction, estimated time to exit, volatilities of comparable publicly traded companies and management’s best estimate of risk attributable to non-performance risk. Certain securities are valued using the present value of future cash flows.
We may also consider changes in market values for sets of comparable companies when recent private transaction information is not available and/or in consideration of non-performance risk. We define non-performance risk as the risk that the price per share (or implied valuation of a portfolio company) or the effective yield of a debt security of a portfolio company, as applicable, does not appropriately represent the risk that a portfolio company with negative cash flow will be: (a) unable to raise capital, will need to be shut down and will not return our invested capital; or (b) able to raise capital, but at a valuation significantly lower than the implied post-money valuation of the last round of financing. We assess non-performance risk for each private portfolio company quarterly. Our assessment of non-performance risk typically includes an evaluation of the financial condition and operating results of the company, the company's progress towards milestones, and the long-term potential of the business and technology of the company and how this potential may or may not affect the value of the shares owned by us. An increase to the non-performance risk or a decrease in the private offering price of a future round of financing from that of the most recent round would result in a lower fair value measurement and/or a change in the distribution of value among the classes of securities we own.
Option pricing models place a high weighting on liquidation preferences, which means that small differences in how the preferences are structured can have a material effect on the fair value of our securities at the time of valuation and also on future valuations should additional rounds of financing occur with senior preferences. As such, valuations calculated by option pricing models may not increase if 1) rounds of financing occur at higher prices per share, 2) liquidation preferences include multiples on investment, 3) the amount of invested capital is small and/or 4) liquidation preferences are senior to prior rounds of financing. Additionally, an increase in the volatility assumption generally increases the enterprise value calculated in an option pricing model. An increase in the time to exit assumption also generally increases the enterprise value calculated in an option pricing model. Variations in the expected time to exit or expected volatility assumptions have a significant impact on fair value.
Bridge notes commonly contain terms that provide for the conversion of the full amount of principal, and sometimes interest, into shares of preferred stock at a defined price per share and/or the price per share of the next round of financing. The use of a discount for non-performance risk in the valuation of bridge notes would indicate the potential for conversion of only a portion of the principal, plus interest when applicable, into shares of preferred stock or the potential that a conversion event will not occur and that the likely outcome of a liquidation of assets would result in payment of less than the remaining principal outstanding of the note. An increase in non-performance risk would result in a lower fair value measurement.
Warrants
We use the Black-Scholes-Merton option-pricing model to determine the fair value of warrants held in our portfolio unless there is a publicly traded active market for such warrants or another indication of value such as a sale of the portfolio company. Option pricing models, including the Black-Scholes-Merton model, require the use of subjective input assumptions, including expected volatility, expected life, expected dividend rate, and expected risk-free rate of return. In the Black-Scholes-Merton model, variations in the expected volatility or expected term assumptions have a significant impact on fair value. Because certain securities underlying the warrants in our portfolio are not publicly traded, many of the required input assumptions are more difficult to estimate than they would be if a public market for the underlying securities existed.
An input to the Black-Scholes-Merton option-pricing model is the value per share of the type of stock for which the warrant is exercisable as of the date of valuation. This input is derived according to the methodologies discussed in "Preferred Stock, Preferred Units, LLC Interests, Bridge Notes, Common Stock and Common Units."
Rights to Payments
Rights to payments are valued using a probability-weighted discounted cash flow model. As part of Amgen Inc.’s acquisition of our former portfolio company, BioVex Group, Inc., we are entitled to potential future milestone payments based upon the achievement of certain regulatory and sales milestones. We are also entitled to future payments from the acquisition of Petra Pharma Corporation by an undisclosed acquirer unrelated to the Company. We assign probabilities to the achievements of the various milestones. Milestones identified as independent milestones can be achieved irrespective of the achievement of other contractual milestones. Dependent milestones are those that can only be achieved after another, or series of other, milestones are achieved. The interest rates used in these models are observable inputs from sources such as the published interest rates for corporate bonds of the acquiring or comparable companies.
Changes in Valuation Approaches
During the year ended December 31, 2021, the following changes in valuation methodology occurred since December 31, 2020:
•We changed the valuation methodology of our securities of AgBiome, LLC, from the income approach to the hybrid approach to reflect financing and business related inputs.
•We changed the valuation methodology of our securities of D-Wave Systems, Inc. and Nanosys, Inc., from the income approach to the market approach to reflect financing and business related inputs.
•We changed the valuation methodology of our securities of Seaport Diagnostics, Inc., from the hybrid approach to the income approach to reflect business related inputs.
The following chart shows the components of change in the financial assets categorized as Level 3 for the year ended December 31, 2021.
| | | | | | | | | | | | | | | | | | | | | | | | | | | | | | | | | | | | | | | | | | | | | | | |
| | Beginning
Balance
1/1/2021 | | Total
Realized
Gains (Loss)
Included in
Changes in
Net Assets | | Transfers | | Total
Unrealized
(Depreciation) Appreciation
Included in
Changes in
Net Assets | | Investments in
Portfolio
Companies and
Interest on
Bridge Notes | | Disposals
and
Settlements | | Ending
Balance
12/31/2021 | | Amount of Total
(Depreciation) Appreciation for the
year Included in
Changes in Net
Assets Attributable
to the Change in
Unrealized Gains or
Losses Relating to
Assets Still Held at
the Reporting Date |
| | | | | | | | | | | | | | | |
| Preferred Stock/Units | $ | 30,466,688 | | | $ | (8,735,645) | | 1 | $ | (2,307,912) | | 2 | $ | 6,901,533 | | | $ | 0 | | | $ | 0 | | | $ | 26,324,664 | | | $ | (1,376,794) | |
| | | | | | | | | | | | | | | |
| Bridge/Promissory Notes | 1,107,898 | | | (1,116,656) | | 1 | 0 | | | 1,025,820 | | | 411,794 | | | (1,328,856) | | | 100,000 | | | (11,196) | |
| | | | | | | | | | | | | | | |
| Common Stock/Membership Units | 8,029,814 | | | 579,955 | | 1 | (6,592,764) | | 3 | 2,927,152 | | | 2,735,513 | | 5 | (579,955) | | | 7,099,715 | | | 3,596,162 | |
| | | | | | | | | | | | | | | |
| Warrants | 3 | | | (69,168) | | 1 | 0 | | | (8,559) | | | 337,703 | | 5 | 0 | | | 259,979 | | | (77,727) | |
| | | | | | | | | | | | | | | |
| LLC Interests | 137,500 | | | 0 | | | 0 | | | 87,500 | | | 0 | | | 0 | | | 225,000 | | | 87,500 | |
| | | | | | | | | | | | | | | |
| Rights to Milestone Payments | 7,720,674 | | | 0 | | | 0 | | | (168,667) | | | 460,752 | | 5 | 0 | | | 8,012,759 | | | (168,667) | |
| | | | | | | | | | | | | | | |
| Stock Options | 44,127 | | | 0 | | | (44,127) | | 4 | 0 | | | 0 | | | 0 | | | 0 | | | 0 | |
| | | | | | | | | | | | | | | |
| Funds Held in Escrow from Sales of Investments | 161,779 | | | 163,043 | | 1 | 0 | | | (1,139) | | | 0 | | | (323,683) | | | 0 | | | 0 | |
| | | | | | | | | | | | | | | |
| Total | $ | 47,668,483 | | | $ | (9,178,471) | | | $ | (8,944,803) | | | $ | 10,763,640 | | | $ | 3,945,762 | | | $ | (2,232,494) | | | $ | 42,022,117 | | | $ | 2,049,278 | |
1 Represents gross realized gains or gross realized losses.
2 The transfers out of "Preferred Stock" of The Maven, Inc. was owing to Series H Preferred Stock being converted to Common Stock.
3 The transfers out of "Common Stock" of TheMaven, Inc. was owing to Common Stock no longer being fair valued by the Company's Board.
4 "Stock Options" of Synacor, Inc. were exercised for "Common Stock". Those shares of Common Stock were included in a tender offer dated April 1, 2021.
5 The Company received shares of Common Stock of Ravenna Pharmaceuticals, Inc. as consideration from the liquidation of Accelerator IV-New York Corporation. The Company received Warrants to purchase shares of Common Stock of Magnolia Neuroscience Corporation as consideration from the liquidation of Accelerator IV-New York Corporation. The Company received Right to Milestone from Acquisition of Petra Pharma Corporation as consideration from the liquidation of Accelerator IV-New York Corporation.
We elected to use beginning of the year values to recognize transfers in and out of Level 3 investments, when transfers occur.
NOTE 5. INDUSTRY DIVERSIFICATION
The following table shows the percentage of our net assets invested by industry as of December 31, 2021. | | | | | | | | | | | | | | | | | | | | | | | |
| Industry | Value as of December 31, 2021 | | % of Net Assets | | Value as of December 31, 2021 | | % of Net Assets |
| Advertising | | | | | $ | 5,217,601 | | | 4.7% |
| Unaffiliated Portfolio Companies | $ | 5,217,601 | | | 4.7% | | | | |
| Non-Controlled Affiliated Portfolio Companies | 0 | | | 0.0% | | | | |
| Controlled Affiliated Portfolio Companies | 0 | | | 0.0% | | | | |
| Application Software | | | | | 9,961,490 | | | 9.0% |
| Unaffiliated Portfolio Companies | 0 | | | 0.0% | | | | |
| Non-Controlled Affiliated Portfolio Companies | 9,961,490 | | | 9.0% | | | | |
| Controlled Affiliated Portfolio Companies | 0 | | | 0.0% | | | | |
| Asset Management & Custody Banks | | | | | 225,000 | | | 0.2% |
| Unaffiliated Portfolio Companies | 225,000 | | | 0.2% | | | | |
| Non-Controlled Affiliated Portfolio Companies | 0 | | 0.0% | | | | |
| Controlled Affiliated Portfolio Companies | 0 | | 0.0% | | | | |
| Biotechnology | | | | | 400,420 | | | 0.4% |
| Unaffiliated Portfolio Companies | 400,420 | | | 0.4% | | | | |
| Non-Controlled Affiliated Portfolio Companies | 0 | | | 0.0% | | | | |
| Controlled Affiliated Portfolio Companies | 0 | | | 0.0% | | | | |
| Building Products | | | | | 1,816,111 | | | 1.6% |
| Unaffiliated Portfolio Companies | 0 | | | 0.0% | | | | |
| Non-Controlled Affiliated Portfolio Companies | 1,816,111 | | | 1.6% | | | | |
| Controlled Affiliated Portfolio Companies | 0 | | | 0.0% | | | | |
| Communications Equipment | | | | | 2,592,521 | | | 2.3% |
| Unaffiliated Portfolio Companies | 2,592,521 | | | 2.3% | | | | |
| Non-Controlled Affiliated Portfolio Companies | 0 | | 0.0% | | | | |
| Controlled Affiliated Portfolio Companies | 0 | | 0.0% | | | | |
| Electronic Manufacturing Services | | | | | 1,707,840 | | | 1.5% |
| Unaffiliated Portfolio Companies | 1,707,840 | | | 1.5% | | | | |
| Non-Controlled Affiliated Portfolio Companies | 0 | | | 0.0% | | | | |
| Controlled Affiliated Portfolio Companies | 0 | | | 0.0% | | | | |
| Fertilizers & Agricultural Chemicals | | | | | 12,407,816 | | | 11.2% |
| Unaffiliated Portfolio Companies | 12,407,816 | | | 11.2% | | | | |
| Non-Controlled Affiliated Portfolio Companies | 0 | | | 0.0% | | | | |
| Controlled Affiliated Portfolio Companies | 0 | | | 0.0% | | | | |
| Health Care Equipment | | | | | 944,571 | | | 0.9% |
| Unaffiliated Portfolio Companies | 0 | | | 0.0% | | | | |
| Non-Controlled Affiliated Portfolio Companies | 944,571 | | | 0.9% | | | | |
| Controlled Affiliated Portfolio Companies | 0 | | | 0.0% | | | | |
| Health Care Services | | | | | 774,194 | | | 0.7% |
| Unaffiliated Portfolio Companies | 774,194 | | | 0.7% | | | | |
| Non-Controlled Affiliated Portfolio Companies | 0 | | | 0.0% | | | | |
| Controlled Affiliated Portfolio Companies | 0 | | | 0.0% | | | | |
| Health Care Technology | | | | | 1,260,231 | | | 1.1% |
| Unaffiliated Portfolio Companies | 0 | | | 0.0% | | | | |
| Non-Controlled Affiliated Portfolio Companies | 1,260,231 | | | 1.1% | | | | |
| Controlled Affiliated Portfolio Companies | 0 | | | 0.0% | | | | |
| | | | | | | | | | | | | | | | | | | | | | | |
| Industry | Value as of December 31, 2021 | | % of Net Assets | | Value as of December 31, 2021 | | % of Net Assets |
| Interactive Media & Services | | | | | $ | 9,993,959 | | | 9.0% |
| Unaffiliated Portfolio Companies | 0 | | | 0.0% | | | | |
| Non-Controlled Affiliated Portfolio Companies | $ | 9,993,959 | | | 9.0% | | | | |
| Controlled Affiliated Portfolio Companies | 0 | | | 0.0% | | | | |
| IT Consulting & Other Services | | | | | 2,086,766 | | | 1.9% |
| Unaffiliated Portfolio Companies | 2,086,766 | | | 1.9% | | | | |
| Non-Controlled Affiliated Portfolio Companies | 0 | | | 0.0% | | | | |
| Controlled Affiliated Portfolio Companies | 0 | | | 0.0% | | | | |
| Life Sciences Tools & Services | | | | | 3,070,491 | | | 2.8% |
| Unaffiliated Portfolio Companies | 0 | | | 0.0% | | | | |
| Non-Controlled Affiliated Portfolio Companies | 3,070,491 | | | 2.8% | | | | |
| Controlled Affiliated Portfolio Companies | 0 | | | 0.0% | | | | |
| Pharmaceuticals | | | | | 8,230,893 | | | 7.4% |
| Unaffiliated Portfolio Companies | 8,230,893 | | | 7.4% | | | | |
| Non-Controlled Affiliated Portfolio Companies | 0 | | | 0.0% | | | | |
| Controlled Affiliated Portfolio Companies | 0 | | | 0.0% | | | | |
| Research & Consulting Services | | | | | 679,011 | | | 0.6% |
| Unaffiliated Portfolio Companies | 679,011 | | | 0.6% | | | | |
| Non-Controlled Affiliated Portfolio Companies | 0 | | | 0.0% | | | | |
| Controlled Affiliated Portfolio Companies | 0 | | | 0.0% | | | | |
| Restaurants | | | | | 8,659,923 | | | 7.8% |
| Unaffiliated Portfolio Companies | 0 | | | 0.0% | | | | |
| Non-Controlled Affiliated Portfolio Companies | 8,659,923 | | | 7.8% | | | | |
| Controlled Affiliated Portfolio Companies | 0 | | | 0.0% | | | | |
| Specialty Chemicals | | | | | 2,034,221 | | 1.8% |
| Unaffiliated Portfolio Companies | 2,034,221 | | | 1.8% | | | | |
| Non-Controlled Affiliated Portfolio Companies | 0 | | | 0.0% | | | | |
| Controlled Affiliated Portfolio Companies | 0 | | | 0.0% | | | | |
| Specialized Finance | | | | | 6,832,700 | | | 6.2% |
| Unaffiliated Portfolio Companies | 0 | | | 0.0% | | | | |
| Non-Controlled Affiliated Portfolio Companies | 0 | | | 0.0% | | | | |
| Controlled Affiliated Portfolio Companies | 6,832,700 | | | 6.2% | | | | |
| Steel | | | | | 6,133,418 | | | 5.5% |
| Unaffiliated Portfolio Companies | 0 | | | 0.0% | | | | |
| Non-Controlled Affiliated Portfolio Companies | 6,133,418 | | | 5.5% | | | | |
| Controlled Affiliated Portfolio Companies | 0 | | | 0.0% | | | | |
| Technology Hardware, Storage & Peripherals | | | | | 14,188,383 | | | 12.8% |
| Unaffiliated Portfolio Companies | 14,188,383 | | | 12.8% | | | | |
| Non-Controlled Affiliated Portfolio Companies | 0 | | | 0.0% | | | | |
| Controlled Affiliated Portfolio Companies | 0 | | | 0.0% | | | | |
| Trading Companies & Distributors | | | | | 6,343,819 | | | 5.7% |
| Unaffiliated Portfolio Companies | 6,343,819 | | | 5.7% | | | | |
| Non-Controlled Affiliated Portfolio Companies | 0 | | | 0.0% | | | | |
| Controlled Affiliated Portfolio Companies | 0 | | | 0.0% | | | | |
| | | | | | | |
| | | | | | | | | | | | | | | | | | | | | | | |
| Industry | Value as of December 31, 2021 | | % of Net Assets | | Value as of December 31, 2021 | | % of Net Assets |
| Miscellaneous Common Stocks Industries | | | | | $ | 1,899,230 | | | 1.7% |
| Unaffiliated Portfolio Companies | $ | 1,899,230 | | | 1.7 | % | | | | |
| Non-Controlled Affiliated Portfolio Companies | 0 | | 0.0 | % | | | | |
| Controlled Affiliated Portfolio Companies | 0 | | 0.0 | % | | | | |
| Total | $ | 107,460,609 | | | | | $ | 107,460,609 | | | |
NOTE 6. DERIVATIVES
The following table presents the effect of derivatives held during the year ended December 31, 2021, along with the respective location in the consolidated financial statements.
CONSOLIDATED STATEMENT OF ASSETS AND LIABILITIES:
| | | | | | | | | | | | | | | | | | | | | | | | | | | | | |
| | Assets | | Liabilities | |
| Derivatives | | Location | | Fair Value | | Location | | Fair Value | |
| Warrants for the purchase of Common Stock of Magnolia Neurosciences Corporation expiring 8/3/28 | | Investments | | $ | 54,666 | | | -- | | -- | |
| | | | | | | | | |
| Warrants for the purchase of Series A-3 Preferred Stock of NanoTerra, Inc. expiring 11/15/22 | | Investments | | 0 | | | -- | | -- | |
| | | | | | | | | |
| Warrants for the purchase of Common Stock of OpGen, Inc. expiring 2/17/25 | | Investments | | 0 | | | -- | | -- | |
| | | | | | | | | |
| Warrants for the purchase of Common Stock of Potbelly Corporation expiring 2/12/26 | | Investments | | 205,313 | | | -- | | -- | |
CONSOLIDATED STATEMENT OF OPERATIONS:
| | | | | | | | | | | | | | | | | | | | | | | |
| Derivatives | | Location | | Net Realized Gain (Loss) | | Net Change in Unrealized Appreciation (Depreciation) | |
Warrants for the purchase of Common Stock of Alta Equipment Group, Inc. expiring 4/8/241 | | Net Realized Gain (Loss) and Unrealized Appreciation (Depreciation) on Investments | | $ | 0 | | | $ | (299,250) | | |
| | | | | | | |
| Warrants for the purchase of Common Stock of Magnolia Neurosciences Corporation expiring 8/3/28 | | Net Realized Gain (Loss) and Unrealized Appreciation (Depreciation) on Investments | | 0 | | | (58,188) | | |
| | | | | | | |
| Warrants for the purchase of Common Stock of NanoTerra, Inc. expired 2/22/21 | | Net Realized Gain (Loss) and Unrealized Appreciation (Depreciation) on Investments | | (69,168) | | | 69,168 | | |
| | | | | | | |
| Warrants for the purchase of Series A-3 Preferred Stock of NanoTerra, Inc. expiring 11/15/22 | | Net Realized Gain (Loss) and Unrealized Appreciation (Depreciation) on Investments | | 0 | | | 0 | | |
| | | | | | | |
| Warrants for the purchase of Common Stock of OpGen, Inc. expiring 2/17/25 | | Net Realized Gain (Loss) and Unrealized Appreciation (Depreciation) on Investments | | 0 | | | (3) | | |
| | | | | | | |
| Warrants for the purchase of Common Stock of Potbelly Corporation expiring 2/12/26 | | Net Realized Gain (Loss) and Unrealized Appreciation (Depreciation) on Investments | | 0 | | | (19,536) | | |
| | | | | | | |
| Stock Options for the purchase of Common Stock of Synacor, Inc. expiring 2/28/29 and 5/16/29 | | Net Realized Gain (Loss) and Unrealized Appreciation (Depreciation) on Investments | | 31,400 | | | (44,127) | | |
| | | | | | | |
| Restricted Stock Units of Synacor, Inc. | | Net Realized Gain (Loss) and Unrealized Appreciation (Depreciation) on Investments | | 86,486 | | | (69,683) | | |
1 The warrants for Alta Equipment Group, Inc., were exchanged for shares of Common Stock in April 2021.
NOTE 7. OFFICERS' AND BOARD OF DIRECTORS' COMPENSATION
The aggregate compensation (salaries, 401(k) employer match, medical and dental benefits) paid by the Company during the year ended December 31, 2021, to its officers amounted to approximately $3.7 million, including approximately $2.3 million in bonuses paid in 2021. In addition, and similar to prior years, the Compensation Committee awarded a deferred bonus as of December 31, 2021, to certain of the Company's officers of $944,048 payable only upon achievement of certain metrics defined by the Compensation Committee over the next two years. As of December 31, 2021, the portion of the deferred bonus in the amount of $391,780 was included in "Bonus payable", which represented the time-elapsed portion of the deferred bonus accrued on a straight-line basis through December 31, 2021 based on each metric measurement date.
In addition, and similar to prior years, the Compensation Committee awarded a deferred bonus as of December 31, 2020, to certain of the Company's officers of $212,190 payable only upon achievement of certain metrics defined by the Compensation Committee over the next two years. As of December 31, 2021, the portion of the deferred bonus in the amount of $177,179 was included in "Bonus payable", which represented the time-elapsed portion of the deferred bonus accrued on a straight-line basis through December 31, 2021, based on each metric measurement date. The Compensation Committee also has determined that the metrics for payment of $106,095 of the deferred compensation from 2020 were met as of December 31, 2021, the first deferred deferred compensation amount, and is payable to certain of the Company's officers.
The Compensation Committee also has determined that the metrics for payment of $381,963, the second deferred compensation amount of the deferred compensation from 2019, were met as of December 31, 2021, and is payable to certain of the Company's officers.
The aggregate compensation paid by the Company to the independent members of its Board of Directors during the year ended December 31, 2021 was $285,000.
Certain officers and directors currently and may in the future serve as members of the board of directors of our portfolio companies, including our controlled portfolio companies. These officers and directors do not receive any compensation for serving in such roles directly from the portfolio companies. Any such cash compensation paid by portfolio companies to members of their respective boards of directors is paid directly to the Company. In the case of securities-based compensation (restricted stock or stock options), the officer or director due such compensation assigns all beneficial interest, including but not limited to economic benefit and voting control, to such securities over to the Company.
NOTE 8. EMPLOYEE BENEFITS
401(k) Plan
We adopted a 401(k) Plan covering substantially all of our employees. Matching contributions to the plan are at the discretion of the Compensation Committee. For the year ended December 31, 2021, the Compensation Committee approved a 100 percent match, which amounted to $106,600.
Medical Benefit Retirement Plan
We historically administered a plan to provide medical and dental insurance for retirees and their spouses who, at the time of their retirement, attained certain years of service with us and a certain age (the "Medical Benefit Retirement Plan"). On April 27, 2017, the Board of Directors terminated the plan. The termination does not affect benefits accrued by former employees who are grandfathered under the former terms of the plan, and the termination of the plan does not affect benefits accrued by certain former employees who were grandfathered under the amended terms of the plan. The Medical Benefit Retirement Plan was terminated for all other employees.
The plan is unfunded and has no assets. The following disclosures about changes in the benefit obligation under the plan to provide medical and dental insurance for retirees are as of the measurement date of December 31, 2021:
| | | | | | | | | | |
| | 2021 | | |
| Accumulated post-retirement benefit obligation - December 31, 2020 | | $ | 659,097 | | | |
| Interest cost | | 12,816 | | | |
| Actuarial gain | | (2,288) | | | |
| Benefits paid | | (35,910) | | | |
| Accumulated post-retirement benefit obligation - December 31, 2021 | | $ | 633,715 | | | |
| | | | |
In accounting for the plan, the assumption made for the discount rate was 2.46 percent for the year ended December 31, 2021. The discount rate was calculated using the December 31, 2021 FTSE Pension Liability Index. The assumed health care cost trend rates is assumed to be 6 percent in 2022 grading down to 5.50 percent uniformly over 2 years and then following the Getzen model thereafter for medical and 5 percent per year for dental.
The following is the net periodic post-retirement benefit cost for the year ended December 31, 2021:
| | | | | | | | | | |
| | 2021 | | |
| Interest cost on accumulated post-retirement benefit obligation | | $ | 12,816 | | | |
| Amortization of net gain | | (9,460) | | | |
| Net periodic post-retirement benefit cost | | $ | 3,356 | | | |
| | | | |
The Company estimates the following benefits to be paid in each of the following years:
| | | | | | | | | | |
| 2022 | | $ | 40,052 | | | |
| 2023 | | 61,836 | | | |
| 2024 | | 63,490 | | | |
| 2025 | | 56,628 | | | |
| 2026 | | 57,039 | | | |
| 2027 through 2031 | | 163,571 | | | |
For the year ended December 31, 2021, net unrecognized actuarial loss of $7,172 resulted primarily from the increase in the discount rate, which represents $2,288 of actuarial gain arising during the year, and from a reclassification adjustment of $9,460 that decreased the net periodic benefit cost for the year.
Executive Mandatory Retirement Benefit Plan
On May 5, 2011, the Board of Directors terminated the Amended and Restated Executive Mandatory Retirement Benefit Plan. Our former President accrued benefits under this plan prior to his retirement, and the termination of this plan has no impact on his accrued benefits. At December 31, 2021 we had $166,193 accrued for benefits for this former employee under the plan, which is included in "Post-retirement plan liabilities" on the Company's Consolidated Statement of Assets and Liabilities.
NOTE 9. INCOME TAXES
The Company filed for the 1999 tax year to elect treatment as a RIC under Subchapter M of the Code and qualified for the same treatment for the years 2000 through 2015, as well as 2017 and 2019. The Company did not qualify as a RIC under Subchapter M of the Code in 2016, 2018, 2020, and 2021. The Company did not have net taxable income in 2016, 2018, 2020 and 2021, so the failure to qualify as a RIC did not result in a tax liability for the Company. As a C Corporation, the Company is permitted to use historical operating loss carryforwards to offset income and gains for tax purposes. As of December 31, 2021, the Company had approximately $79.0 million in operating loss carryforwards that begin to expire in 2026.
Under certain circumstances, even if we qualified for Subchapter M treatment for a given year, we might act in a subsequent year to ensure that we would be taxed in that subsequent year as a C Corporation, rather than as a RIC. We will fail to qualify for RIC tax treatment for a taxable year if we do not satisfy the 90 percent Income Test, the Diversification Tests or Annual Distribution Requirement for such year. In the event we do not satisfy the 90 percent Income Test, Diversification Tests or the Annual Distribution Requirement for any taxable year, we will be subject to federal tax with respect to all our taxable income, whether or not distributed. In addition to the corporate tax that would be paid by the Company, all our distributions to shareholders in that situation generally will be taxable as ordinary dividends and generally subject to up to a 30 percent withholding tax if received by a non-U.S. shareholder, although such dividends may qualify for long-term capital gain treatment as "qualified dividends" for U.S. shareholders meeting certain holding period requirements. If the aggregate values of our non-qualifying assets remain below 50 percent of total assets and no non-qualifying asset represents more than 25 percent of the total assets, we will continue to pass the Diversification Tests. Rather than selling portfolio companies that are performing well in order to pass our RIC diversification tests, we may opt instead not to qualify as a RIC. We will choose to take such action only if we believe that the result of the action will benefit the Company and our shareholders.
Historically, we invested in D-Wave Systems, Inc. through Parallel Universes, Inc., a Delaware company ("Parallel Universes"), which held shares of D-Wave Systems, Inc. through a Canadian limited company, 4169841 Canada Ltd. ("Canco"). On April 14, 2020, D-Wave Systems, Inc. reorganized as a subsidiary of a new company, DWSI Holdings, Inc. ("DWSI"). This structure could have resulted in taxation at the Parallel Universes and/or CanCo levels on realized gains on the shares of D-Wave Systems that would not be offset by any current or carryforward losses of the Company. In October 2020, CanCo distributed our shares of DWSI to Parallel Universes in a return of capital. Parallel Universes then distributed the shares to 180PH in exchange for 180PH's ownership of Parallel Universes. As of that date, 180PH directly owned shares of DWSI and no longer had direct or indirect ownership of Parallel Universes or CanCo. As such, future realized gains, if any, on the Company's shares of D-Wave Systems may be able to be offset by current or carryforward losses of the Company should such losses exist at the time of realization. In January 2021, D-Wave Systems completed an amalgamation of the reorganized business and changed its corporate name back to D-Wave Systems, Inc.
The Company's status as a RIC is irrevocable, but qualification is measured annually. Given the Company's status as a RIC and that the ability or inability to use such operating loss carryforwards depends on qualification metrics measured in each taxable year separate from prior years, the Company does not include a deferred tax asset and valuation allowance on its Consolidated Statement of Assets and Liabilities.
For federal tax purposes, the Company’s 2017 through 2019 tax years remain open for examination by the tax authorities under the normal three-year statute of limitations. Generally, for New Jersey state tax purposes, the Company’s 2016 through 2019 tax years remain open for examination by the tax authorities under a four-year statute of limitations. The Company filed its 2020 federal and state taxes in 2021, and will file its 2021 federal and state taxes in 2022.
For the year ended December 31, 2021, the Company recorded a consolidated expense of $1,272 in federal, state and local income taxes.
We paid federal, state and local taxes on behalf of Ventures, which was taxed as a C Corporation.
The Company updated certain components of capital accounts on a tax-basis in 2021, to reflect a return of capital statement of position ("ROCSOP") adjustment. This ROCSOP adjustment includes the reclassification of $2,942,206 of accumulated net operating loss and $310,823 of accumulated net realized loss into additional paid in capital. This reclassification results primarily from certain non-deductible expenses and net operating loss. There is no impact to net asset value per share as a result of this ROCSOP adjustment. This adjustment may change in future years if the Company does not qualify as a RIC in a given tax year.
For the year ended December 31, 2021, the Company recorded aggregate unrealized appreciation of $19,253,631, net unrealized depreciation of $15,538,861 and net unrealized appreciation is $34,792,492. The aggregate book cost of investments is $88,206,978. For the year ended December 31, 2021, the Company recorded aggregate tax unrealized appreciation of $19,938,040, net tax unrealized depreciation of $14,854,452 and net tax unrealized appreciation is $34,792,492. The aggregate tax cost of investments is $87,522,569. For the year ended December 31, 2021, the Company was in a loss position and therefore did not have any undistributed ordinary income and/or undistributed long-term capital gains.
As of December 31, 2021, we had post-enactment loss carryforwards under the provisions of the Regulated Investment Company Modernization Act of 2010 (the "Act") in aggregate of $18,235,217, long term. Capital gains for the year ended December 31, 2021, were $2,091,597 and can be offset again capital losses from prior periods. As of December 31, 2021, we had cumulative capital losses, which were offset against losses during years when the Company failed as a RIC, totaling $14,836,653, which may be carried back 3 years or carried forward 5 years. As of December 31, 2021, we had cumulative capital losses, which were derived during years when the Company qualified as a RIC, totaling $3,398,564. Post-enactment losses have no expiration date in years where we qualify as a RIC.
On December 22, 2017, the Tax Cuts and Jobs Act of 2017 (the "2017 Act") was enacted, which among other changes, lowered the tax rates for corporations and how future loss carryforwards can be used against future gains. The change of the federal corporate tax rate from 35 percent to 21 percent in the 2017 Act may impact future decisions regarding the issuance of deemed dividends should the Company failed to qualify as a RIC under Subchapter M of the Code and be in a net taxable gain position on investments.
NOTE 10. COMMITMENTS AND CONTINGENCIES
As of December 31, 2021, the Company has committed to invest up to an additional $50,000 in LS180 Acquisition Holdings, LLC upon receiving a written draw-down notice from the entity.
Portfolio companies may seek additional capital in the future and any decision by the Company to not participate in the round of financing could result in outcomes that negatively impact the value of the Company's securities of those portfolio companies.
On March 23, 2017, we signed a month-to-month lease for approximately 1,250 square feet of office space located at 7 N. Willow Street, Suite 4B, Montclair, New Jersey ("Montclair Office"). On November 17, 2021, we signed a lease extension for our Montclair Office through December 31, 2024. Upon an event of default, the lease provides that the landlord may terminate the lease and require us to pay all rent that would have been payable during the remainder of the lease or until the date the landlord re-enters the premises.
NOTE 11. PORTFOLIO PURCHASES AND SALES
During the year ended December 31, 2021: | | | | | | | | | | | | | | |
| Company | | Purchases/Cost | | Sales Proceeds/Distributions |
| Alta Equipment Group, Inc. | | $ | 2,207 | | | $ | 4,218,995 | |
| Armstrong Flooring, Inc. | | 4,175,446 | | | 2,743,919 | |
| Babcock & Wilcox Enterprises, Inc. | | 1,989,000 | | | 2,987,380 | |
| comScore, Inc. | | 5,417,532 | | | 0 | |
| Enzo Biochem, Inc. | | 2,239,233 | | | 2,055,542 | |
| Everspin Technologies, Inc. | | 3,055,657 | | | 4,847,520 | |
| Lantronix, Inc. | | 1,425,429 | | | 4,231,505 | |
| LS180 Acqusition Holdings LLC | | 113,000 | | | 0 | |
| Manitex International, Inc. | | 0 | | | 397,090 | |
| Parabellum Acquisition Holdings LLC | | 2,717,646 | | | 0 | |
| PFSweb Inc. | | 3,780,312 | | | 4,426,731 | |
| Potbelly, Corp. | | 2,594,724 | | | 1,548,214 | |
| Quantum Corporation | | 2,389,656 | | | 3,136,441 | |
| RF Industries, Ltd. | | 1,509,057 | | | 0 | |
| Sonim Technologies, Inc. | | 1 | | | 3,237,140 | |
Synacor Inc.(1) | | 31,449 | | | 3,996,671 | |
| Synalloy Corp. | | 2,767,454 | | | 0 | |
| Synchronoss Technologies, Inc. | | 10,143,202 | | | 288,134 | |
| Verso Corporation | | 0 | | | 1,213,167 | |
Zymergen, Inc.(2) | | 360,615 | | | 73,159 | |
Miscellaneous Common Stocks(3) | | 4,800,385 | | | 2,991,008 | |
| Total Publicly Traded Equity and Equity-Related Securities Purchase/Cost and Sales Proceeds/Distributions | | $ | 49,512,005 | | | $ | 42,392,616 | |
| | | | |
Accelerator-IV New York Corporation(4) | | $ | 0 | | | $ | 579,955 | |
Magnolia Neurosciences Corporation(4) | | 112,854 | | | 0 | |
| Black Silicon Holdings, Inc. | | 0 | | | 969,306 | |
Lodo Therapeutic Corporation(2) | | 0 | | | 360,615 | |
Ravenna Pharmaceutical, Inc.(4) | | 4,867 | | | 0 | |
Rights to Milestone Payments from Acquisition of Petra Pharma Corporation(4) | | 460,752 | | | 0 | |
| Funds held in escrow from sales of investments | | 0 | | | 323,683 | |
| Total Legacy Privately Held Equity and Equity-Related Securities Cost and Distributions | | $ | 578,473 | | | $ | 2,233,559 | |
| Total Purchases/Cost and Sales Proceeds/Distributions | | $ | 50,090,478 | | | $ | 44,626,175 | |
Note: The table above does not include transactions in short-term call options whose maturities at the time of acquisition were one year or less during the year ended December 31, 2021.
(1) During the year ended December 31, 2021, the Company received restricted stock units from Synacor, Inc. ("SYNC") which were issued to the Company for Kevin Rendino's service on the Board of Directors of SYNC. These restricted stock units had a cost basis of $31,449 on the date the restricted stock units vested. Amounts related to restricted stock units are also presented as "Fee income for providing managerial assistance to portfolio companies-non-cash" on the Company's Consolidated Statement of Cash Flows.
(2) During the year ended December 31, 2021, the Company received distributions of Common Stock, valued at $360,615 on the date issued, for the acquisition of Lodo Therapeutics Corporation by Zymergen, Inc., an acquirer unrelated to the Company.
(3) Miscellaneous Common Stocks are unrestricted common stocks of publicly traded companies that the Company has not disclosed publicly.
(4) During the year ended December 31, 2021, the Company received distributions of common stock of Ravenna Pharmaceutical, Inc., warrants of Magnolia Neurosciences Corporation and rights to milestone payments from the acquisition of Petra Pharma Corporation, valued at $578,473 on the date received from the liquidation of Accelerator IV-New York Corporation in 2021.
NOTE 12. SHARE REPURCHASE PROGRAM
On August 9, 2021, our Board reauthorized the repurchase of up to $2.5 million of the Company's common stock within a six-month period from the date of notice to investors, which notice was mailed on or about August 13, 2021. As of December 31, 2021, no repurchases had occurred.
NOTE 13. RELATED PARTY TRANSACTIONS
We have historically provided managerial assistance to some of our portfolio companies, including serving as members of the board of directors. In certain cases, we receive fees for providing such assistance. During the year ended December 31, 2021, we received fees totaling $31,449 in non-cash, included in the Company's Consolidated Statement of Operations in "Board fees from portfolio companies."
NOTE 14. SUBSEQUENT EVENTS
The Company has evaluated subsequent events as of December 31, 2021, through the date these financial statements were issued, and include the following:
On January 24, 2022, the Company's balance of "Receivables from portfolio companies" from TheMaven, Inc. in partial liquidating damages was converted for shares of Common Stock at $0.63 per share. Partial liquidating damages was accrued through payment date.
On January 27, 2022, the Company funded the remaining $50,000 in a promissory note issued by LS180 Acquisition Holdings, LLC.
On February 22, 2022, our Board reauthorized the repurchase of up to $2.5 million of the Company's common stock within a six-month period from the date of notice to investors, which notice will be mailed on or about February 28, 2022.
NOTE 15. INVESTMENTS AND ADVANCES TO AFFILIATES - SCHEDULE 12-14
| | | | | | | | | | | | | | | | | | | | | | | | | | | | | | | | | | | | | | | | | | | | | | | | | | |
| Name of Issuer | | Title of Issue or Nature of Indebtedness (A) | | Amount of Dividends or Interest Credited to Income (B) | | Net Realized Gain (Loss) | | Value as of December 31, 2020 | | Gross Additions (C) | | Gross Reductions (D) | | Net Change in Unrealized Appreciation (Depreciation) | | Value as of December 31, 2021 |
| CONTROLLED AFFILIATED EQUITY & EQUITY-RELATED SECURITIES(E): | | | | | | | | | | | | | | | | |
| LS180 Acquisition Holdings, LLC | | Membership Units | | $ | 0 | | | $ | 0 | | | $ | 0 | | | $ | 13,000 | | | $ | 0 | | | $ | 0 | | | $ | 13,000 | |
| | Promissory Note | | 0 | | | 0 | | | 0 | | | 100,000 | | | 0 | | | 0 | | | 100,000 | |
| Parabellum Acquisition Holdings, LLC | | Membership Units | | $ | 0 | | | $ | 0 | | | $ | 0 | | | $ | 6,719,700 | | | $ | 0 | | | $ | 4,002,054 | | | $ | 6,719,700 | |
| Total Controlled Affiliated Equity & Equity-Related Securities | | | | $ | 0 | | | $ | 0 | | | $ | 0 | | | $ | 6,832,700 | | | $ | 0 | | | $ | 4,002,054 | | | $ | 6,832,700 | |
| NON-CONTROLLED AFFILIATED LEGACY PRIVATELY HELD EQUITY & EQUITY-RELATED SECURITIES(F): | | | | | | | | | | | | | | | | |
| ABSMaterials, Inc. | | Series A Convertible Preferred Stock | | $ | 0 | | | $ | (435,000) | | | $ | 28,691 | | | $ | 0 | | | $ | (28,691) | | | $ | 406,309 | | | $ | 0 | |
| | Series B Convertible Preferred Stock | | 0 | | | (1,217,644) | | | 343,821 | | | 0 | | | (343,821) | | | 873,823 | | | 0 | |
| | Secured Convertible Bridge Note (G) | | (47,161) | | | (125,000) | | | 172,161 | | | 0 | | | (172,161) | | | 0 | | | 0 | |
| Accelerator IV-New York Corporation | | Series A Common Stock | | $ | 0 | | | $ | 579,955 | | | $ | 669,010 | | | $ | 0 | | | $ | (669,010) | | | $ | (669,010) | | | $ | 0 | |
| Black Silicon Holdings, Inc. | | Series A Convertible Preferred Stock | | $ | 0 | | | $ | (750,000) | | | $ | 0 | | | $ | 0 | | | $ | 0 | | | $ | 750,000 | | | $ | 0 | |
| | Series A-1 Convertible Preferred Stock | | 0 | | | (890,000) | | | 0 | | | 0 | | | 0 | | | 890,000 | | | 0 | |
| | Series A-2 Convertible Preferred Stock | | 0 | | | (2,445,000) | | | 0 | | | 0 | | | 0 | | | 2,445,000 | | | 0 | |
| | Series B-1 Convertible Preferred Stock | | 0 | | | (1,169,561) | | | 0 | | | 0 | | | 0 | | | 1,169,561 | | | 0 | |
| | Series C Convertible Preferred Stock | | 0 | | | (1,171,316) | | | 0 | | | 0 | | | 0 | | | 1,171,316 | | | 0 | |
| | Secured Convertible Bridge Notes (H) | | 348,592 | | | (823,654) | | | 836,798 | | | 0 | | | (836,798) | | | 607,570 | | | 0 | |
| EchoPixel, Inc. | | Series Seed Convertible Preferred Stock | | $ | 0 | | | $ | 0 | | | $ | 885,465 | | | $ | 0 | | | $ | (365,368) | | | $ | (365,368) | | | $ | 520,097 | |
| | Series Seed-2 Convertible Preferred Stock | | 0 | | | 0 | | | 315,884 | | | 0 | | | (129,800) | | | (129,800) | | | 186,084 | |
| | Series A-2 Convertible Preferred Stock | | 0 | | | 0 | | | 376,990 | | | 0 | | | (138,600) | | | (138,600) | | | 238,390 | |
| | | | | | | | | | | | | | | | |
| | | | | | | | | | | | | | | | | | | | | | | | | | | | | | | | | | | | | | | | | | | | | | | | | | |
| Name of Issuer | | Title of Issue or Nature of Indebtedness (A) | | Amount of Dividends or Interest Credited to Income (B) | | Net Realized Gain (Loss) | | Value as of December 31, 2020 | | Gross Additions (C) | | Gross Reductions (D) | | Net Change in Unrealized Appreciation (Depreciation) | | Value as of December 31, 2021 |
| NON-CONTROLLED AFFILIATED LEGACY PRIVATELY HELD EQUITY & EQUITY-RELATED SECURITIES(F): | | | | | | | | | | | | | | | | |
| Essential Health Solutions, Inc. | | Common Stock | | $ | 0 | | | $ | 0 | | | $ | 0 | | | $ | 0 | | | $ | 0 | | | $ | 0 | | | $ | 0 | |
| | Series A Convertible Preferred Stock | | 0 | | | 0 | | | 327,907 | | | 0 | | | (327,907) | | | (327,907) | | | 0 | |
| | Convertible Bridge Note (G) | | 0 | | | 0 | | | 11,196 | | | 0 | | | (11,196) | | | (11,196) | | | 0 | |
| HALE.life Corporation | | Common Stock | | $ | 0 | | | $ | 0 | | | $ | 111,747 | | | $ | 0 | | | $ | (80,592) | | | $ | (80,592) | | | $ | 31,155 | |
| | Series Seed-1 Convertible Preferred Stock | | 0 | | | 0 | | | 1,632,048 | | | 0 | | | (1,070,995) | | | (1,070,995) | | | 561,053 | |
| | Series Seed-2 Convertible Preferred Stock | | 0 | | | 0 | | | 1,892,116 | | | 0 | | | (1,224,093) | | | (1,224,093) | | | 668,023 | |
| TARA Biosystems, Inc. | | Common Stock | | $ | 0 | | | $ | 0 | | | $ | 552,902 | | | $ | 0 | | | $ | (233,456) | | | $ | (233,456) | | | $ | 319,446 | |
| | Series A Convertible Preferred Stock | | 0 | | | 0 | | | 2,444,684 | | | 225,397 | | | 0 | | | 225,397 | | | 2,670,081 | |
| | Series A-2 Convertible Preferred Stock | | 0 | | | 0 | | | 77,881 | | | 3,083 | | | 0 | | | 3,083 | | | 80,964 | |
| Total Non-Controlled Affiliated Legacy Privately Held Equity & Equity-Related Securities | | | | $ | 301,431 | | | $ | (8,447,220) | | | $ | 10,679,301 | | | $ | 228,480 | | | $ | (5,632,488) | | | $ | 4,291,042 | | | $ | 5,275,293 | |
| NON-CONTROLLED AFFILIATED PUBLICLY TRADED EQUITY & EQUITY-RELATED SECURITIES(F): | | | | | | | | | | | | | | | | |
| Armstrong Flooring, Inc. | | Common Stock | | $ | 0 | | | $ | 837,512 | | | $ | 704,270 | | | $ | 1,111,841 | | | $ | 0 | | | $ | (1,157,198) | | | $ | 1,816,111 | |
| Potbelly Corporation | | Common Stock | | $ | 0 | | | $ | 605,785 | | | $ | 5,579,636 | | | $ | 2,874,974 | | | $ | 0 | | | $ | 1,447,528 | | | $ | 8,454,610 | |
| | Warrants for Common Stock | | 0 | | | 0 | | | 0 | | | 205,313 | | | 0 | | | (19,536) | | | 205,313 | |
| Synacor, Inc. | | Common Stock | | $ | 0 | | | $ | (672,175) | | | $ | 2,372,710 | | | $ | 0 | | | $ | (2,372,710) | | | $ | 2,146,801 | | | $ | 0 | |
| | Stock Options | | 0 | | | 31,400 | | | 44,127 | | | 0 | | | (44,127) | | | (44,127) | | | 0 | |
| | Restricted Stock Units | | 0 | | | 86,486 | | | 69,683 | | | 0 | | | (69,683) | | | (69,683) | | | 0 | |
| Synalloy Corp. | | Common Stock | | $ | 0 | | | $ | 0 | | | $ | 775,788 | | | $ | 5,357,630 | | | $ | 0 | | | $ | 2,590,176 | | | $ | 6,133,418 | |
| Synchronoss Technologies, Inc. | | Common Stock | | $ | 0 | | | $ | 123,079 | | | $ | 1,371,883 | | | $ | 8,589,607 | | | $ | 0 | | | $ | (1,388,540) | | | $ | 9,961,490 | |
| | | | | | | | | | | | | | | | |
| | | | | | | | | | | | | | | | | | | | | | | | | | | | | | | | | | | | | | | | | | | | | | | | | | |
| Name of Issuer | | Title of Issue or Nature of Indebtedness (A) | | Amount of Dividends or Interest Credited to Income (B) | | Net Realized Gain (Loss) | | Value as of December 31, 2020 | | Gross Additions (C) | | Gross Reductions (D) | | Net Change in Unrealized Appreciation (Depreciation) | | Value as of December 31, 2021 |
| TheMaven, Inc. | | Series H Convertible Preferred Stock | | $ | 0 | | | $ | 0 | | | $ | 2,307,912 | | | $ | 0 | | | $ | (2,307,912) | | | $ | 0 | | | $ | 0 | |
| | Common Stock | | 0 | | | 0 | | | 6,592,764 | | | 3,401,195 | | | 0 | | | 1,093,283 | | | 9,993,959 | |
| Total Non- Controlled Affiliated Publicly Traded Equity & Equity-Related Securities | | | | $ | 0 | | | $ | 1,012,087 | | | $ | 19,818,773 | | | $ | 21,540,560 | | | $ | (4,794,432) | | | $ | 4,598,704 | | | $ | 36,564,901 | |
| Total Controlled and Non- Controlled Affiliated Legacy Privately Held and Publicly Traded Equity & Equity-Related Securities | | | | $ | 301,431 | | | $ | (7,435,133) | | | $ | 30,498,074 | | | $ | 28,601,740 | | | $ | (10,426,920) | | | $ | 12,891,800 | | | $ | 48,672,894 | |
(A)Common stock, warrants, membership units and, in some cases, preferred stock are generally non-income producing and restricted. The principal amount of debt and the number of shares of common and preferred stock and number of membership units are shown in the accompanying Consolidated Schedule of Investments as of December 31, 2021.
(B)Represents the total amount of interest or dividends credited/(debited) to income for the portion of the period an investment was a control or affiliate investment, as appropriate. Amounts credited to preferred or common stock represent accrued bridge note interest related to conversions that occurred during the year ended December 31, 2021.
(C)Gross additions include increases in investments resulting from new portfolio investments, paid-in-kind interest or dividends, the amortization of discounts and fees. Gross additions also include net increases in unrealized appreciation or decreases in unrealized depreciation.
(D)Gross reductions include decreases in investments resulting from principal collections related to investment repayments or sales, the amortization of premiums and acquisition costs. Gross reductions also include net increases in unrealized depreciation or decreases in unrealized appreciation.
(E)"Controlled Affiliated" is defined as investments in which we own 25 percent or more of the outstanding voting rights of the portfolio company or otherwise control the company, including control of a majority of the seats on the board of directors, or more than 25 percent of the seats on the board of directors, with no other entity or person in control of more director seats than us.
(F)"Non-Controlled Affiliated" is defined as ownership of five percent or more, but less than 25 percent, of the voting shares of the portfolio company, or where we hold the right to appoint one or more members to the portfolio company’s board of directors, but less than 25 percent of the members of the board of directors.
(G)Debt security is on non-accural status as of January 1, 2021, and therefore, is considered non-income producing as of the year ended. All interest income recorded in prior periods was reversed.
(H)Debt security was initially on non-accrual status as of April 1, 2018 through March 31, 2021. As of April 1, 2021, the debt security was considered to be income producing and interest income was accrued during the period starting April 1, 2018 through the period of liquidation and payment of such accrued interest.
| | | | | | | | | | | | | | | | | | | | | | | | | | | | | |
| Line for Schedule of Investments | Method / Level | | Primary Industry | | # of Shares Purchased/Principal | | Cost of TURN's Investment | | Valuation |
| Controlled Affiliated Equity and Equity-Related Securities | | | | | | | | | |
| LS180 Acquisition Holdings, LLC | | | Specialized Finance | | | | | | |
| Membership Units (acquired 4/13/21) | (M) (L3) | | | | 1,300,000 | | $ | 13,000 | | | $ | 13,000 | |
| Unsecured Promissory Note, 0% (acquired 5/10/2021, maturing 12/31/22) | (M) (L3) | | | | $ | 50,000 | | | 50,000 | | | 50,000 | |
| Unsecured Promissory Note, 0% (acquired 9/7/21, maturing 12/31/22) | (M) (L3) | | | | $ | 50,000 | | | 50,000 | | | 50,000 | |
| | | | | | | $ | 113,000 | | | $ | 113,000 | |
| Parabellum Acquisition Holdings, LLC | | | Specialized Finance | | | | | | |
| Membership Units (acquired 4/22/21) | (M) (L3) | | | | 693,151 | | $ | 2,717,646 | | | $ | 6,719,700 | |
| Total Controlled Affiliated Equity and Equity-Related Securities (6.2%) | | | | | | | $ | 2,830,646 | | | $ | 6,832,700 | |
| | | | | | | | | |
| Non-Controlled Affiliated Publicly Traded Equity and Equity-Related Securities | | | | | | | | | |
| Armstrong Flooring, Inc. | | | Building Products | | | | | | |
| Common Stock (acquired 12/22/20-11/23/21) | (M) (L2) | | | | 723,550 | | $ | 2,973,630 | | | $ | 1,816,111 | |
| Potbelly Corporation | | | Restaurants | | | | | | |
| Common Stock (acquired 6/24/19-11/26/21) | (M) (L1) | | | | 1,515,163 | | | $ | 6,702,539 | | | $ | 8,454,610 | |
| Synalloy Corporation | | | Steel | | | | | | |
| Common Stock (acquired 12/7/20-12/16/21) | (M) (L1) | | | | 373,306 | | | $ | 3,425,139 | | | $ | 6,133,418 | |
| Synchronoss Technologies, Inc. | | | Application Software | | | | | | |
| Common Stock (acquired 7/17/20-12/20/21) | (M) (L1) | | | | 4,082,578 | | | $ | 10,847,924 | | | $ | 9,961,490 | |
| TheMaven, Inc. | | | Interactive Media & Services | | | | | | |
| Common Stock (acquired 12/18/20-11/24/21) | (M) (L2) | | | | 15,429,920 | | | $ | 8,000,000 | | | $ | 9,993,959 | |
| Total Non-Controlled Affiliated Publicly Traded Equity and Equity-Related Securities (32.9%) | | | | | | | $ | 31,949,232 | | | $ | 36,359,588 | |
| | | | | | | | | |
| | | | | | | | | | | | | | | | | | | | | | | | | | | | | |
| Line for Schedule of Investments | Method / Level | | Primary Industry | | # of Shares Purchased/Principal | | Cost of TURN's Investment | | Valuation |
| Legacy Privately Held Equity and Equity-Related Securities | | | | | | | | | |
| EchoPixel, Inc. | | | Health Care Equipment | | | | | | |
| Series Seed Convertible Preferred Stock (acquired 6/21/13-6/30/14) | (I) (L3) | | | | 4,194,630 | | | $ | 1,250,000 | | | $ | 520,097 | |
| Series Seed-2 Convertible Preferred Stock (acquired 1/22/16) | (I) (L3) | | | | 1,476,668 | | | 500,000 | | | 186,084 | |
| Series A-2 Convertible Preferred Stock (acquired 3/23/17) | (I) (L3) | | | | 1,471,577 | | | 350,000 | | | 238,390 | |
| | | | | | | 2,100,000 | | | 944,571 | |
| Essential Health Solutions, Inc. | | | Health Care Technology | | | | | | |
| Common Stock (acquired 11/18/16) | (I) (L3) | | | | 200,000 | | | $ | 20 | | | $ | 0 | |
| Series A Convertible Preferred Stock (acquired 11/18/16) | (I) (L3) | | | | 2,750,000 | | | 2,750,000 | | | 0 | |
| Unsecured Convertible Bridge Note, 8%, (acquired 12/19/18, maturing 12/19/21) | (I) (L3) | | | | $ | 50,000 | | | 50,000 | | | 0 | |
| | | | | | | $ | 2,800,020 | | | $ | 0 | |
| HALE.life Corporation | | | Health Care Technology | | | | | | |
| Common Stock (acquired 3/1/16) | (I) (L3) | | | | 1,000,000 | | | $ | 10 | | | $ | 31,155 | |
| Series Seed-1 Convertible Preferred Stock (acquired 3/28/17) | (I) (L3) | | | | 11,000,000 | | | 1,896,920 | | | 561,053 | |
| Series Seed-2 Convertible Preferred Stock (acquired 12/28/18) | (I) (L3) | | | | 12,083,132 | | 2,500,000 | | 668,023 |
| | | | | | | $ | 4,396,930 | | | $ | 1,260,231 | |
| TARA Biosystems, Inc. | | | Life Sciences Tools & Services | | | | | | |
| Common Stock (acquired 8/20/14) | (M) (L3) | | | | 2,000,000 | | | $ | 20 | | | $ | 319,446 | |
| Series A Convertible Preferred Stock (acquired 3/31/17) | (M) (L3) | | | | 6,878,572 | | | 2,545,493 | | | 2,670,081 | |
| Series A-2 Convertible Preferred Stock (acquired 4/18/19) | (M) (L3) | | | | 208,577 | | | 100,000 | | | 80,964 | |
| | | | | | | $ | 2,645,513 | | | $ | 3,070,491 | |
| Total Non-Controlled Affiliated Legacy Privately Held Equity and Equity-Related Securities (4.8%) | | | | | | | $ | 11,942,463 | | | $ | 5,275,293 | |
| Non-Controlled Affiliated Derivative Securities | | | | | | | | | |
| Potbelly Corporation | | | Restaurants | | | | | | |
| Warrants for the Purchase of Common Stock expiring 2/12/26 (acquired 2/10/21) | (I) (L3) | | | | 80,605 | | | $ | 224,849 | | | $ | 205,313 | |
| Total Non-Controlled Affiliated Derivative Securities (0.2%) | | | | | | | $ | 224,849 | | | $ | 205,313 | |
| Total Non-Controlled Affiliated Securities (37.9%) | | | | | | | $ | 44,116,544 | | | $ | 41,840,194 | |
| | | | | | | | | |
| Total Controlled Affiliated and Non-Controlled Affiliated Equity and Equity-Related Securities (44.1%) | | | | | | | $ | 46,947,190 | | | $ | 48,672,894 | |
Report of Independent Registered Public Accounting Firm
To the Board of Directors and Shareholders of 180 Degree Capital Corp.
Opinion on the Financial Statements
We have audited the accompanying consolidated statement of assets and liabilities, including the consolidated schedule of investments, of 180 Degree Capital Corp. and its subsidiaries (the “Company”) as of December 31, 2021, the related consolidated statements of operations and cash flows for the year ended December 31, 2021, the consolidated statements of changes in net assets for each of the two years in the period ended December 31, 2021, including the related notes, and the consolidated financial highlights for each of the five years in the period ended December 31, 2021 (collectively referred to as the “consolidated financial statements”). In our opinion, the consolidated financial statements present fairly, in all material respects, the financial position of the Company as of December 31, 2021, the results of its operations and its cash flows for the year then ended, the changes in its net assets for each of the two years in the period ended December 31, 2021 and the financial highlights for each of the five years in the period ended December 31, 2021 in conformity with accounting principles generally accepted in the United States of America.
Basis for Opinion
These consolidated financial statements are the responsibility of the Company’s management. Our responsibility is to express an opinion on the Company’s consolidated financial statements based on our audits. We are a public accounting firm registered with the Public Company Accounting Oversight Board (United States) (PCAOB) and are required to be independent with respect to the Company in accordance with the U.S. federal securities laws and the applicable rules and regulations of the Securities and Exchange Commission and the PCAOB.
We conducted our audits of these consolidated financial statements in accordance with the standards of the PCAOB. Those standards require that we plan and perform the audit to obtain reasonable assurance about whether the consolidated financial statements are free of material misstatement, whether due to error or fraud.
Our audits included performing procedures to assess the risks of material misstatement of the consolidated financial statements, whether due to error or fraud, and performing procedures that respond to those risks. Such procedures included examining, on a test basis, evidence regarding the amounts and disclosures in the consolidated financial statements. Our audits also included evaluating the accounting principles used and significant estimates made by management, as well as evaluating the overall presentation of the consolidated financial statements. Our procedures included confirmation of securities owned as of December 31, 2021 by correspondence with the custodian, transfer agent, portfolio companies and broker; when replies were not received from portfolio companies and broker, we performed other auditing procedures. We believe that our audits provide a reasonable basis for our opinion.
/s/PricewaterhouseCoopers LLP
New York, New York
February 24, 2022
We have served as the Company's auditor since 2002.
Privacy Policy
We are committed to protecting your privacy. This privacy notice explains the privacy policies of 180 Degree Capital Corp. and its affiliates. This notice supersedes any other privacy notice you may have received from 180 Degree Capital Corp.
Generally, we do not receive any non-public personal information relating to our shareholders, although certain non-public personal information of our shareholders may become available to us. We maintain physical, electronic, and procedural safeguards, according to strict standards of security and confidentiality, all information we receive about you. The only information we collect from you is your name, address, and number of shares you hold. This information is used only so that we can send you annual reports and other information about us, and send you proxy statements or other information required by law. When the Company shares non-public shareholder personal information referred to above, the information is made available for limited business purposes and under controlled circumstances designed to protect our shareholders' privacy. We do not permit use of shareholder information for any non-business or marketing purpose, nor do we permit third parties to rent, sell, trade or otherwise release or disclose information to any other party.
We do not share this information with any non-affiliated third party except as described below.
•180 Degree Capital Corp. and affiliate employees. It is our policy that only our authorized employees who need to know your personal information will have access to it. Our personnel who violate our privacy policy are subject to disciplinary action.
•Service Providers. We may disclose your personal information to companies that provide services on our behalf, such as record keeping and mailing you information. These companies are required to protect your information and use it solely for the purpose for which they received it.
•Courts and Government Officials. If required by law, we may disclose your personal information in accordance with a court order or at the request of government regulators. Only that information required by law, subpoena, or court order will be disclosed.
Proxy Voting
We vote proxies relating to our portfolio securities in the best interest of our shareholders. We review on a case-by-case basis each proposal submitted to a shareholder vote to determine its impact on the portfolio securities held by us. Although we generally vote against proposals that may have a negative impact on our portfolio securities, we may vote for such a proposal if there exists compelling long-term reasons to do so.
Our proxy voting decisions are made by our Portfolio Managers, who are responsible for monitoring each of our investments. To ensure that our vote is not the product of a conflict of interest, we require that: (i) anyone involved in the decision making process disclose to our Chief Compliance Officer any potential conflict that he or she is aware of and any contact that he or she has had with any interested party regarding a proxy vote; and (ii) employees involved in the decision making process or vote administration are prohibited from revealing how we intend to vote on a proposal in order to reduce any attempted influence from interested parties.
Information regarding how the Company voted proxies relating to portfolio securities during the most recent 12-month period ended June 30 is available, without charge, upon request, by calling the Company toll-free at 833-293-1769 and on the SEC's website at http://www.sec.gov.
Portfolio Holdings
The Company files its complete schedule of portfolio holdings with the SEC for the first and third quarters of each fiscal year on Form N-PORT. The Company's Forms N-PORT are available on the SEC's website at http://www.sec.gov and may be reviewed and copied at the SEC's Public Reference Room in Washington D.C. Information on the operation of the Public Reference Room may be obtained by calling 1-800-SEC-0330.
180 Degree Capital Corp.*
Board of Directors
| | | | | | | | |
Stacy R. Brandom1,2,3,4 | Tonia L. Pankopf1,2 | Kevin M. Rendino6 |
Richard P. Shanley1,2,3,4,5 | Parker A. Weil1,2,3,4 | Daniel B. Wolfe |
1. Member of Audit Committee 2. Member of Valuation Committee 3. Member of Compensation Committee
4. Member of Nominating Committee 5. Lead Independent Director 6. Chairman of the Board
* The Statement of Additional Information includes additional information about the Directors and is available, without charge, upon request, by calling 973-746-4500 or email ir@180degreecapital.com.
Officers
| | | | | |
| Kevin M. Rendino | Chairman, Chief Executive Officer and Portfolio Manager |
| Daniel B. Wolfe | President, Chief Financial Officer, Chief Compliance Officer and Portfolio Manager |
| Alicia M. Gift | Senior Controller, Secretary and Treasurer |
| Robert E. Bigelow III | Vice President, Head of Fund Development |
7 N. Willow Street, Suite 4B
Montclair, New Jersey 07042
Phone: 973-746-4500 Fax: 973-746-4508
Website: www.180degreecapital.com Email: ir@180degreecapital.com
Counsel: Schulte Roth & Zabel LLP
Independent Registered Public Accounting Firm: PricewaterhouseCoopers LLP
Custodian of Securities: US Bank, N.A.
Transfer Agent & Registrar: American Stock Transfer & Trust Company, LLC
Stockholder Relations Department
6201 15th Avenue
Brooklyn, New York 11219
877-260-8188
Website: www.astfinancial.com Email: info@astfinancial.com
HOUSEHOLDING OPT-OUT NOTICE
To reduce expenses, we may only mail one copy of the 180 Degree Capital Corp.'s shareholder updates, such as prospectus, annual report, semi-annual report, to those addresses shared by two or more accounts. If you are not a direct shareholder (i.e., you hold your shares of us in a brokerage account), please contact your financial institution to opt out of householding. If you are a direct shareholder (i.e., you hold your shares of us at our transfer agent) and wish to receive individual copies of these documents, please call us toll-free at 833-293-1769. We will begin sending you individual copies thirty days after receiving your request.
Item 2. Code of Ethics.
The Board has adopted a code of ethics applicable to our senior executive officers that is designed to promote honest and ethical conduct, including the ethical handling of actual or apparent conflicts of interest between personal and professional relationships (the "Code of Conduct"). Our Code of Conduct is available on the Company's website at https://ir.180degreecapital.com/governance-docs. The Company made amendments to the Code of Conduct to include reference to and items required under the Advisers Act. The Company did not grant any waivers from any provisions of the Code of Conduct during the reporting period.
Item 3. Audit Committee Financial Expert.
The Board has determined that all of the members of the Company's Audit Committee of the Board, Stacy R. Brandom, Tonia L. Pankopf, Richard P. Shanley and Parker A. Weil, meet the definition of "audit committee financial expert" as that term is defined by the SEC and are "independent" pursuant to paragraph (a)(2) of this Item.
Item 4. Principal Accountant Fees and Services.
The information set forth under the captions "Audit Committee's Pre-Approval Policies" and "Fees Paid to PwC for 2021 and 2020" in the Proxy Statement for the 2022 Annual Meeting of Shareholders, to be filed pursuant to Regulation 14A under the Exchange Act (the "2022 Proxy Statement") is herein incorporated by reference.
Item 5. Audit Committee List of Registrants.
The information set forth under the caption "Audit Committee" in our 2022 Proxy Statement is herein incorporated by reference.
Item 6. Investments.
(a) The schedule of investments in securities of unaffiliated issuers is included as part of the report to stockholders filed under Item 1 of this form.
(b) Not applicable.
Item 7. Disclosure of Proxy Voting Policies and Procedures for Closed-End Management Investment Companies.
We vote proxies relating to our portfolio securities in the best interest of our shareholders. We review on a case-by-case basis each proposal submitted to a shareholder vote to determine its impact on the portfolio securities held by us. Although we generally vote against proposals that may have a negative impact on our portfolio securities, we may vote for such a proposal if there exists compelling long-term reasons to do so.
Our proxy voting decisions are made by our Portfolio Managers, who are responsible for monitoring each of our investments. To ensure that our vote is not the product of a conflict of interest, we require that: (i) anyone involved in the decision making process disclose to our Chief Compliance Officer any potential conflict that he or she is aware of and any contact that he or she has had with any interested party regarding a proxy vote; and (ii) employees involved in the decision making process or vote administration are prohibited from revealing how we intend to vote on a proposal in order to reduce any attempted influence from interested parties.
Item 8. Portfolio Managers of Closed-End Management Investment Companies.
(a)(1) As of December 31, 2021, Kevin M. Rendino and Daniel B. Wolfe are primarily responsible for the day-to-day management of the Company's portfolio as Portfolio Managers.
Mr. Rendino has served as Chairman and Chief Executive Officer of the Company since March 2017 and as a member of the Board since June 2016. From 2012 to 2016, Mr. Rendino served as Chairman and Chief Executive Officer of RGJ Capital, where he led a Graham and Dodd approach to value investing. His team focused on a blend of long-only ideas and pair trades when a statistical anomaly and inconsistency between two variables are identified. From November 2017 to August 2019, Mr. Rendino served as a director of TheStreet, Inc., a publicly traded company in which we had an investment. From March 2019 to April 2021, Mr. Rendino served as a director of Synacor, Inc., a publicly traded company in which we had an investment.
Mr. Wolfe has served as President since January 2009, as Chief Financial Officer and Chief Compliance Officer since July 2016, and as Portfolio Manager and a member of the Company's Board since March 2017. He served as Chief Operating Officer and a Managing Director from January 2008 to June 30, 2016. He served as Chief Financial Officer from January 2008 to December 31, 2012, as Treasurer from May 2008 to December 31, 2012, and from July 2016 to April 2017. He has served as a member of the board of directors of privately held and publicly traded companies in which we have had investments. From September 2021 to present, he serves as a director of Parabellum Acquisition Corp., a publicly traded special purpose acquisition company whose sponsor, Parabellum Acquisition Holdings, LLC, is a company in which we have an investment.
(a)(2) Not applicable.
(a)(3) The principal elements of our executive compensation program for 2021 are base salary, bonus, other benefits and perquisites, and severance benefits. The Compensation Committee of the Board believes that each element is essential to achieve the Company’s objectives as set forth above.
Base Salaries. We recognize the need to pay our named executive officers, and other employees, a competitive annual base salary. We review base salaries for our named executive officers annually, often employing data provided from independent compensation consultants. Base salaries have historically been adjusted annually for inflation and also based on changes in the marketplace and an executive’s individual performance, salary position among peers, career growth potential and/or a change in responsibilities.
Cash Bonuses. The Company provides annual bonuses at the discretion of the Committee derived from a number of quantitative and qualitative inputs including, but not limited to:
•Performance against individual and corporate targets and goals;
•Performance as compared to indices and other observable entities that track or invest in microcapitalization publicly traded companies;
•Full year actual versus estimated expenses and expenses as a percentage of assets;
•Changes in the price per share of the Company’s stock, including dividends, if any;
•Changes in the net asset value of the Company, including dividends, if any; and
•The importance of retaining employees.
The weighting of these inputs in the Committee’s determinations of bonuses are adjusted based on a retrospective full analysis of individual and corporate achievements and challenges during the year under consideration.
Severance Benefits. To further incentivize and retain Messrs. Rendino and Wolfe, we entered into an Executive Severance Agreement with each executive.
Each of Messrs. Rendino and Wolfe's Executive Severance Agreement provides that the executive will receive the following severance benefits in the event that an executive’s employment is terminated by us other than for “cause” or an executive resigns for “good reason.”
•Twelve months of base salary to be paid in cash periodically in accordance with the Company’s normal payroll policies;
•a portion of executive’s incentive compensation in cash for the fiscal year in which executive's employment terminates, pro-rated based on time employed during the fiscal year, only to be paid to the extent that performance metrics in the plan are achieved and at the same time as payments to other executives in the applicable incentive compensation plan are paid; and
•Twelve months of COBRA premiums.
Further, under the terms of each Executive Severance Agreement for Messrs. Rendino and Wolfe, in the event an executive’s employment is terminated other than for “cause” or an executive resigns for “good reason” within the period commencing three months prior to a change in control and ending 12 months after a change in control, the severance will consist of:
•Twelve months of base salary to be paid in a single cash lump-sum;
•a portion of an executive’s incentive compensation in cash for the fiscal year in which executive's employment terminates, pro-rated based on time employed during the fiscal year;
•Twelve months of COBRA premiums.
For purposes of the Executive Severance Agreements, "cause" generally means:
•an act of dishonesty made in connection with the executive’s responsibilities as an employee;
•conviction of, or plea of nolo contendere to, a felony or any crime involving fraud or embezzlement;
•gross misconduct;
•unauthorized use or disclosure of any proprietary information or trade secrets;
•willful breach of any obligations under any written agreement or covenant with the Company;
•failure to cooperate in good faith with a governmental or internal investigation; or
•continued failure to perform duties after receiving a written demand of performance.
For purposes of the Executive Severance Agreements, "good reason" generally means a voluntary termination following the occurrence of one or more of the following, without the executive’s consent that is not cured within 30 days of notice to the Company:
•a material reduction of responsibilities;
•a material reduction in base salary; or;
•a material change (at least 50 miles) in the geographic location of Executive’s primary work facility or location.
(a)(4) As of December 31, 2020, Mr. Rendino and Mr. Wolfe beneficially owned equity securities of the Company valued over $1,000,000 and between $500,001 and $1,000,000, respectively.
Item 9. Purchases of Equity Securities by Closed-End Management Investment Company and Affiliated Purchasers.
| | | | | | | | | | | | | | |
| Year 2021 | (a) Total Number of Shares Purchased | (b) Average Price Paid Per Share | (c) Total Number of Shares Purchased as Part of Publicly Announced Plans or Programs | (d) Approximate Dollar Value of Shares that May Yet Be Purchased Under the Plans or Programs |
| 01/01 - 01/31 | 0 | | 0 | | 0 | | $ | 2,500,000 | |
| 02/01 - 02/28 | 0 | | 0 | | 0 | | 2,500,000 | |
| 03/01 - 03/31 | 0 | | 0 | | 0 | | 2,500,000 | |
| 04/01 - 04/30 | 0 | | 0 | | 0 | | 2,500,000 | |
| 05/01 - 05/31 | 0 | | 0 | | 0 | | 2,500,000 | |
| 06/01 - 06/30 | 0 | | 0 | | 0 | | 2,500,000 | |
| 07/01 - 07/31 | 0 | | 0 | | 0 | | 2,500,000 | |
| 08/01 - 08/31 | 0 | | 0 | | 0 | | 2,500,000 | |
| 09/01 - 09/30 | 0 | | 0 | | 0 | | 2,500,000 | |
| 10/01 - 10/31 | 0 | | 0 | | 0 | | 2,500,000 | |
| 11/01 - 11/30 | 0 | | 0 | | 0 | | 2,500,000 | |
| 12/01 - 12/31 | 0 | | 0 | | 0 | | 2,500,000 | |
| Total for Year | 0 | | | 0 | | |
On August 9, 2021, our Board reauthorized the repurchase of up to $2.5 million of the Company's common stock within a six-month period from the date of notice to investors, which notice was mailed on or about August 13, 2021. As of December 31, 2021, no repurchase had occurred.
On February 22, 2022, our Board reauthorized the repurchase of up to $2.5 million of the Company's common stock within a six-month period from the date of notice to investors, which notice will be mailed on or about February 28, 2022.
Item 10. Submission of Matters to a Vote of Shareholders.
There have been no material changes to the procedures by which shareholders may recommend nominees to the registrant's Board of Directors as set forth in the registrant's Proxy Statement, dated March 2, 2021.
Item 11. Controls and Procedures.
(a) Based on an evaluation of the Registrant's Disclosure Controls and Procedures (as defined in Rule 30a-3(c) under the Investment Company Act of 1940, the “Disclosure Controls”) as of a date within 90 days prior to the filing date (the “Filing Date”) of this Form N-CSR (the “Report”), the Chief Executive Officer (its principal executive officer) and Chief Financial Officer (its principal financial officer) have concluded that the Disclosure Controls are reasonably designed to ensure that information required to be disclosed by the Registrant in the Report is recorded, processed, summarized and reported by the Filing Date, including ensuring that information required to be disclosed in the Report is accumulated and communicated to the Registrant's management, including the Registrant's principal executive officer and principal financial officer, as appropriate to allow timely decisions regarding required disclosure.
(b) There were no changes in the Registrant’s internal control over financial reporting (as defined in Rule 30a-3(d) under the Investment Company Act of 1940) that occurred during period covered by this report that have materially affected or are reasonably likely to materially affect the Registrant’s internal control over financial reporting.
Item 12. Disclosure of Securities Lending Activities for Closed-End Management Investment Companies.
(a) Not applicable.
(b) Not applicable.
Item 13. Exhibits.
(a)(1) The Code of Conduct is available on the Company's website at https://ir.180degreecapital.com/governance-docs.
(a)(3) Not applicable.
(a)(4) Not applicable.
SIGNATURES
Pursuant to the requirements of the Securities Exchange Act of 1934 and the Investment Company Act of 1940, the Registrant has duly caused this report to be signed on its behalf by the undersigned, thereunto duly authorized.
180 DEGREE CAPITAL CORP.
| | | | | |
| By: | /s/ Daniel B. Wolfe |
| | Name: Daniel B. Wolfe |
| | Title: President and Chief Financial Officer |
| | |
| | Date: February 24, 2022 |
Pursuant to the requirements of the Securities Exchange Act of 1934 and the Investment Company Act of 1940, this report has been signed below by the following persons on behalf of the Registrant and in the capacities and on the dates indicated.
| | | | | | | | | | | | | | |
| By: | /s/ Kevin M. Rendino | | By: | /s/ Daniel B. Wolfe |
| | Name: Kevin M. Rendino | | | Name: Daniel B. Wolfe |
| | Title: Chief Executive Officer | | | Title: President and Chief Financial Officer |
| | (Principal Executive Officer) | | | (Principal Financial Officer) |
| | | | | |
| | Date: February 24, 2022 | | | Date: February 24, 2022 |