UNITED STATES
SECURITIES AND EXCHANGE COMMISSION
Washington, D.C. 20549
FORM N-CSR
CERTIFIED SHAREHOLDER REPORT OF REGISTERED
MANAGEMENT INVESTMENT COMPANY
Investment Company Act file number 811-07074
| | |
| 180 DEGREE CAPITAL CORP. |
| (Exact Name of Registrant as Specified in Its Charter) |
| | | | | | | | |
| 7 N. Willow Street, Suite 4B, Montclair NJ | | 07042 |
| (Address of Principal Executive Offices) | | (Zip Code) |
| | |
Daniel B. Wolfe
President and Chief Financial Officer
180 Degree Capital Corp.
7 N. Willow Street, Suite 4B
Montclair, NJ 07042 |
| (Name and address of agent for service) |
|
Copy to:
John J. Mahon, Esq.
Schulte Roth & Zabel, LLP
1152 Fifteenth Street, NW
Suite 850
Washington, DC 20005
(202) 729-7477 |
Registrant's telephone number, including area code: (973) 746-4500
Date of fiscal year end: December 31
Date of reporting period: June 30, 2022
Item 1. Report to Shareholders.
Fellow Shareholders,
Imagine waking up to the realization that you are set to fight Mike Tyson and have him punch you in the face for 6.5 straight hours. Now imagine that happens every morning… Hello Q2 2022 (which was the actual twin of Q1 2022).
For a more detailed illustration of what I am referring to, here is a timeline of a typical day for any day during the last quarter:
12:00 AM to 6:00 AM: What should be my normal 6 hours of sleep turns into a toss and turn fest with my mind racing, thinking of markets, our holdings, Russia, and the Fed. In the minutes I actually fall asleep, I am awakened with nightmares of Disney World passes costing $7,890 per day per person, making a five-day trip for a family of five cost $197,250 (weirdly I can do the math in my sleep [Side note from Daniel: I confirm he really can do this and substantially more complex math in his head]), not including airfare and hotel rooms. “Inflation” has now replaced Jason Voorhees from “Friday the 13th” movies as the source of what feels like an everyday nightmare.
6:00 AM to 7:30 AM: A check of the daily news: Europe down, Asia down, Russia still bombing Ukraine, oil up, 79 stories on supply chain disruptions, incessant inflation chatter, futures down. ZeroHedge tweeting every negative data point imaginable for their 1.4 million followers to ponder. Spit my coffee out in frustration over listening to incessant yelling and screaming from pathetic politicians from both political parties’ extremes. Bad data points on the economy mean we are headed towards a depression. Good data points on the economy mean the Fed will raise the Fed Funds rate 75 basis every month for the next 5 years. Stellar, I see nothing changed from the morning before. Glad I woke up.
7:30 AM to 9:30 AM: I put aside the daily news and shift to optimism that today will be the day that the market will stop discounting the same news over and over and over again. I begin to believe that today our holdings, many of which trade at the lowest valuation levels in their history despite decent fundamentals, will stop going down at stairstep levels.
9:15 AM: Reality check for my optimism during the previous hour. Do you know those insane lines you see at Best Buy at midnight the morning of Black Friday; the ones where people shove each other to the ground the minute the store opens so they can get their 60-inch Samsung TVs? Think about 180’s stocks along the same line. It feels like every stock we own is chomping at the bit for the markets to open so they can all open down 4% on 329 shares (on no news). They are all excited to torture me and ruin my day starting in just a short 15 minutes from now.
9:31 AM: Indeed, optimism unwarranted and dream ends as every single one of our holdings opens up down 4% except for PBPB, which probably won't have its first trade cross for another hour and a half (even though it’s a NASDAQ listed company with over ~$400 million in revenue). Serenity now.
9:45 AM: “Daniel, can we get Ryan and Tony from ALTG on the phone? The stock is down 7% on 4,300 shares. I know they just reported better than expected earnings YESTERDAY and provided solid guidance for the upcoming quarter YESTERDAY, but maybe things changed in the middle of the night or maybe we are missing something.”
10:00 AM: Apologize to ALTG’s management for bothering them so soon after we talked to them 14 hours ago, but we are wondering if we are missing anything that came from its conference call (that we listened to) or follow-up calls like the one we just had with them: I REPEAT 14 HOURS AGO. No, nothing changed at 2:00 AM. We continue to believe our thesis is intact (for the 64th time in the last 90 days), so we buy more.
10:30 AM: Get a call that there is a block of 300,000 shares of SCOR for sale despite the stock getting cut in half the last quarter on the back of the company BEATING ESTIMATES (that were never cut to begin with). Spend the next hour or so calling around to see what we are missing. Find nothing of note, so we tell the broker we will buy stock at $1.75 with the bid/ask spread at $1.76/$1.80 as long as it’s a clean-up sale by the seller. We are told it’s a “clean up.” The broker says the seller is at $1.85. We tell the broker to tell the seller to have a nice day because we are not negotiating our price. By 2 pm, the seller has come back and asked if we would buy at $1.77. NO. We lower our price to $1.74 just to be obnoxious. At 3 pm the seller returns asking if we would buy at $1.76. Again, we say no and lower our bid to $1.73 (again for spite). At 3:59 pm we buy the block at our price. The good news is we cleaned up the seller. The bad news (for tomorrow) is the seller will miraculously be back with more stock from “another account”. By the way, as an aside, we never believe in so-called “clean-up” sales.
10:45 AM: PBPB finally opens with 765 shares traded and the stock is down 2.7%. Not bad as it usually opens down 4%. This feels like a win to me. This is the definition of being “glass half-filled” in a bear market.
11:00 AM: After closing yesterday at $9.50, AREN’s bid/ask spread is $8.80/$10.20. You think I am joking, but I am not. Someone sells 100 shares at 8.80 and the stock is down 7%. That costs us 96 bps of performance. I feel stupid, dumb, and that I am a washed-up portfolio manager. I get dejected, sad, and angry. I don’t know what to do with myself and lose my appetite so I decide to not eat lunch and just drink water.
11:30 AM: AREN trades at $10.20 after a 200 share “block” hits the tape. Stock is now up 7% for the day. Adds 96 bps to our daily performance. I feel rejuvenated, smart, elated, and relieved. I’m on top of Mt. Everest. My appetite has returned, so I order a turkey club and Diet Coke to celebrate.
12:15 PM: Despite the market rallying to barely unchanged from the 4% gap-down opening, PBPB, refuses to participate; in fact, Elizabeth Taylor (I could have gone Jenifer Lopez, but I am older) had more husbands than PBPB had trades through the first 3.5 hours of the market. Its second trade of the day is for 128 shares and it’s now down 3.6%. We spend the next hour combing through our model to make sure that we see the path for PBPB’s share price to triple as it grows its store base from 400 to over 2,000, primarily through its focus on franchising.
12:30 PM: Why I keep CNBC on all day is beyond me. I now listen to 30 minutes of experts telling me how bearish they are, how the only thing they want to own is energy (somehow, they try and convince everyone they were early on in that trade) and everything else is a sale. Amazing how all these long-only managers are doing quite well this year and last year. And every year for that matter. Based on how they describe their performance, none of them have ever done poorly! I mute the TV.
1:00 PM: I turn my attention to TURN stock, which I will gladly buy for the 100+ time while we are in open trading windows. Daniel and I approve pre-clearance requests from all of our employees, who then proceed to also purchase TURN stock. I know our stocks are down, but to think our share price should trade below 180’s cash and public and related securities ignoring the ~$3.00 of fair value we have for our legacy private holdings is, in our collective view, idiotic. Our ultimate goal is for 180 to have $200 million in assets and $20 stock. I try to buy 50,000 shares of TURN at a limit price in the middle of bid/ask spread. I got 1,200 shares. TURN’s stock never goes up anymore, but nobody is a seller and I can’t find stock to buy. How does that work?
1:10 PM: Get call from a TURN shareholder asking us why we aren’t buying back stock. Fair question.
1:20 PM: Get a call from a TURN shareholder asking us why we don’t initiate a dividend. Fair question.
1:30 PM: Get a call from a TURN shareholder telling us they would be very disappointed if we bought back stock or initiated a dividend. This shareholder wants us to continue doing what we have been doing since we started in 2017. Especially given the crash, this shareholder believes the best use and highest potential for generating returns on TURN’s permanent capital is investing in public companies that we believe have the potential for returns of at least 100%. Also, a fair opinion!
1:45 PM: PBPB is down 5.47% on 2,300 shares. Can’t call a sell-side analyst because nobody covers it. We look at our model and call Bob and Steve at PBPB to walk through it again with them for the 2,000th time (but only 5th time this quarter). We continue to believe our thesis is intact. We put in an order for 5,000 shares on the bid side. I tell Daniel for the 11th time today, “I can’t take it anymore,” which is a lie because I have been saying that since 1988, and I am still managing money with Max Scherzer intensity.
2:00 PM: That said, I scour the job listings site in the New Jersey Star Ledger newspaper and wonder if I would be a good door to door cutlery salesman. I’m probably underqualified for that job, so I go back to figuring out why SCOR is down 6%, reminding myself that this is the only job I have ever had, I love it, and running 180 is the only thing I want to do. I clearly “CAN” take it.
2:15 PM: After we scour the trading desks of the 20+ Wall Street firms we regularly communicate with and trade through, the only answer we get for why SCOR is down is, “All the selling is in the dark pools. We believe it’s all algo (short for computer algorithm) trading.” Great, a bunch of machines automatically put in sell orders because a stock is down, which creates more pressure on the stock and draws more selling from all the other momentum based algos. Fantastic. Selling begets selling. Reminds me of some of the momentum investors I used to work with over the years: 1. none of which I would ever have given a nickel of my money to manage, 2. none of which I ever saw consistently make money for their investors, and 3. none of which really had long careers. I start telling Daniel stories of the “salad days” back at Blackrock. Daniel feigns interest, but I can see the eyes rolling to the back of his head. Great, we just wasted an hour trying to find some fundamental reason for the stock to be down.
2:30 PM: I remind myself that no matter how brutal a period this is, I am grateful we sold AFI when we did. AFI had the single worst management team I have invested in since I have been at 180, but our investment approach minimized our losses on that investment. It gives me great pleasure to enunciate out loud just how pathetic that management team was. It is the only “win” of my day.
3:00 PM: We have been down roughly 2.5% the entire day. We were down 2.5% when the market was down 4%, and after it rallied back to unchanged for the day, we are still down 2.5%. The lack of trading volume for our holdings is astounding to me. I ask Daniel if his screen is working because mine hasn’t flashed and seems locked. Nope, our stocks haven’t had a traded in well over an hour! I check our PBPB model again. Yep, same story as an hour ago, except this time we don’t call the management team since we spoke with them a little over an hour ago and we’ll probably call them tomorrow.
3:15 PM: For some reason, I decide to unmute the TV. My blood pressure boils because an investor comes on the air and says he’s worried about inflation, so he’s going to “sit this out until he gets the ‘all clear’.” I am mortified at the comment and break out in hives thinking through a story I will share with you later in this letter about the last time I heard the “all clear” line. First off, investors don’t sit anything out. There is always something to do. Secondly, I can’t remember someone ringing the bell at the bottom of any of the historical market bottoms from 1987, 1990, 1998, 2003, 2008, 2018, or March 2020. It doesn’t work that way. I mute the TV again. I'd rather watch Dr. Phil at this point.
3:20 PM: I remind myself that as people are telling me the sky is falling (these are the same people that were buying every meme stock in the first quarter of 2021). The US just posted an increase of almost 400,000 jobs for the month of June. I’m not sure how the creation of that many jobs equates to eminent economic doom. Do I think a recession is coming? I believe we are in one now, and job growth like what we had in June 2022 makes me believe the US can manage through it without massive calamity.
3:30 PM: In the span of five minutes, I tell Daniel, “We shouldn’t buy anything anymore until this market calms down,” to “This market is so irrational that we should be buying everything.” I go through the five stages of grief at least twice a day, and I just wrapped up the acceptance stage with half an hour to go in today’s trading session.
3:45 PM: After thinking through what thoughts have been running through my head all day, I enunciate them out loud. “We are in a recession already, but the U.S. just posted almost 400,000 new jobs in June 2022. The market already is telling us that inflation is high, but there are signs inflation is peaking right now. Interest rates are going up, but the 10-year U.S. Treasury yield is 2.8%. COVID is “over” in some countries, but in others it seems like COVID will never end. I believe the market has bottomed out. I believe the market is going to collapse. I’m buying everything. I am not buying a thing.” I sound like a lunatic. Serenity now!
3:58 PM: AREN which now has a bid/ask spread of $8.90/$10.10 (much tighter) trades 47 shares on the bid side ruining our day all over again. Serenity now. Serenity now. SERENITY NOW. I don’t know why I bought that turkey club sandwich. I am not eating tomorrow. While in my happy place I have decided this bid-side trade will be a positive for us because tomorrow it will trade up to the offer side and we will have a great day!
3:59 PM: PBPB also trades 43 shares on the close, except on the offer side of its $5.20/$5.61 bid/ask spread. That’s bad because tomorrow it will trade down to the bid side and will wreck our day.
4:00 PM: Today’s roller coaster is now over. I experienced emotions from laughter to optimism to depression to sea sickness. Total punches to face from Mike Tyson: 98. Let’s do it again as tomorrow will be different!
4:00 PM to 11:59 PM: The rest you don’t care about (that’s assuming you cared about any of this). Time to head off to my son’s baseball game, eat dinner with family, and perhaps take one hour to watch an episode of Yellowstone. The remainder of this time is spent combing through models, calling our companies, setting up conference calls, screening for new names, reading and convincing myself that this market could provide the opportunity that TURN needs to get to $200 million in net assets, which I believe could result in our stock trading close to $20. Optimism to pessimism back to optimism back to pessimism at least 7 or 8 times. Time to go pretend like I am going to sleep. Without nightmares, I hope.
While some of the descriptions and discussion above are tongue-in-cheek, the reality is that a significant portion of it is truly representative of a typical day during the first half of 2022. These six months have been challenging to say the least with a very confusing backdrop of economic data and frightening geopolitical events. Even though it has been a rollercoaster of emotions trying to navigate through these markets, we don’t manage money with emotion. We are deliberate and we are objective. We are focused on individual companies that we believe have the potential to generate a return of 100% over a three-year cycle. Despite mentioning how we toggle back and forth between a series of conflicting views on our macro and micro-economic
outlooks, we do indeed have a view. We believe we are already in a recession. We come to that conclusion based on the historical definition that has existed for a century, i.e., a recession is defined by two consecutive quarters of a decline in GDP. I’m not sure why this point is being continuously debated.
I was recently reading an article from Forbes that summarizes the current environment:
“Two quarters of negative growth, as we’ve seen so far in 2022, is a good rule of thumb for identifying recessions. However, the National Bureau of Economic Research (NBER) makes the final call. That can take some time as they look at all the data and the early estimates, such as we saw this morning, are refined over the coming months.
This is the NBER’s recession definition:
A significant decline in economic activity that is spread across the economy and that lasts more than a few months.
Let’s look at the elements of that in detail.
Three Considerations
Duration - The NBER fundamentally considers three things in calling recessions. These are depth, diffusion and duration of any economic decline. Given we’ve seen 6 months of negative growth for the U.S. economy the duration test is likely met.
Depth - Depth of the decline remains a key question. With declines in economic growth of around 1% to 2% so far in 2022, this is a pretty shallow decline. Calling the current dip in economic growth a “significant decline” may be a stretch. Often recessions can see the economy decline around 5% or more. So if this is a recession it’s a shallow one, at least so far. The lack of real depth to this decline may prevent the NBER from calling it a recession just yet. However, if this slump persists, the NBER may be forced to call it a recession regardless.
Diffusion - Then diffusion is the most complex of the three parts of the NBER’s definition. Clearly, some sectors of the economy such as travel and energy are doing relatively well today. On the other hand, we’ve seen big swings in trade, and now some slowing in the retail, automotive and housing sectors as well as slowing business investment in general. This mixed pattern is not unusual. The different parts of the economy seldom move together. Often recessions happen as some sectors boom. The 1970s and 1980s are good examples. The economy hit several recessions, but the energy industry did relatively well throughout.
What Will The NBER Do?
So we’ll have to wait some time to see if the NBER call this a recession. It’s not a simple call. If they name this a recession, it’s a shallow one, so far, compared to most examples in recent history. In a sense, that’s good news for markets, deep recessions are a bigger problem.
It May Not Matter For Markets
Nonetheless, while naming a recession is a debate, the economic situation in the U.S. for 2022 so far is pretty clear. We’re currently seeing a combination of declining growth and very high inflation. That’s essentially stagflation, especially if it persists. Whether or not it’s a recession is more of an academic debate. Since it’s clearly a proven toxic mix for financial markets, especially since we entered 2022 with relatively optimistic valuation levels. The question for the remainder of 2022 is whether inflation comes down significantly and if growth resumes, that, rather than the technical call on any historic or ongoing recession, is what will likely drive markets.”
Are we in a recession or not? Is it going to get worse or not? I am reminded of Saturday Night Live video of Dana Carvey playing George Bush back in the days of the 1990 recession. Here is a link to the video for a little lighthearted humor: https://youtu.be/yD8lIGqmHpE.
I was just 24 years old then but everyone was telling me it was the end of the world. War with Iraq. Banking and savings and loan collapse. Guess what? It wasn’t the end of the world. We recovered, and I suspect this isn’t going to be the end of the world either. One way or the other, I am not sure I care. The Russell Microcap Index has declined by 33% since it peaked in November 2021. Whether we are in recession, headed for a recession, or won’t have a recession, the market has already
discounted significant bad news. The market hasn’t just declined, it has experienced a slow methodical crash that has left many of TURN’s holdings (and countless others) to trade at all-time low valuations.
We recently wrote a white paper describing how markets perform going back to the depression during recessionary periods and I thought it would be useful to include this white paper in this letter:
It’s Always Darkest Before Dawn
War continues to rage in Ukraine. Inflation continues to run rampant. Gas prices are at record highs. Food prices are eating into consumers pocketbooks. Mortgage rates have skyrocketed. Gross Domestic Product fell in the first quarter of 2022. The Fed is in the midst of a major tightening cycle. When you add all of this together, it seems obvious why many believe that we are headed into a recession, defined as a drop in GDP for two successive quarters.
Given all of this, it’s no wonder that the stock market has been in the grips of a serious sell off thus far in 2022. From their peaks, the S&P is down 21% and the Russell Small Cap Index is down an even more significant 33%.
The question for investors though, is when to become optimistic on the market again and, as a result, begin adding risk to portfolios. Since nobody rings a bell to signify that the market has hit bottom, we decided to look back at previous recessions to see what history could tell us.
Dating back to the Great Depression there have officially been 15 recessions. They have obviously varied significantly in both length and severity. That said, the average recession has lasted a little over one year. This includes the aforementioned Great Depression as well as the more recent 2008 subprime mortgage triggered recession, both of which lasted significantly longer. No economist currently expects the current recession, if it even comes to pass (so far, we only have one negative quarter of GDP), to be anywhere near as bad as those two events. When we remove those two downturns from the data, the average term of the remaining 13 recessions drops to around 10.5 months.
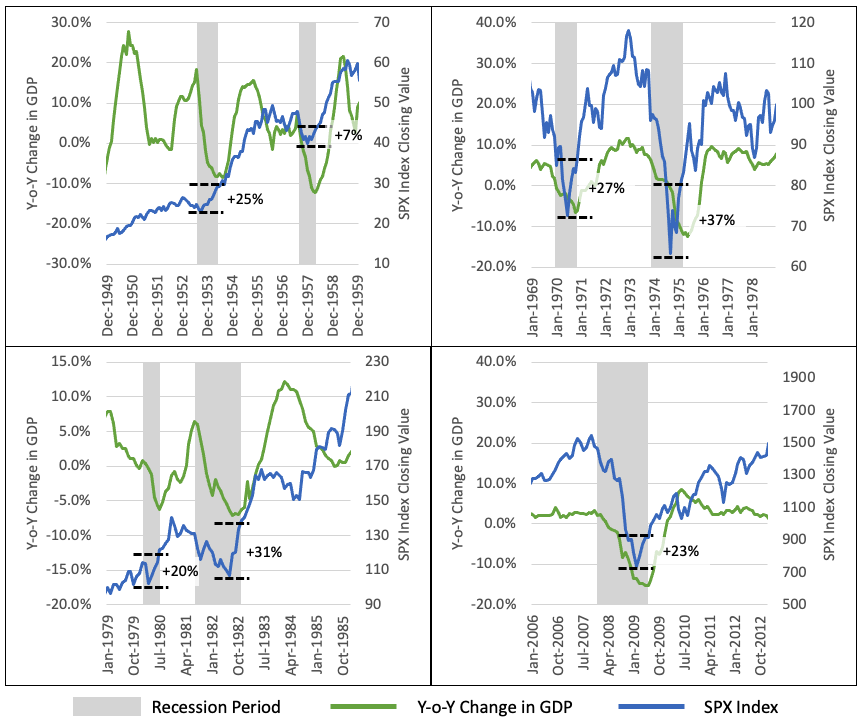
The interesting aspect, foreshadowed by the title of the piece, is the point during a recessionary cycle when the market has historically bottomed out. On average, for the 15 recessions dating back to the Great Depression, the stock market has hit its lowest point when 40% of the recession still remains. In other words, if a recession ends up lasting 10 months, the market bottom would occur at approximately the six-month point.
This number goes to just under 50% when you take out the small recession (GDP only contracted 0.3%) back in the early 2000’s that was triggered by the dotcom bubble. That sell-off was clearly exacerbated by the unprecedented multiples that the market was trading at then. For reference, the S&P was trading at a multiple 47x price to earnings ratio on 1/1/2001 vs 23x on 1/1/2022.
These trends are shown on the following charts for four periods in history that encompass seven recessionary periods.
Percent change is from the bottom of the SPX in a recessionary period to the end of that recessionary period.
What does this analysis tell us about the current market situation? Assuming we are in the midst of a recession, then when economists look back, they will likely peg its beginning to somewhere in the fourth quarter of 2021. If we use 12/21 as a starting point for the current downturn, then we would already be seven months into the current recession. If the current downturn ends up lasting an entire 12 months (the historic average for the length of recessions), then we are slightly over halfway through it. Further, we are inching up on the historic 60% point where the market has historically bottomed out before beginning a positive trajectory (often a significant one).
Clearly, timing the bottom is a very difficult exercise at best. That said, it seems reasonable that combining market history with some positive data (attractive valuations, improving supply chain, early signs of disinflation among others), presents an interesting case that we may, in fact, be near what will end up being the bottom of this bear market. One final historical point; there is a wide disparity for how long it has taken the market to return to its pre-bear market highs. For example, in the Great Depression in the early 1930’s, it took the market 258 months to recover to its previous high, and in the 2008 recession it took 45 months. In many other periods (e.g., the 1950’s, 1991, 2020) it took less than 5 months. Much depends on the severity of the recession and the amount of leverage in the system at the time. While the market has crashed to levels depicted in the Great Depression and the 2008 economic equivalent of Pearl Harbor, this doesn’t feel like an “end of the world” recession to us. For example, the US just created close to 400,000 jobs in the month of June! While we never know how long these recessions will last, the one thing we know from history is that when the newspapers and media outlets declare the recession to be over, the market is already well off its lows and real money has been made for investors.
"All Clear"
Back to the story I promised to share about waiting for the “all clear.” While the names shall remain nameless, I have told the story of a friend of mine who was having a normal performance review discussion with his “suit” boss (you know, the person that never managed a dollar of assets in his life, but thinks he knows everything). The discussion occurred during a rough patch for the market against the backdrop of a tough economy.
Boss: “Unless you are 100% certain about the market, why would you have any risk on?”
Portfolio Manager: "You mean I’m supposed to be 100% cash? I don’t ever recall any environment in my entire career when I was 100 % certain of the future."
Boss: “If I were you, I would just wait for the 'all clear' signal that it’s safe to invest again.”
Portfolio Manager (shaking his head in disbelief): “That doesn’t happen. EVER. Nobody rings a bell. It doesn’t work that way.”
The portfolio manager then proceeds to my office and we laugh out loud about how insane the conversation was. Portfolio manager bonding. It’s always easy for the people that don’t manage money to comment on how easy it is to actually manage money, except when you give them a $1.00 to manage. My friend stayed the course and was true to his discipline.
Of course, you know how this ends, right? A year later, the economy is humming, the market has recovered, my buddy has crushed it, and the market is up 30%. Performance review time comes:
Boss to the Portfolio Manager: “Seems to me now is the time to put on more leverage.”
Portfolio Manager: [Responding in his head] THANKS!
This environment for 180 reminds me of that conversation. By the time the smartest people in the world declare we are in recession, we will probably be out of it, and the market will be materially higher. Nobody ever comes around and rings a bell telling us that “the market bottoms today.” We will invest our capital in a handful of names because we believe: 1) their valuations already discount much of the negativity; and 2) they offer the potential for significant share price appreciation. While we currently believe we will generate meaningful returns on these investments and our shareholders will greatly benefit from this period, I don’t know when such returns will occur. All I know is we have NEVER been 100% certain of the future for the 34 years we have been managing money. I have lived in my own space of never thinking I was 100% certain I knew what the world would look like. That is in good times or bad. We make calculated educated decisions about the risk/reward to what valuations are and the potential opportunities that exist.
With that, let’s get into the nuts and bolts of our performance from this past quarter.
NET ASSET VALUE PER SHARE
Our net asset value per share (“NAV”) decreased this quarter from $9.81 to $8.35, a -14.9% decline. Our Fund has three principal components to the variance in our NAV: our public portfolio, our private portfolio, and our expenses. For the quarter, our public portfolio companies caused our NAV to decline by $1.27, while our private portfolio companies decreased our NAV by $0.12. Operating expenses, net of reversal of certain deferred bonus accruals decreased NAV by $0.07.
| | | | | | | | | | | | | | | | | | | | |
| Quarter | YTD | 1 Year | 3 Year | 5 Year | Inception to Date |
| Q2 2022 | Q4 2021- Q2 2022 | Q2 2021- Q2 2022 | Q2 2019- Q2 2022 | Q2 2017- Q2 2022 | Q4 2016- Q2 2022 |
| | | | | | |
| | | | | | |
| | | | | | |
| Change in NAV | (14.9%) | (21.7%) | (21.8%) | (1.3%) | 14.1% | 18.9% |
| | | | | | |
| Change in Stock Price | (10.4%) | (16.6%) | (23.9%) | 3.8% | 26.1% | 48.1% |
| | | | | | |
| Russell Microcap Index | (19.0%) | (25.1%) | (30.8%) | 15.8% | 24.9% | 30.2% |
| Russell Microcap Value Index | (15.3%) | (17.1%) | (17.9%) | 29.5% | 38.8% | 42.6% |
| Russell 2000 | (17.2%) | (23.4%) | (25.2%) | 13.1% | 28.5% | 34.9% |
| | | | | | |
| | | | | | |
| | | | | | |
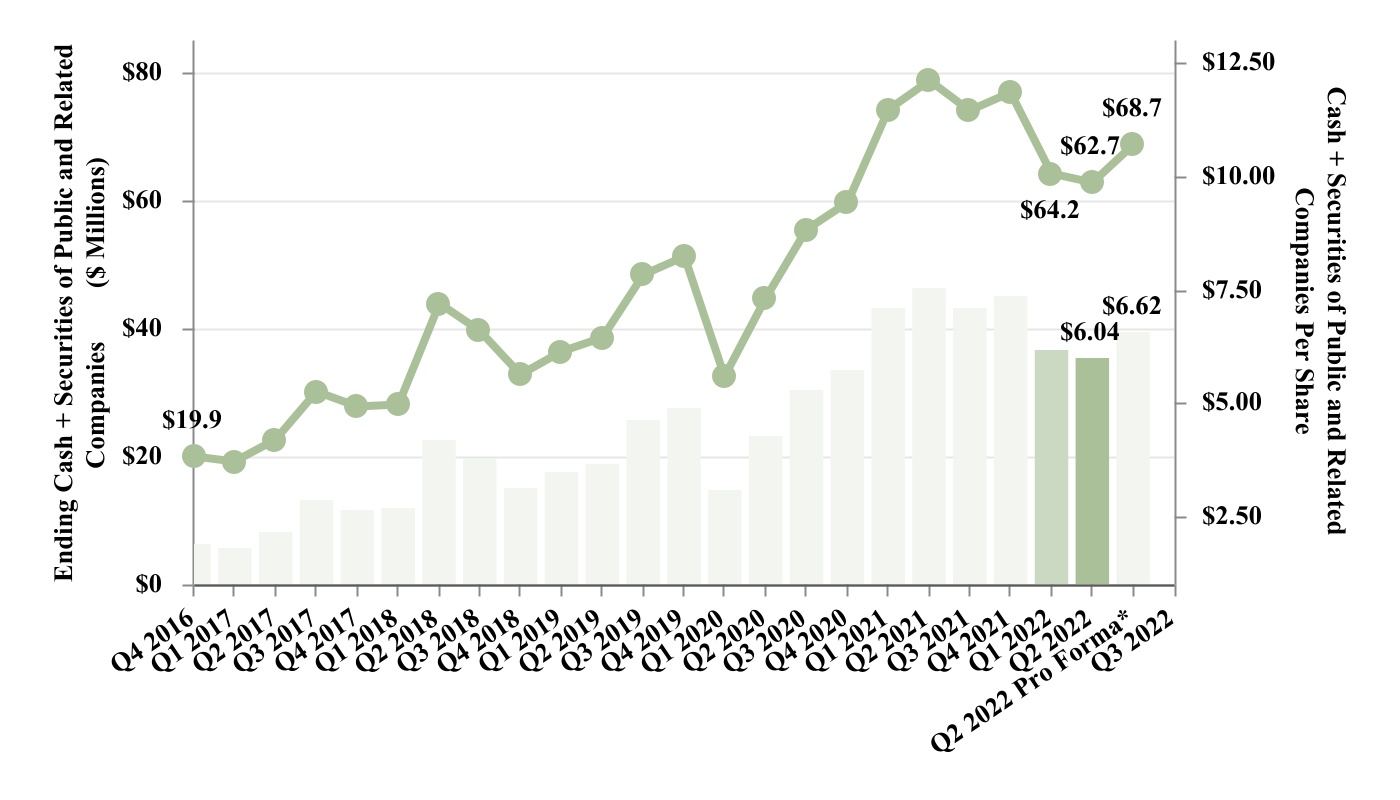
As bad a quarter as this has felt to us, I would offer the following chart to provide some perspective on our performance over a longer period of time. Despite a slight dip this quarter, we have grown our cash and liquid securities to a level greater than our share price, illustrating just how cheap we believe our stock is today, particularly if you include on a pro forma-basis the value of our holdings of D-Wave Systems, Inc., that completed its de-SPAC merger on August 5, 2022.
* Q2 2022 Pro forma for de-SPAC of D-Wave Systems, Inc. based on value as of June 30, 2022.
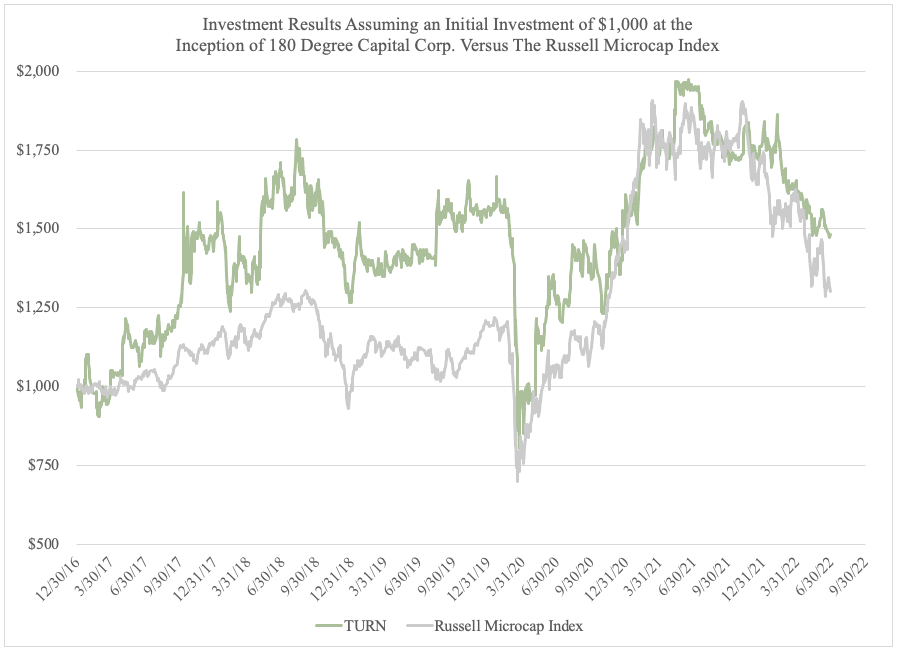
On a relative basis, TURN's stock price total return of +48.1% has also exceeded the Russell Microcap Index total return of +30.2% since our inception as is shown in the chart below:
PUBLIC AND RELATED PORTFOLIO
In the chart below, you see our quarter to date, one-year, three-year, and inception-to-date performance numbers. For Q2 2022, we showed a gross total return for our public portfolio of -19.0%, versus a gross total return for the Russell Microcap Index of -19.0% and a gross total return for the Russell Microcap Value Index of -15.3%. Year to date, our -31.0% gross total return compares negatively to the -25.1% return for the Russell Microcap Index. Despite this year’s performance, our three-year, five-year, and inception to date numbers show significant outperformance versus these benchmarks as seen in the chart below.
| | | | | | | | | | | | | | | | | | | | |
| Quarter | YTD | 1 Year | 3 Year | 5 Year | Inception to Date |
| Q2 2022 | Q4 2021- Q2 2022 | Q2 2021- Q2 2022 | Q2 2019- Q2 2022 | Q2 2017- Q2 2022 | Q4 2016- Q2 2022 |
TURN Public Portfolio
Gross Total Return (Excluding SMA Carried Interest) | (19.0%) | (31.0%) | (31.6%) | 45.2% | 172.8% | 227.5% |
TURN Public Portfolio
Gross Total Return (Including SMA Carried Interest) | (19.0%) | (31.0%) | (29.7%) | 55.0% | 190.8% | 249.0% |
| | | | | | |
| | | | | | |
| | | | | | |
| Change in Stock Price | (10.4%) | (16.6%) | (23.9%) | 3.8% | 26.1% | 48.1% |
| | | | | | |
| Russell Microcap Index | (19.0%) | (25.1%) | (30.8%) | 15.8% | 24.9% | 30.2% |
| Russell Microcap Value Index | (15.3%) | (17.1%) | (17.9%) | 29.5% | 38.8% | 42.6% |
| Russell 2000 | (17.2%) | (23.4%) | (25.2%) | 13.1% | 28.5% | 34.9% |
| | | | | | |
| | | | | | |
| | | | | | |
Let’s dig into the significant sources of the changes in value in our public portfolio in Q2 2022.
Sources of material decreases in value:
•Synchronoss Technologies, Inc. (SNCR): Despite reporting better than expected revenue and EBITDA for Q1 2022 and the sale of a non-core asset for up to $14 million, the stock declined by 33.5% in the quarter. The positive operating performance was overshadowed by comments from management at conferences and in follow up calls that confused investors with regard to the ability of the company to generate unadjusted positive free cash flows and to substantially payoff its outstanding preferred stock. In our view, these are the equivalent of “unforced errors” by SNCR’s management and Board. While the last two points are perhaps attempting to justify a stock going down in a bear market, I will say we are considering ramping up our activism until we are convinced the management team and SNCR’s Board show a greater sense of urgency with regards to creating value for shareholders.
SNCR has been an outright disaster for an extended period of time. We believed when we helped the company recap its previously expensive and restrictive debt, that event would have been the catalyst for the company to create value. Its operating performance should have been enough to warrant stability in the equity, and certainly should not have been the cause of the share price plummeting 33.5% this quarter and 50% since the recap. While we need to hear about a clear plan to reduce the outstanding $75 million preferred security, we do believe a significant portion of SNCR’s poor stock performance is simply the result of a risk-off fearful market. For the quarter, SNCR decreased our NAV by $0.27 per share, or $2.8 million.
•Quantum Corporation (QMCO): While we have successfully traded in and out of QMCO a couple times over the last couple years, we got caught this time. We have often spoken about how legitimate supply chain issues have negatively impacted QMCO. What started out primarily as an inability to secure enough parts for tape drive products sold to major hyperscalers, has expanded to almost every part needed to build out their server and storage products. The margin pressure was so severe in Q4 2021, QMCO announced they would need to seek a waiver from its lenders to avoid tripping debt covenants. We were stunned. The fact that QMCO is tripping debt covenants three years removed from cutting their debt in half, restoring the company from its accounting scandal, and posting revenue at $90+ million per quarter is, in our humble view, obscene. QMCO’s Board fell asleep at the wheel and QMCO’s management built a cost structure (e.g., R&D +$20-million-year over--year) for revenues and a margin profile that doesn’t exist today. It is our view that the weakness in QMCO has nothing to do with the stock market and everything to do with poor planning and execution by QMCO’s Board and management team. The company fell victim to a “if we build it, they will come” mentality. And they have destroyed their shareholder base in the process. As a result of these missteps, the company was forced to do a rights offering at a price that, because of the resulting dilution, has killed off the upside to our price targets.
We spoke about all of these issues last quarter. This is old news by now. This quarter, the company reported results for calendar Q1 2022 that were above guidance and analyst estimates. QMCO also finally announced cost-cutting measures as well as price increases for its products. Given the destruction of value over the last six months, that operating performance, combined with a much stronger balance sheet following the rights offering, should have been enough to stop the stock from continuing to fall. But it didn’t. This is an example of the market discounting the same news over and over and over and over again. It just never ends. And this quarter, the stock declined a staggering additional 37.4%. This last decline was unwarranted in our view. We will hold QMCO’s Board and management team accountable for restoring value and will ramp up our activism, which may include a proxy contest if we don’t believe the company is being run for its shareholders. With the rights offering, the company has only $30 million of net debt versus $160 million just three years ago and a set of new covenants that should provide ample breathing room. The company’s balance sheet is de-risked, but still trades at substantially less than 1x of revenue. We continue to believe there is the opportunity for material improvement in QMCO’s stock price from where it ended the quarter as we did last quarter from the rights offering price of $2.25. For the quarter, QMCO decreased our NAV by $0.22 per share, or $2.3 million.
•Alta Equipment Group, Inc. (ALTG): ALTG reported strong results for Q1 2022 and maintained its EBITDA guidance for 2022. That said, if the market believes the US economy is headed to an end of the world scenario, do investors want to own a dealership of construction and material handling equipment? The answer this quarter was a resounding no, and the stock declined by 27.4% in the quarter. We believe ALTG is an incredibly well-run business. Ryan Greenawalt (CEO), Tony Colucci (CFO), and their entire management team continue to post impressive results. In a short period of time since listing publicly at the beginning of 2020, ALTG crossed over $1 billion in annual revenue and over $100 million in annual EBITDA in 2021. We believe in the management team and their roll-up strategy of a fragmented industry. It could be easily argued that the stock is inexpensive at 5.4x times EV/EBITDA (ex-operating
leases). The question for us is not whether the company can execute, but instead do we really want to own this type of business in which you are continuously acquiring or replacing fixed assets. Something for us to contemplate, although, I will say, if the management team of ALTG ran every business we own, I could go on permanent vacation knowing our investments were being run by an alpha generating management team. ALTG reduced our NAV by $0.19 per share, or $1.9 million.
•comScore, Inc. (SCOR): By now you have seen the public letters we have sent to SCOR's Board highlighting our criticism of how it is governing the company. In case you haven’t read them, you can find them at the following links: https://ir.180degreecapital.com/press-releases/detail/365/180-degree-capital-corp-issues-open-letter-to-the-board and https://ir.180degreecapital.com/press-releases/detail/367/180-degree-capital-corp-issues-second-open-letter-to-the. SCOR decreased 29.2% this quarter. We surmise that part of this decline resulted from two factors: First, SCOR was removed from the Russell indices due to the decline in the market cap of the company. Second, the company made no progress in the quarter with the hiring of a new CEO. To our disappointment, SCOR also refused to address many of our recommended steps towards creating value for all shareholders. While the announcement of a new CEO didn’t occur last quarter, on July 6, we were pleased to see the appointment of Jon Carpenter as CEO. We have been impressed with him since he joined SCOR and believe he has the right focus and sense of urgency required to turn this company around. We were also particularly pleased to see Nana Banjeree appointed as Chair of the Board. SCOR’s Board has long suffered from ineffective leadership and change was needed.
Given SCOR’s improving financial performance and clarity on management, we currently believe SCOR’s share price is beyond absurd. While SCOR’s biggest competitor, NLSN, has stumbled from a fundamental perspective over the last two years, NLSN was still sold for 4x revenue. SCOR trades at less than 1x. It is incumbent upon SCOR’s Board to create value for all stakeholders in the company, including its common shareholders, and actually do the work that board members are required to do under Delaware law. To date, SCOR's Board has failed to create value. The appointees of SCOR’s Preferred Shareholders have failed to represent any shareholder other than the Preferred Shareholders. If needed, we will pursue further action through the Delaware courts. We will continue to press the company until the rights of the common shareholders are properly reflected in the decisions of SCOR’s Board. For the quarter, SCOR reduced our NAV by $0.15 per share, or $1.6 million.
•Potbelly Corporation (PBPB): Following consistently dreadful performance in PBPB’s comparable same store sales under the prior two management teams, PBPB has seen a resurgence under its current leadership, Robert Wright (former COO of Wendy’s) and Steve Cirulis (former SVP of Strategy at Panera Bread). PBPB reported continued strong results in Q1 2022 as its average unit volume (AUV) continued to improve, particularly in its central business district stores that were particularly hard hit by COVID-related issues. Bob, Steve and their colleagues are executing on what we believe to be an exciting long-term plan to strategically grow PBPB from 400 shops to 2,000 shops with improved operating metrics and overall financial performance. Investors appear to be waiting for the company to complete a meaningful re-franchise and/or franchise deal to prove that management’s strategy is viable. We believe PBPB’s stock can reach the mid-to-high teens if the company can post 10% EBITDA margins over the next three years. In the short term, as people return “back to the office”, we think some of PBPB’s urban locations (e.g., Chicago Business District, New York City, and Washington DC) should catch up to the growth of its suburban locations. We are of course mindful of escalating food and labor costs and will monitor those as 2022 unfolds. This is our top holding by weight as of the end of Q2 2022, and we are firm believers we have the chance to triple our money from the current stock price. For the quarter, PBPB reduced our NAV by $0.15 per share, or $1.6 million.
•Arena Group Holdings, Inc. (AREN): AREN reported strong results for Q1 2022 and continued to build momentum in building its business. During the quarter, AREN's stock traded at a value that enabled it to be included in the Russell indices beginning with the rebalance in June 2022. While normally we would consider this inclusion to be a positive event, confusion around the actual number of shares outstanding led to issues in determining the number of shares that should be bought by index funds to reach the target weights. While we are not certain this was the source of the pressure on the stock, the number of shares to be purchased changed, which would have led to certain index funds potentially having an overweight position in AREN. The forced selling coupled with the relatively illiquid trading of the stock could have been a material source of pressure on its trading price. It is amazing and hard to fathom how SCOR’s removal from the Russell was a negative event; while at the same time the inclusion of AREN into the Russell was also a negative event! That is the definition of a bear market. Additional sources of pressure could have come from concerns regarding the impact of a recession on the company’s advertising revenue. The end result was that AREN declined 16.9% in the quarter.
Putting aside these factors, we believe AREN, under the leadership of Ross Levinson, is executing very well as traffic and advertising across its many websites has been increasing at an accelerating rate. AREN recently stated on its
earnings call that it is currently at an inflection point where both inorganic and organic growth can occur without adding any meaningful cost along the way. We expect material increases in revenue, EBITDA, and free cash flow over the ensuing years. We believe in AREN’s strategy of rolling up digital assets and integrating them across a single platform; this should allow for better traffic across each individual site. While we are never pleased with owning stocks that cause our performance to suffer, in the case of AREN, we haven't invested in the company for a 20-30% return. We believe that over time, AREN can be a $500+ million market cap company, which would equate to a $30+ stock price at its current shares outstanding. We believe it’s the right company, with the right management team and a great strategy. It’s just a bad stock market combined with a potentially rough advertising environment. Time will tell if we are right. For the quarter, AREN reduced NAV by $0.14 per share, or $1.4 million.
We had one name that materially increased in value this quarter:
•Envela, Inc. (ELA): ELA has historically been an undisclosed position. ELA operates two business units: retail services and commercial services. ELA’s retail segment buys and sells jewelry and bullion products to individual consumers, dealers, and institutions in the United States. ELA's commercial segment provides solutions to businesses from across all industries seeking sustainable ways to reduce waste and protect their intellectual property and brand value. ELA started as a relatively small position due primarily to the fact that the company is majority owned and controlled by its CEO, John Loftus. That said, John has a history of creating value in related businesses, so we established a starter position in the company in prior quarters. We then began discussions on potential opportunities to reduce John’s ownership and strengthen the balance sheet for acquisitions, but those discussions have yet to result in an opportunity for 180 to materially increase its position in the company. For the quarter, ELA increased NAV by $0.05 per share, or $0.5 million.
Last quarter we disclosed that we had initiated a position in Intevac, Inc. (IVAC) following its sale of its photonics business for $70 million and the hiring of a new CEO, Nigel Hunton. It is our belief that Nigel was brought in to rationalize the cost structure following the sale of the photonics business and reposition its current thin-film processing business for growth and then its inevitable sale. In its Q1 2022 earnings call, IVAC’s management reiterated its expectation to end 2022 with at least $115 million, or $4.58 per share, in cash, assuming no in-year distributions or other return of capital. With the stock declining to nearly the net cash on its balance sheet, we believe the risk/reward of the investment is compelling. During Q2 2022, we continued to build our position this quarter and it is now nearly a 5% holding.
Lastly, we closed out our positions in ENZ and AFI during Q2 2022. While we discussed AFI in detail in our last shareholder letter, we wanted to communicate one last time on the company given how deplorable the management team was in operating this business.
•Armstrong Flooring, Inc. (AFI): As it turns out, AFI’s management team was one of the worst we have come across in our five-year history. Our original investment thesis was: 1. We believed the company would sell an office location for meaningfully more than the expectations for what it was worth; and 2. The company under its new management team would fix the operations of the business and materially improve its gross margins, EBITDA and cash flows. We were dead right on 1 and dead wrong on 2. When the company announced the sale of its South Gate California facility in March 2021 for $76.7 million, the stock rose 50% and we sold half our position. From that moment on, the company burned through an inordinate amount of cash, had its head in the sand regarding supply chain inflationary pressures, and was ill prepared from a cost perspective to deal with the current environment. We pressed the company immediately following the South Gate sale to adjust the cost structure of the business to deal with deteriorating margins, but they failed to do so. I have never seen a less energetic management team in total denial of reality. Not only did we find the CEO arrogant and dismissive (at one point he suggested to us that “even the consultants didn’t see this coming”), he and management fell victim to shifting of blame to external “outside of their control” forces. As last year unfolded, we became convinced that the potential for bankruptcy was much higher than our risk tolerance could tolerate, and essentially sold our entire position. Behind the scenes, we sent a letter to AFI’s Board suggesting they seek alternative options for creating value for shareholders. The company announced they would do so at the end of 2021. We exited the remainder of our small position in early Q2 2022, well before AFI announced it was likely to, and ultimately did, file for Chapter 11 bankruptcy protection.
We will call AFI a bad investment. That said, because of our attention to paying “the right price” for the business from the outset and our sell discipline for exiting stories when the reasons for ownership are no longer valid, and we contained the loss to approximately 12%. Our average sale price of $3.63 per share versus our average cost basis of $3.97 per share looks a lot better than what ended up being a near zero for the common equity. We have talked about this many times in our letters. We aren’t “right” fighters with regards to our holdings; rather we are only interested in
preserving capital when our rationale for why we own individual companies changes for the negative. Going forward, we will use AFI as an example of how not to run a company.
All in all, it was a rough quarter for our public holdings. We believe we have gotten to the point where many names in our universe are overly discounted (based on their valuations) relative to the very bearish environment we are in. Our permanent capital allows us to make rational decisions on our investments, and we believe this is a distinct advantage in regard to our ability to generate returns greater than the indices. We are never forced to sell unless we believe we should for analytical and investment process reasons. We have seen the benefits of having permanent capital during other periods of market dislocation during our five-year history, and we expect this period will be no different. Like the other weak periods of performance during the last five years, we hope to look back at this one and reflect that while it was painful wading through it, we were presented with some interesting investment opportunities that we believe have at least 100% upside.
LEGACY PRIVATE PORTFOLIO
Despite the poor performance of our public holdings, in 2022 we finally received very important and positive news from a few of our private holdings. Since the end of 2021, we have made three announcements, with two in particular that we believe are very significant.
First, we sold our rights to potential future milestone payments that we had received from the acquisition of Petra Pharma Corporation by Eli Lilly and Company for $12.3 million in cash, or $1.19 per share. We received these funds on May 18, 2022. Finally, although not as meaningful as Petra Pharma, we noted that TARA Biosystems, Inc. has been acquired by Valo Health, LLC. Under the terms of the acquisition, 180 will receive approximately $2.7 million in cash over the next 24 months and has the potential to receive an additional $3.3 million upon achievement of certain milestones. We received our upfront payment in early April 2022 and the next payment of approximately $275,000 is expected in early December 2022.
Secondly, and importantly, D-Wave Systems announced its intent to become a publicly traded company through a merger with DPCM Capital, Inc., (XPOA), a special purpose acquisition company. During Q2 2022, D-Wave and XPOA made material progress toward completion of this merger including securing additional financing and waiving of certain closing conditions by each company. D-Wave and XPOA received clearance from the SEC in July 2022 and the merger closed on August 5, 2022. 180 holds approximately 900,000 shares of common stock of the merged company that now trades under the symbol QBTS. While this is clearly an important milestone for D-Wave and our efforts to monetize our legacy private portfolio, it is important to note that 180 cannot trade its shares of D-Wave immediately. The shares of newly public D-Wave owned by 180 are subject to restrictions from trading until a registration statement is filed and deemed effective by the SEC and the expiration of a lockup period that will last four-to-six months from the date of the business combination depending on trading of the stock post-merger.
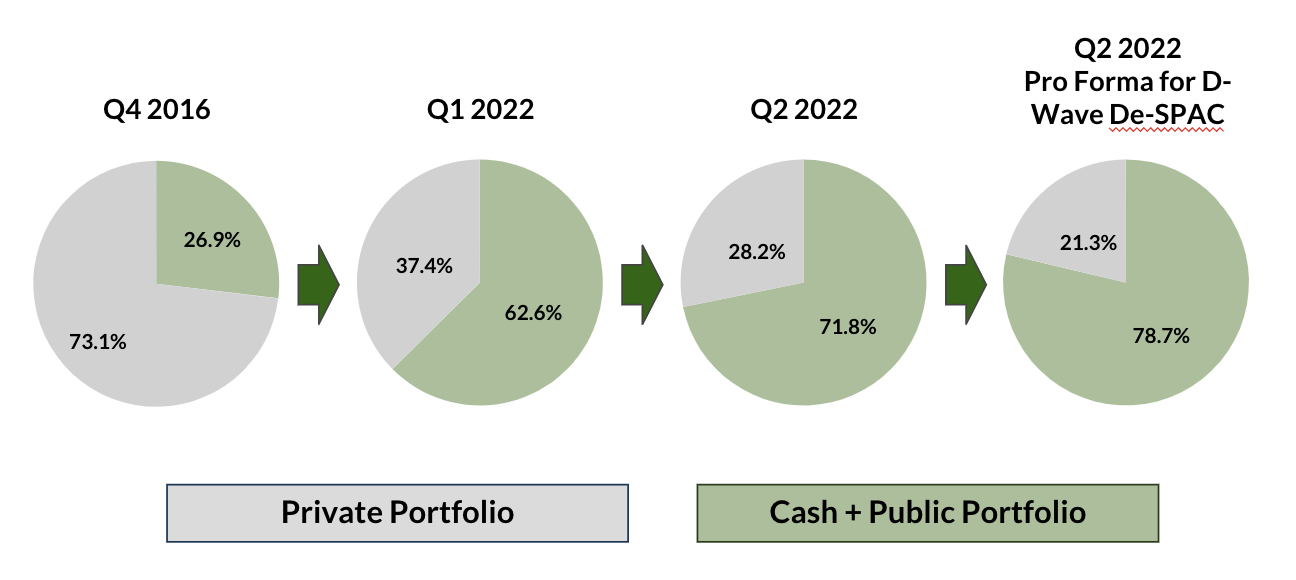
We have already transformed our business over the last five years away from the historical venture capital model and towards public and public related securities. These three announcements have supercharged that transformation. 180’s remaining private portfolio has only one material position, AgBiome, LLC, following these monetizations, and approximately 83% of our pro forma cash and investment assets are in cash and public and related securities. We believe this progress should enable us to narrow the discount at which our stock trades to our NAV.
* D-Wave valuation based on 180’s carrying value as of June 30, 2022.
This milestone was a transformation that started in June 2016, when I first joined the Board of Directors. At that time, our predecessor company’s balance sheet was comprised of 79% private assets and 21% net cash and public securities. Today, following the events in Q2 2022 and the public listing of D-Wave Systems, we are in a completely different place. Because of the greater transparency in the value of our holdings, it would make sense to us that our stock should narrow the discount it trades to our NAV. When we first took over the management of 180, we were very clear about what we hoped to accomplish, and I am pleased to report we have executed that strategy to the benefit of our shareholders.
With regard to the remaining legacy private portfolio, it decreased NAV by $0.12 per share, or $1.3 million. The largest contributors to this decline in value changes came from Phylagen (business risk), Echopixel (business risk), and Nanosys (financing terms).
EXPENSES
As noted in previous letters, we have dramatically reduced our cost structure under our new strategy. In 2016, before our Fund’s change in investment focus and management team, our operating expenses, excluding stock-based compensation and interest on outstanding debt, averaged approximately $1.3 million per quarter. For Q2 2022 our regular operating expenses equaled approximately $741,000. Based on the performance during the quarter, this amount includes the reversal of an accrual for certain deferred bonus amounts from 2020 in the amount of approximately $80,000. This amount, or a portion of it, could be reinstated in future quarters depending on performance and at the discretion of the Compensation Committee of our Board. We will maintain a lean cost structure (outside of fixed expenses for being a public company) focusing our expenses on activities solely designed to enhance our investment performance or to increase our revenues from managing outside capital. As has been the case since my arrival, the management team will only participate in a bonus pool if our performance warrants it. Our performance for 2022 to date doesn’t warrant a bonus pool.
TURN/NAV: SUM OF THE PARTS
As of the end of Q2 2022, TURN traded at 73% of NAV. Our securities of publicly traded and related companies, cash, and other assets net of liabilities were $5.98 per share. Our stock price was $6.13. If we receive 100% credit for the value of these assets net of liabilities, the market is ascribing a value of approximately $0.15 per share, or $1.6 million, to our private portfolio. Given our private assets are valued at approximately $24.6 million, the market is discounting the value of our legacy private portfolio assets by approximately 94% as of the end of Q2 2022. Again, this analysis has D-Wave in the legacy private portfolio. If you include the carrying value of D-Wave as of June 30, 2022, in our public and related portfolio holdings, our remaining legacy private portfolio companies have negative implied value. This negative implied value includes approximately $2.6 million we are contractually due over the ensuing 1.75 years from the sale of TARA Biosystems to Valo.
At the end of the day, the legacy private portfolio, other than AgBiome, is currently irrelevant to our future success. Given how painful the market has been in 2022, we think the current construct of our balance sheet has provided a true floor for our share price. While none of 2022 has been fun, had 2017-2021 not occurred our share price would be nowhere near where it is trading today.
CONCLUSION
We had a very similar Q2 2022 versus Q1 2022, although this quarter our performance was in line with the Russell Benchmark (not that I care). It is important to remain focused, disciplined, agnostic, and emotionless during periods like we are living through. The good news for us, as I have said countless times, is that TURN has permanent capital. Nobody can take the money away from our shareholders. The second thing we have going for us is that we use activism as part of our Graham and Dodd value process to enhance our ability to improve our investment results. We will use our activism to ensure that the management teams and boards of the company’s we own are working for every constituent, not just themselves.
I read a lot, am a student of history, and always try to learn and make sense of where we are and where we are going. Remember one of the white papers we wrote this year reflected our views:
Reasons for Hope in a World of Bad News
It's extremely difficult to watch the news and not feel overwhelmed by the avalanche of negative headlines. Some of them, such as the war in Ukraine, are heartbreakingly negative, outright terrifying, and tragic. Others such as inflation, the corresponding looming Fed hikes and extreme volatility are clearly linked, but, at the same time, add to the sense of gloom that pervades the current US equity markets.
Despite this glut of negativity that we see playing out on television each day, are there reasons to be constructive on market performance for the remainder of 2022? Believe it or not, we believe there are.
Let’s start with the on-going war in Ukraine. Clearly what is happening there is a human tragedy on a level that is hard to find adequate words for. Further, it’s clear that it has had a negative effect on the market for a litany of reasons. Setting aside the incredible human cost, what effects are likely to impact the market for the remainder of 2022? We will not pontificate on how we see this ending other than to say it feels like a poorly planned miscalculation on the part of Putin. We would feel arrogant attempting to claim we know how this will end, particularly when Putin seems to be relying less on calculated precise strategy and more on pure emotion. While this event is casting a scary pall over the market, it is not the first nor the last “bad news” event that in the moment feels like a headwind that can never be overcome. We aren’t suggesting any of the below events carry the same magnitude as today's current events, but, for example, if you flashback to March of 2020 at the onset of the Pandemic, was the market convinced at that time that the market would be materially higher over the next 18 months? No. Circumstances change and markets evolve.
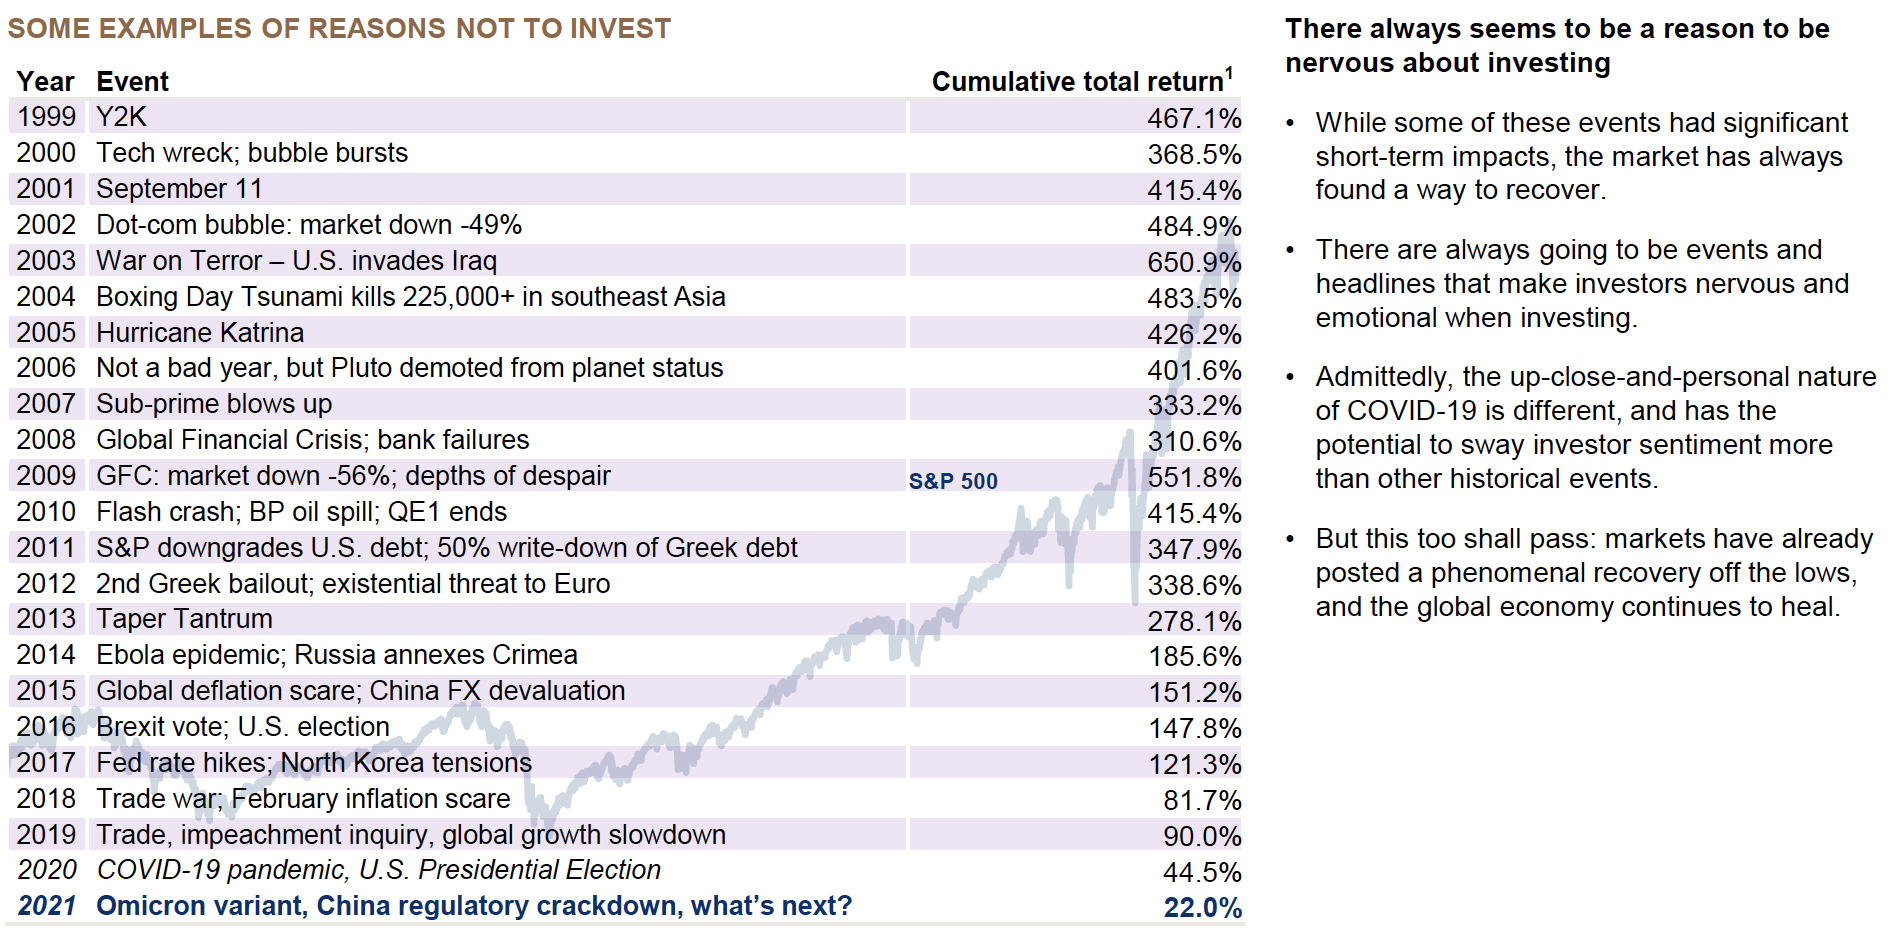
Sources: J.P. Morgan Private Bank. FactSet. [1] Cumulative total returns for S&P 500 are calculated from December 31 of the year prior until January 31, 2022.
Clearly, each of these headwinds were unique, but the point is that it seems reasonable that the current war alone should not be enough to keep the market negative. We have priced in quite a bearish scenario as we look at individual companies from a valuation perspective.
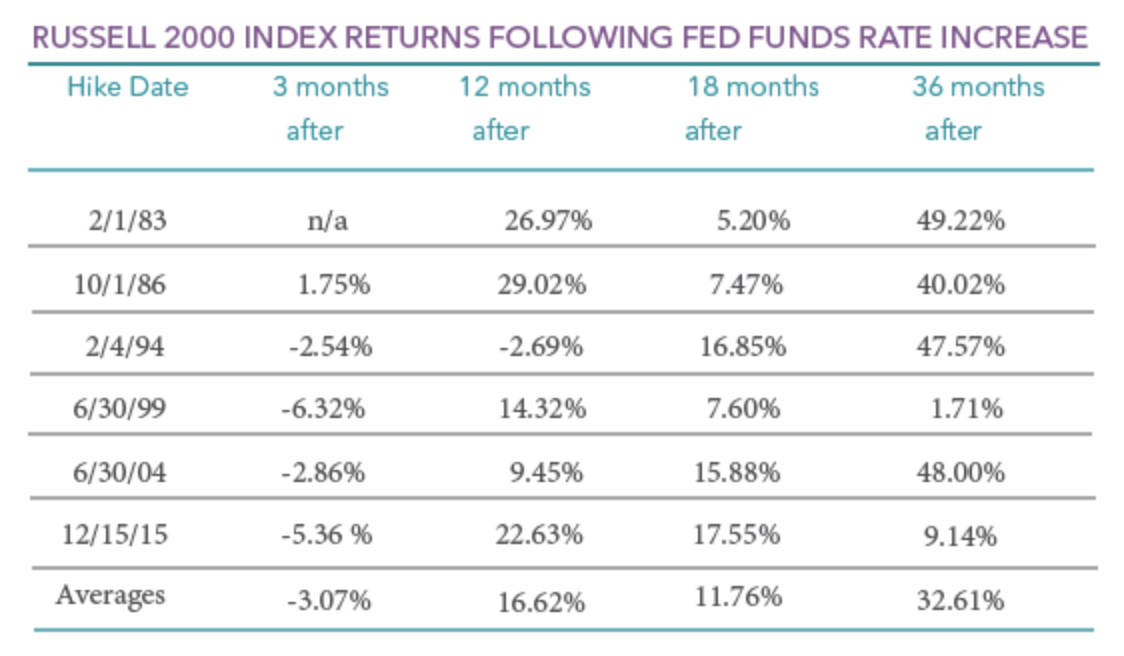
What about inflation and the corresponding rate hikes? The CPI release on March 10, 2022, was just the most recent data point reflecting high inflation and the necessity for rate hikes (with the first 25 basis points of tightening occurring on 3/16). Our last piece from February 2022 that can be found at https://secureservercdn.net/198.71.233.29/h7s.91a.myftpupload.com/wp-content/uploads/2022/02/Inflation-impact-on-small-caps-Feb-2022.pdf made the strong case that small cap equities had historically experienced strong performance following the first Fed rate hike in a cycle. The chart below, which we included in that piece makes a strong case for the potential for positive market performance of small cap stocks over the rest of 2022 despite the looming rate hikes.
Source: Perritt Capital Management
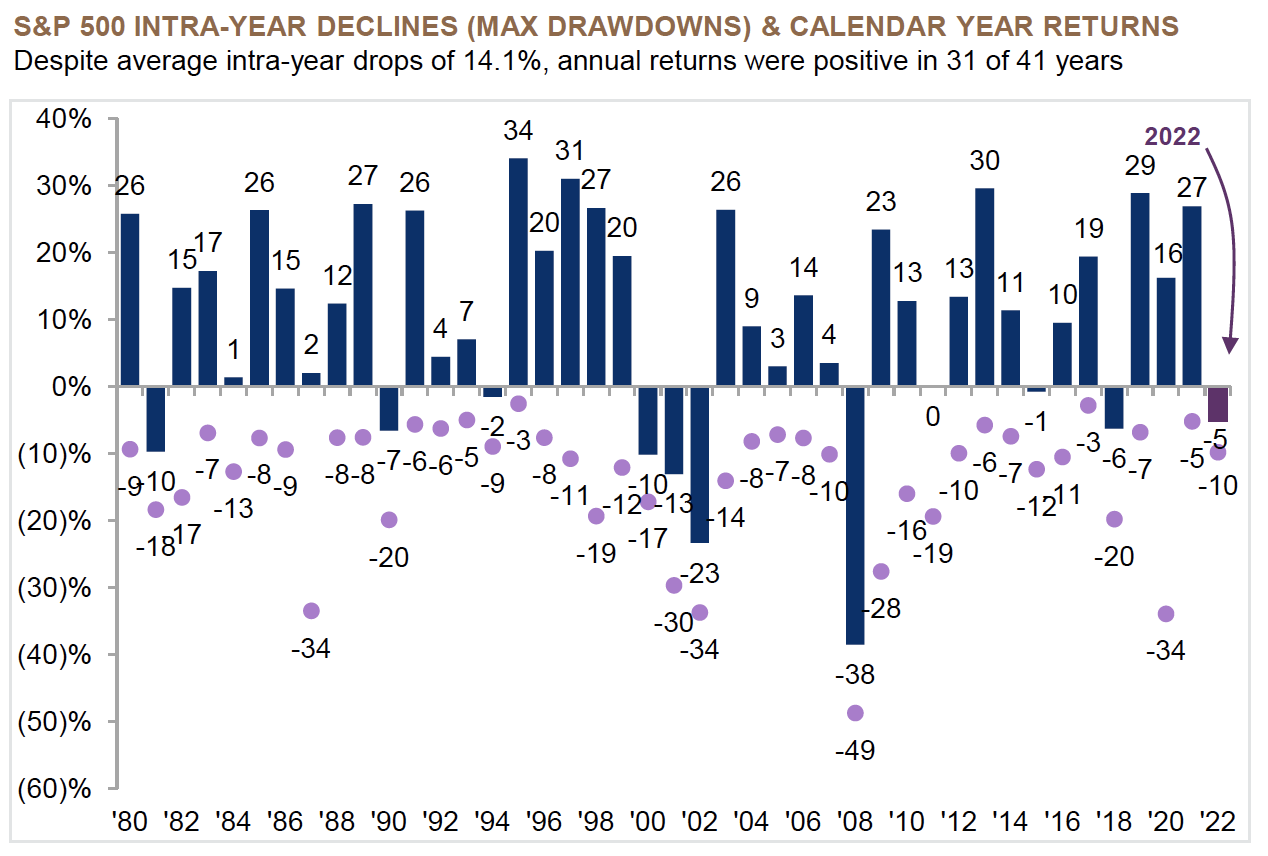
Not surprisingly, war and inflation lead to high volatility. This is to be expected. However, historically this kind of volatility has both presented buying opportunities and has not normally resulted in negative annual returns for the US equity markets. As the chart below shows, despite average peak to trough drops of 14.1%, the market has had a positive annual return in 31 of 41 years.
Sources: FactSet, Standard & Poor’s, J.P. Morgan Asset Management - Guide to the Markets. Returns are based on price index only and do not include dividends. Intra-year drops refer to the largest market drops from a peak to a trough during the year. For illustrative purposes only. Returns shown are calendar year returns from 1980 to present year. Data is as of January 31, 2022. It is not possible to invest directly in an index. Analysis is based on the J.P. Morgan Guide to the Markets – Principles for Successful Long-term Investing.
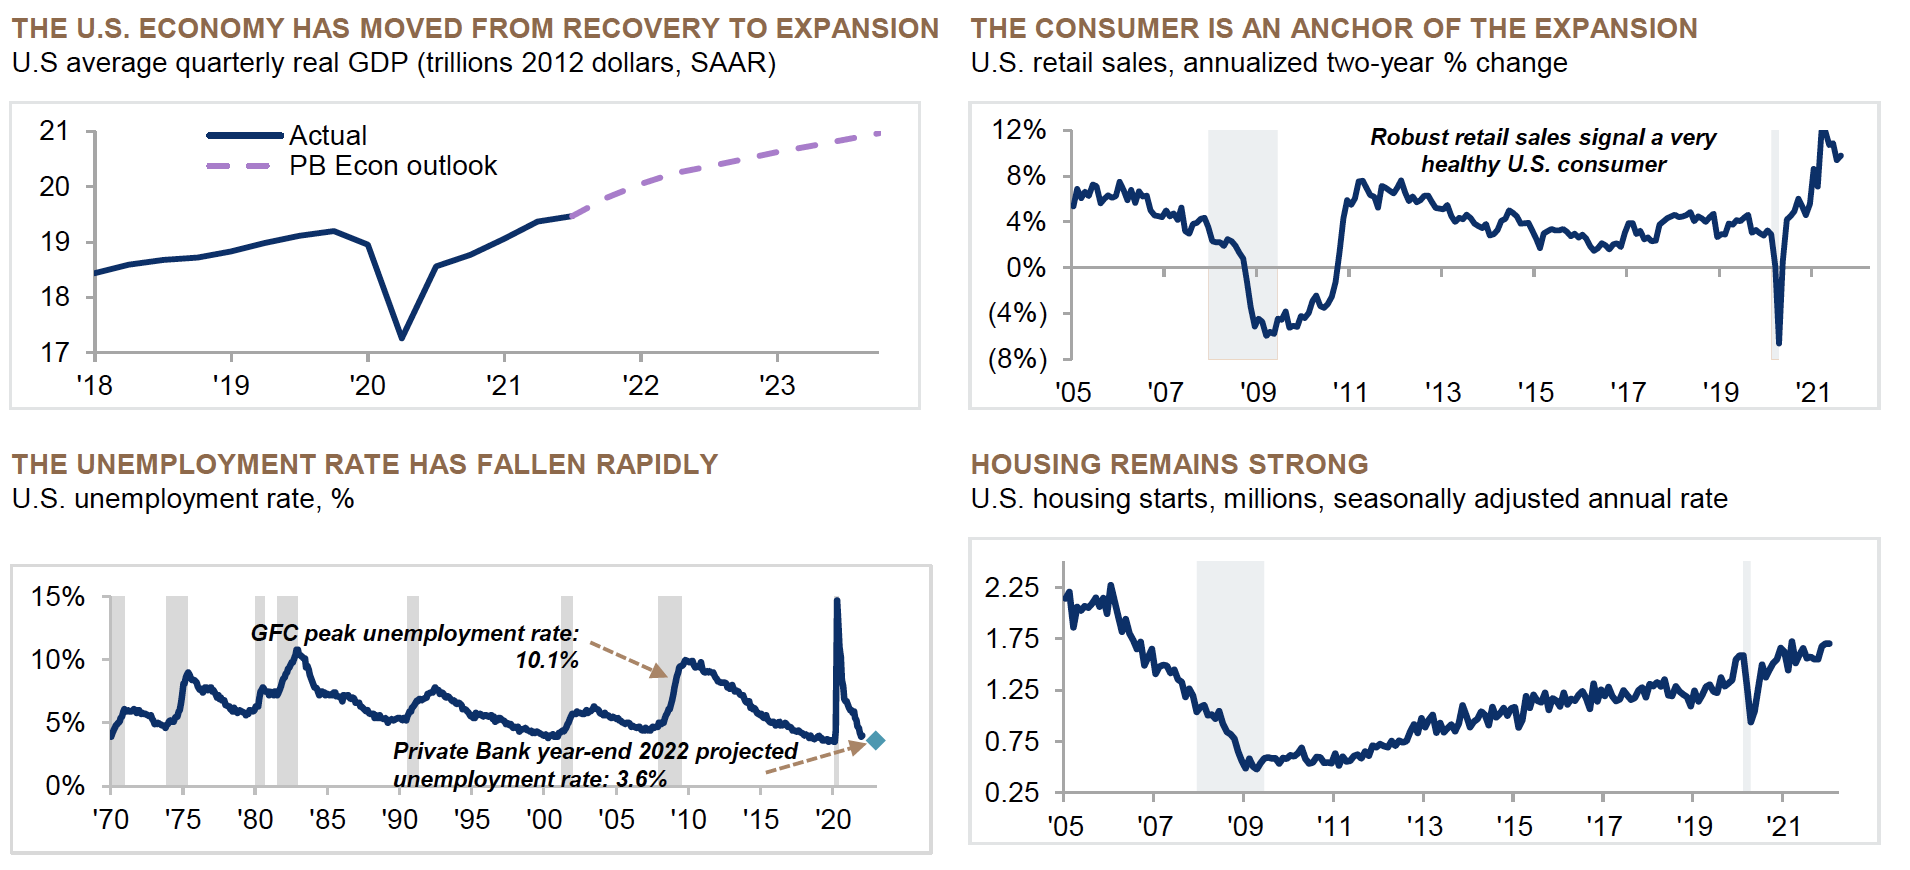
By far, the most fundamental reason to maintain a positive outlook on US equities for the remainder of 2022 is that the US economy remains strong and is expected to grow, and a strong US economy means continued earnings growth.
Sources: (Top left) Macroeconomic Advisers, Bloomberg Finance L.P, J.P. Morgan Private Bank. Data is as of November 30, 2021. Note: Actual GDP extended through September using Fed Weekly Economic Index. (Bottom left) Bureau of Labor Statistics, NBER, Haver Analytics. Data is as of January 31, 2022. (Top right) U.S. Census Bureau, NBER, Haver Analytics.
Data is as of January 31, 2022. (Bottom right) U.S. Census Bureau, NBER, Bloomberg Finance L.P. Data is as of January 31, 2022.
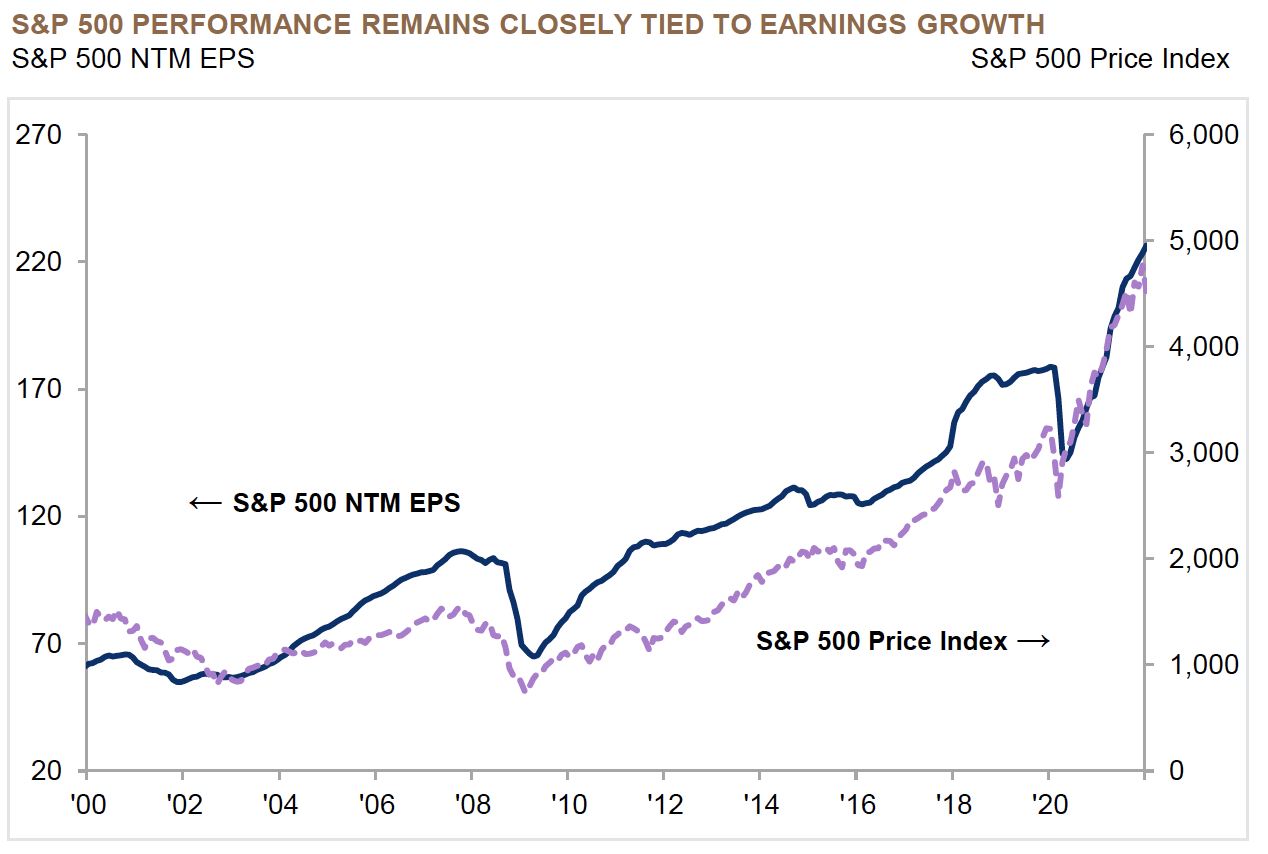
Further, all of the above negative factors should ultimately be overwhelmed by strong earnings growth, which currently most analysts believe that we will continue to see. Investing in companies that are able to navigate through these myriad issues and grow their earnings has historically been a winning formula.
Sources: Standard & Poor’s, FactSet, J.P. Morgan Asset Management. Data as of January 31, 2022. S&P 500 NTM EPS refers to analyst estimates for S&P 500 earnings over the next 12 months.
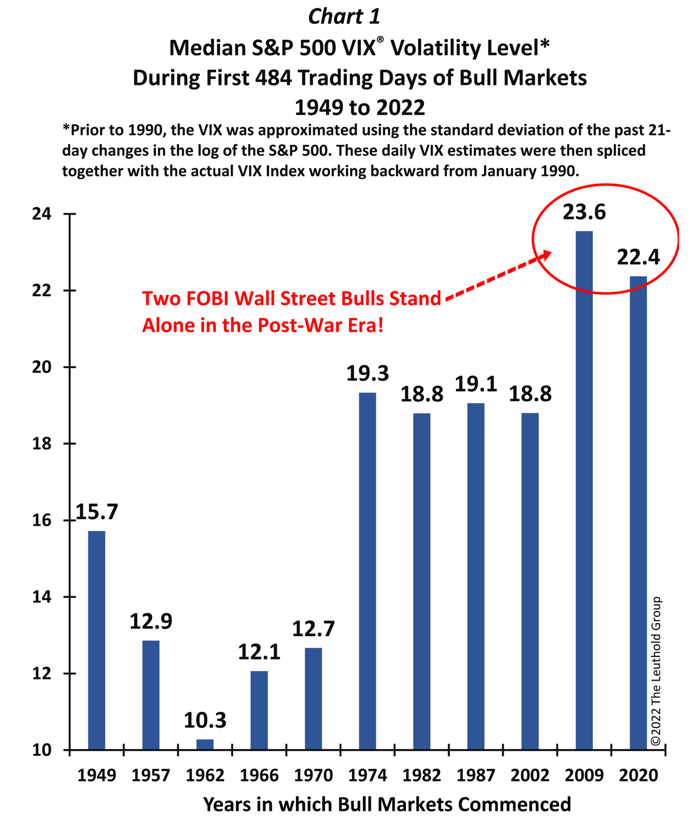
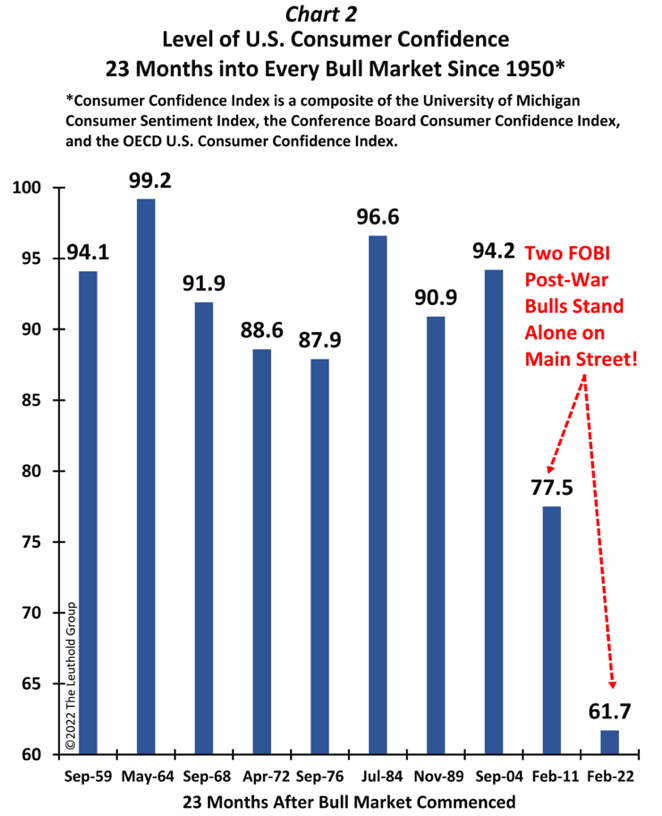
One final reason that we see for optimism around the US equity market is actually somewhat counterintuitive. The two charts below show the VIX and consumer confidence during various bull markets over the years. As you can see, volatility, as measured by the VIX, is extremely high despite the bull market that US equity markets have been experiencing. This suggests that despite the run up in the market, many investors have trepidations. Further, consumer confidence is as low as it has been during a bull market—another indication of underlying concern. This suggests to us that despite the strong upward move in the market since 2020, there has remained a constant fear amongst investors. We believe this fear has caused the market to sell very quickly on any hint of bad news, but further, and importantly, it has likely provided a floor to market sell offs as nervous investors have likely already taken steps to manage downside risk given the jitters that the charts below imply they are experiencing.
Source: The Leuthold Group
We will agnostically and objectively analyze our performance and report on it to you. Fortunately, at 180, we have had significantly more outperforming quarters versus underperforming ones, and, as a result, our funds have had great runs of performance. One of the many lessons I learned along the way is that a quarter’s return doesn’t matter. Good or bad. Go back and read our shareholder letter from a quarter when we significantly outperformed. What relevance did that letter have to this quarter’s performance? None. What does this past quarter’s performance say about how we are going to perform over the next year? Nothing. You have to have the right temperament to be a money manager and the appropriate amount of perspective.
Now don’t take that the wrong way. For anyone that knows us, they know we care about every last tick of every stock we own every day of the week. We have an intensity for getting it right every day and not being blinded by “only focusing on the long term.” I personally own 500,000 shares of TURN bought with after-tax dollars of my own money. I care. Daniel owns over 200,000 shares, most of which he purchased with after-tax dollars of his own money. He cares. We and other members of our team continue to buy TURN stock each and every quarter. But, if you ask me the relevance of performance in any one quarter, I will tell you it isn’t that relevant to the big picture because we have permanent capital. The big story for us is we took $16 million of cash and public assets in the middle of 2016 and turned that into $68.7 million on a pro forma basis. This environment might ultimately be the catalyst that will allow us to go from where we are to $200 million over the next four years.
In 2022, investors are fixated on the inflationary and disrupted supply chain environment that is likely to lead to higher interest rates and the potential for slower growth, stagflation and a recession. COVID-19 never seems to go away, and now we have Russia’s ongoing invasion of Ukraine. All of these factors have caused dislocations in the markets and dramatic declines in equity indices. Put simply, it is a market filled with fear. The inflationary supply chain issues are real and are providing a serious headwind for the market and the economy. The Russian invasion of Ukraine has been a depressing humanitarian tragedy coupled with the potential for supply chain issues of food and energy. The markets are presently experiencing extreme volatility and vicious selling. Despite this glut of negativity that we see playing out on television each day, are there reasons to be constructive on market performance for the remainder of 2022? Believe it or not, we believe there are.
Let’s start with the on-going war in Ukraine. Clearly what is happening there is a human tragedy on a level that is hard to find adequate words for. Further, it’s clear that it has had a negative effect on the market for a litany of reasons. Setting aside the incredible human cost, what effects are likely to impact the market for the remainder of 2022? We will not pontificate on how we see this ending other than to say it feels like a poorly planned miscalculation on the part of Putin. We would feel arrogant attempting to claim we know how this will end, particularly when Putin seems to be relying less on calculated precise strategy and more on pure emotion. While this event is casting a scary pall over the market, it is not the first nor the last “bad news” event that in the moment feels like a headwind that can never be overcome. We aren’t suggesting any of the below events carry
the same magnitude as today's current events, but, for example, if you flashback to March of 2020 at the onset of the pandemic, was the market convinced at that time that the market would be materially higher over the next 18 months? No. Circumstances change and markets evolve.
Clearly, each of these headwinds were unique, but the point is that it seems reasonable that the current war alone should not be enough to keep the market negative. We have priced in quite a bearish scenario as we look at individual companies from a valuation perspective.
While it is never fun to live through nasty selloffs, we need washouts like the one we are currently experiencing to find the stocks that offer enormous upside. We intentionally run a concentrated portfolio of small cap companies. Way more often than not, our shareholders have seen the benefit of that strategy by benefiting when we get our stock picking right. Of course, with the upside potential comes periods like we are in where you see the risk of managing a concentrated portfolio. The market for microcaps is filled with inefficiencies and asymmetric risk/reward characteristics. If you get your stock picking right, you can achieve outsized returns. Based on our research, we believe many of the individual companies we own have upside of 100% over a three-year period. We have permanent capital and the opportunity to take advantage of the current dislocation is easier for us because we don’t have to sell to service redemptions. We are here for the long haul, we are going to make rational objective decisions, and we are going to use our activist approach when the situation calls for it. One thing I know is, it isn't easy and this hasn’t been fun. But don’t look for someone to tell you “It's ok to invest again, you have the all clear” as they are ringing a bell declaring today to be the bottom. I also have never run away from a challenge and despite getting repeatedly punched in the face by Mike Tyson, I can promise you we will be back for more tomorrow. And the day after. And the day after that. We look forward to reviewing our subsequent quarters as the year unfolds. It's time to get back on the roller coaster.
Thank you for your continued support.
Kevin Rendino
Chairman and Chief Executive Officer
Forward-Looking Statements and Disclaimers
This shareholder letter may contain statements of a forward-looking nature relating to future events. These forward-looking statements are subject to the inherent uncertainties in predicting future results and conditions. These statements reflect the Company's current beliefs, and a number of important factors could cause actual results to differ materially from those expressed in this press release. Please see the Company's securities filings filed with the Securities and Exchange Commission for a more detailed discussion of the risks and uncertainties associated with the Company's business and other significant factors that could affect the Company's actual results. Except as otherwise required by Federal securities laws, the Company undertakes no obligation to update or revise these forward-looking statements to reflect new events or uncertainties. The reference and link to any websites have been provided as a convenience, and the information contained on such website is not incorporated by reference into this shareholder letter. 180 Degree Capital Corp. is not responsible for the contents of third-party websites. The information discussed above is solely the opinion of 180 Degree Capital Corp. Any discussion of past performance is not an indication of future results. Investing in financial markets involves a substantial degree of risk. Investors must be able to withstand a total loss of their investment. The information herein is believed to be reliable and has been obtained from sources believed to be reliable, but no representation or warranty is made, expressed or implied, with respect to the fairness, correctness, accuracy, reasonableness or completeness of the information and opinions.
| | |
180 DEGREE CAPITAL CORP.
CONSOLIDATED STATEMENT OF ASSETS AND LIABILITIES (UNAUDITED) |
| | | | | |
| | June 30, 2022 |
| ASSETS | |
| Investments in securities and other financial instruments, at value: | |
| Unaffiliated publicly traded equity and equity-related securities (cost: $33,433,748) | $ | 27,175,207 | |
| Unaffiliated legacy privately held equity and equity-related securities (cost: $12,886,349) | 20,290,917 | |
| Non-controlled affiliated publicly traded equity and equity-related securities (cost: $28,119,487) | 21,443,194 | |
| Non-controlled affiliated legacy privately held equity and equity-related securities (cost: $6,496,930) | 1,046,648 | |
| Controlled affiliated equity and equity-related securities (cost: $2,880,646) | 5,970,633 | |
| Unaffiliated derivative securities (cost: $149,042) | 0 | |
| Non-controlled affiliated derivative securities (cost: $224,849) | 232,632 | |
| Unaffiliated rights to payments (cost: $3,561,459) | 3,290,766 | |
| Cash | 8,004,055 | |
| Prepaid expenses | 183,743 | |
| Receivable from managed funds | 152,151 | |
| Receivable from securities sold | 78 | |
| Lease-asset | 91,094 | |
| Other receivables | 10,367 | |
| Other assets | 22,259 | |
| Total assets | $ | 87,913,744 | |
| LIABILITIES & NET ASSETS | |
| |
| Post-retirement plan liabilities | $ | 807,166 | |
| Accounts payable and accrued liabilities | 293,004 | |
| Lease obligation | 91,094 | |
| Payable for securities purchased | 77,964 | |
| Total liabilities | $ | 1,269,228 | |
| Commitments and contingencies (Note 10) | |
| Net assets | $ | 86,644,516 | |
| Net assets are comprised of: | |
| Preferred stock, $0.10 par value, 2,000,000 shares authorized; none issued | $ | 0 | |
| Common stock, $0.03 par value, 15,000,000 shares authorized; 11,541,079 issued | 334,594 | |
| Additional paid in capital | 118,997,664 | |
| Total accumulated distributable loss | (28,082,217) | |
| Treasury stock, at cost 1,167,259 shares | (4,605,525) | |
| Net assets | $ | 86,644,516 | |
| Shares outstanding | 10,373,820 | |
| Net asset value per outstanding share | $ | 8.35 | |
The accompanying notes are an integral part of these unaudited consolidated financial statements.
21
| | |
180 DEGREE CAPITAL CORP.
CONSOLIDATED STATEMENT OF OPERATIONS (UNAUDITED) |
| | | | | |
| Six Months Ended
June 30, 2022 |
| Income: | |
| Other (Note 2) | $ | 202,077 | |
| Dividend | 11,579 | |
| Total income | 213,656 | |
| Operating fees and expenses: | |
| Professional | 304,585 | |
| Administration and operations | 246,727 | |
| Salaries, bonus and benefits | 236,219 | |
| Insurance | 169,984 | |
| Directors | 143,750 | |
| Custody | 16,400 | |
| Rent | 14,872 | |
| Other | 4,591 | |
| Total operating expenses | 1,137,128 | |
| Net investment loss before income tax expense | (923,472) | |
| Income tax expense | 3,163 | |
| Net investment loss | (926,635) | |
| Net realized gain (loss) from investments: | |
| Unaffiliated publicly traded equity and equity-related securities | 1,096,833 | |
| Unaffiliated legacy privately held equity and equity-related securities | 5,990,170 | |
| Non-controlled affiliated publicly traded equity and equity-related securities | (9,846) | |
| Non-controlled affiliated legacy privately held equity and equity-related securities | (2,365,432) | |
| Call options | 35,909 | |
| Net realized gain from investments | 4,747,634 | |
| Transferred shares-value | (196,290) | |
| Net realized gain | 4,551,344 | |
| Change in unrealized (depreciation) appreciation on investments: | |
| Unaffiliated publicly traded equity and equity-related securities | (15,533,242) | |
| Unaffiliated legacy privately held equity and equity-related securities | (1,405,139) | |
| Non-controlled affiliated publicly traded equity and equity-related securities | (9,508,569) | |
| Non-controlled affiliated legacy privately held equity and equity-related securities | 1,216,889 | |
| Controlled affiliated equity and equity-related securities | (912,067) | |
| Unaffiliated rights to payments | (1,414,017) | |
| Net change in unrealized depreciation on investments | (27,556,145) | |
| Net realized gain and change in unrealized depreciation on investments | (23,004,801) | |
| Net decrease in net assets resulting from operations | $ | (23,931,436) | |
The accompanying notes are an integral part of these unaudited consolidated financial statements.
22
| | |
180 DEGREE CAPITAL CORP.
CONSOLIDATED STATEMENT OF CASH FLOWS (UNAUDITED) |
| | | | | |
| Six Months Ended
June 30, 2022 |
| Cash flows provided by operating activities: | |
| Net decrease in net assets resulting from operations | $ | (23,931,436) | |
| Adjustments to reconcile net decrease in net assets resulting from operations to net cash provided by operating activities: |
| Net realized gain from investments | (4,551,344) | |
| Net change in unrealized depreciation on investments | 27,556,145 | |
| Depreciation of fixed assets | 4,483 | |
| Other income-non-cash | (1,094,014) | |
| Call options purchased | (174,765) | |
| Call options written | 210,674 | |
| Purchase of unaffiliated publicly traded equity and equity-related securities | (13,331,218) | |
| Purchase of non-controlled affiliated publicly traded equity and equity-related securities | (1,697,908) | |
| Purchase of controlled affiliated equity and equity-related securities | (50,000) | |
| Proceeds from sale of unaffiliated publicly traded equity and equity-related securities | 8,748,031 | |
| Proceeds from sale of non-controlled affiliated publicly traded and equity-related securities | 16,763 | |
| Proceeds from sale of non-controlled affiliated legacy privately held equity and equity-related securities | 67,641 | |
| Distribution from sale of unaffiliated rights to payments | 12,310,608 | |
| Changes in assets and liabilities: | |
| Decrease in receivable from managed funds | 2,167,107 | |
| Decrease in receivable from portfolio securities | 891,937 | |
| Decrease in prepaid expenses | 168,922 | |
| Decrease in receivable from sales of securities | 73,081 | |
| Increase in other receivables | (240) | |
| Decrease in other assets | 113 | |
| Decrease in bonus payable | (3,281,875) | |
| Decrease in post-retirement plan liabilities | (17,724) | |
| Decrease in accounts payable and accrued liabilities | (207,572) | |
| Decrease in accrued severance | (34,024) | |
| Increase in payable for securities purchased | 2,994 | |
| Net cash provided by operating activities | 3,846,379 | |
| Net increase in cash | 3,846,379 | |
| Cash at beginning of the period | 4,157,676 | |
| Cash at end of the period | $ | 8,004,055 | |
| Supplemental disclosures of cash flow information: | |
| Income taxes paid | $ | 3,163 | |
| |
The accompanying notes are an integral part of these unaudited consolidated financial statements.
23
| | |
180 DEGREE CAPITAL CORP.
CONSOLIDATED STATEMENTS OF CHANGES IN NET ASSETS |
| | | | | | | | | | | |
| Six Months Ended
June 30, 2022 | | Year Ended December 31, 2021 |
| (UNAUDITED) | | |
| Changes in net assets from operations: | | | |
| Net investment loss | $ | (926,635) | | | $ | (3,486,628) | |
| Net realized gain | 4,551,344 | | | 2,091,597 | |
| Net change in unrealized (depreciation) appreciation on investments | (27,556,145) | | | 15,653,189 | |
| Net (decrease) increase in net assets resulting from operations | (23,931,436) | | | 14,258,158 | |
| Net (decrease) increase in net assets | (23,931,436) | | | 14,258,158 | |
| Net Assets: | | | |
| Beginning of the period/year | 110,575,952 | | | 96,317,794 | |
| End of the period/year | $ | 86,644,516 | | | $ | 110,575,952 | |
| | | |
The accompanying notes are an integral part of these unaudited consolidated financial statements.
24
| | |
180 DEGREE CAPITAL CORP.
CONSOLIDATED FINANCIAL HIGHLIGHTS |
| | | | | | | | | | | | | | | | | | | | | | | | | | | | | | | | | | | | | | |
| Six Months Ended Jun. 30, 2022 | | Year Ended Dec. 31, 2021 | | Year Ended Dec. 31 2020# | | Year Ended Dec. 31 2019# | | Year Ended Dec. 31, 2018# | | Year Ended Dec. 31, 2017# | |
| (UNAUDITED) | | | | | | | | | | | |
| Per Share Operating Performance: | | | | | | | | | | | | |
| Net asset value per share, beginning of the period/year | $ | 10.66 | | | $ | 9.28 | | | $ | 9.18 | | | $ | 7.92 | | | $ | 7.80 | | | $ | 7.02 | | |
Net investment loss* | (0.09) | | | (0.33) | | | (0.05) | | | (0.48) | | | (0.21) | | | (0.36) | | |
Net realized gain (loss) from investments* | 0.44 | | | 0.20 | | | (0.11) | | | 0.93 | | | (0.75) | | | (1.14) | | |
Net change in unrealized (depreciation) appreciation on investments and options*1 | (2.66) | | | 1.51 | | | 0.26 | | | 0.81 | | | 1.08 | | | 2.40 | | |
Share of loss on equity method investment*2 | 0.00 | | | 0.00 | | | 0.00 | | | 0.00 | | | 0.00 | | | 0.00 | | |
| Total* | (2.31) | | | 1.38 | | | 0.10 | | | 1.26 | | | 0.12 | | | 0.90 | | |
Net decrease as a result of stock-based compensation expense*2 | 0.00 | | | 0.00 | | | 0.00 | | | 0.00 | | | 0.00 | | | (0.03) | | |
Net decrease as a result of acquisition of vested restricted stock awards related to employee withholding2 | 0.00 | | | 0.00 | | | 0.00 | | | 0.00 | | | 0.00 | | | (0.06) | | |
| Total decrease from capital stock transactions | 0.00 | | | 0.00 | | | 0.00 | | | 0.00 | | | 0.00 | | | (0.09) | | |
Net decrease as a result of other comprehensive (loss) income*2 | 0.00 | | | 0.00 | | | 0.00 | | | 0.00 | | | 0.00 | | | (0.03) | | |
| Net (decrease) increase in net asset value | (2.31) | | | 1.38 | | | 0.10 | | | 1.26 | | | 0.12 | | | 0.78 | | |
| Net asset value per share, end of the period/year | $ | 8.35 | | | $ | 10.66 | | | $ | 9.28 | | | $ | 9.18 | | | $ | 7.92 | | | $ | 7.80 | | |
| | | | | | | | | | | | |
| Stock price per share, end of the period/year | $ | 6.13 | | | $ | 7.35 | | | $ | 6.66 | | | $ | 6.45 | | | $ | 5.25 | | | $ | 5.91 | | |
| Total return based on stock price period/year | (16.60) | % | | 10.36 | % | | 3.26 | % | | 22.86 | % | | (11.17) | % | | 42.75 | % | |
| Supplemental Data: | | | | | | | | | | | | |
| Net assets, end of the period/year | $ | 86,644,516 | | | $ | 110,575,952 | | | $ | 96,317,794 | | | $ | 95,213,639 | | | $ | 82,034,768 | | | $ | 81,042,989 | | |
| Ratio of expenses, excluding taxes, to average net assets | 1.14 | % | 3^ | 5.86 | % | ^ | 4.61 | % | ^ | 6.42 | % | ^ | 3.62 | % | ^ | 6.26 | % | ^ |
| Ratio of expenses, including taxes, to average net assets | 1.14 | % | 3^ | 5.87 | % | ^ | 4.61 | % | ^ | 6.42 | % | ^ | 3.63 | % | ^ | 6.28 | % | 4^ |
| Ratio of net investment loss to average net assets | (0.93) | % | 3 | (3.26) | % | | (0.59) | % | | (5.42) | % | | (2.82) | % | | (4.68) | % | |
| Portfolio turnover | 16.07 | % | | 44.46 | % | | 35.16 | % | | 30.17 | % | | 20.43 | % | | 8.83 | % | |
| Number of shares outstanding, end of the period/year | 10,373,820 | | | 10,373,820 | | | 10,373,820 | | | 10,373,820 | | | 10,373,820 | | | 10,373,820 | | |
# Reflect a 1-for-3 reverse stock split that became effective on January 4, 2021. Refer to Note 1. The Company, for further information.
* Based on average shares outstanding.
^ The Company has entered into an expense offsetting arrangement with one of its unaffiliated brokers relating to broker fees paid. The total broker fee charged to the Company was applied as a credit to fees charged by an affiliate of the unaffiliated broker who the Company subscribes to for data services billed during the year/period. The Company received an offset to expense totaling approximately $31,900, $15,700, $17,500, $5,700, and $84,800 with that broker for the years ended December 31, 2021-2017, respectively. The Company received an offset to expense totaling approximately $21,000 with that broker for the period ended June 30, 2022.
1 Net unrealized losses include rounding adjustments to reconcile change in net asset value per share.
2 Amounts listed as zero are amounts calculated as less than $0.005.
3 Not annualized.
4 Ratio of expenses, including taxes and excluding expenses related to restructuring, to quarterly average net assets for the year ended December 31, 2017 was 5.19%.
The accompanying notes are an integral part of these unaudited consolidated financial statements.
25
| | | | | | | | | | | | | | | | | | | | | | | | | | | | | |
| 180 DEGREE CAPITAL CORP. CONSOLIDATED SCHEDULE OF INVESTMENTS AS OF JUNE 30, 2022 (UNAUDITED) |
| | | | | | | | | |
| Method of
Valuation (1) | | Industry | | Shares/Principal | | Cost | | Value |
| | | | | | | | | | | | | | | | | | | | | | | | | | | | | |
| Investments in Unaffiliated Equity and Equity-Related Securities (2) - | | | | | | | | | |
| 54.8% of net assets at value | | | | | | | | | |
| | | | | | | | | |
| Unaffiliated Publicly Traded Equity and Equity-Related Securities - | | | | | | | | | |
| 31.4% of net assets at value | | | | | | | | | |
| | | | | | | | | |
| Alta Equipment Group, Inc. (3) | | | Trading Companies & Distributors | | | | | | |
| Operates as an industrial and construction equipment company | | | | | | | | | |
| Common Stock (acquired 3/3/20-6/30/22) | (M) (L1) | | | | 542,957 | | $ | 4,475,190 | | | $ | 4,870,324 | |
| | | | | | | | | |
| Commercial Vehicle Group, Inc. (3) | | | Construction Machinery & Heavy Trucks | | | | | | |
| Supplier of vehicle components | | | | | | | | | |
| Common Stock (acquired 12/10/21-6/23/22) | (M) (L1) | | | | 348,101 | | 2,398,011 | | | 2,032,910 | |
| | | | | | | | | |
| comScore, Inc. (3) | | | Advertising | | | | | | |
| Provides technology and services that measure audiences, brands and consumer behavior | | | | | | | | | |
| Common Stock (acquired 3/15/21-6/30/22) | (M) (L1) | | | | 2,490,698 | | 7,530,964 | | | 5,130,838 | |
| | | | | | | | | |
| Envela Corporation (3) | | | Specialty Stores | | | | | | |
| Wholesaler and retailer of jewelry and precious bullion | | | | | | | | | |
| Common Stock (acquired 7/28/21-2/9/22) | (M) (L1) | | | | 192,299 | | 835,747 | | | 1,371,092 | |
| | | | | | | | | |
| Intevac, Inc. (3) | | | Technology Hardware, Storage & Peripherals | | | | | | |
| Develops solutions for the application and engineering of thin-films | | | | | | | | | |
| Common Stock (acquired 1/20/22-6/30/22) | (M) (L1) | | | | 517,096 | | 2,609,570 | | | 2,502,745 | |
| | | | | | | | | |
| Lantronix, Inc. (3) | | | Communications Equipment | | | | | | |
| Provides secure data access and management solutions | | | | | | | | | |
| Common Stock (acquired 9/18/18-6/22/22) | (M) (L1) | | | | 424,626 | | 2,380,372 | | | 2,284,488 | |
| | | | | | | | | |
The accompanying notes are an integral part of this unaudited consolidated financial statements.
26
| | | | | | | | | | | | | | | | | | | | | | | | | | | | | |
| 180 DEGREE CAPITAL CORP. CONSOLIDATED SCHEDULE OF INVESTMENTS AS OF JUNE 30, 2022 (UNAUDITED) |
| | | | | | | | | |
| Method of
Valuation (1) | | Industry | | Shares/Principal | | Cost | | Value |
| | | | | | | | | | | | | | | | | | | | | | | | | | | | | |
| Investments in Unaffiliated Equity and Equity-Related Securities (2) - | | | | | | | | | |
| 54.8% of net assets at value (cont.) | | | | | | | | | |
| | | | | | | | | |
| Unaffiliated Publicly Traded Equity and Equity-Related Securities - | | | | | | | | | |
| 31.4% of net assets at value (cont.) | | | | | | | | | |
| | | | | | | | | |
| Quantum Corporation (3) | | | Technology Hardware, Storage & Peripherals | | | | | | |
| Provides high-density data storage and high-speed data processing solutions | | | | | | | | | |
| Common Stock (acquired 2/4/19-6/28/22) | (M) (L1) | | | | 2,866,187 | | $ | 8,506,657 | | | $ | 4,069,986 | |
| | | | | | | | | |
| RF Industries, Ltd. (3) | | | Electronic Manufacturing Services | | | | | | |
| Provides products that enable wired and wireless communications | | | | | | | | | |
| Common Stock (acquired 4/12/21-6/17/22) | (M) (L1) | | | | 227,763 | | 1,601,594 | | | 1,412,131 | |
| | | | | | | | | |
| Synalloy Corporation (3) | | | Steel | | | | | | |
| Manufactures metals and chemicals | | | | | | | | | |
| Common Stock (acquired 12/7/20-4/13/22) | (M) (L1) | | | | 179,208 | | 1,882,897 | | | 2,519,664 | |
| | | | | | | | | |
| Miscellaneous Common Stocks (4) | (M) (L1) | | | | | | 1,212,746 | | | 981,029 | |
| | | | | | | | | |
| Total Unaffiliated Publicly Traded Equity and Equity-Related Securities (cost: $33,433,748) | | | | | | | | | $ | 27,175,207 | |
| | | | | | | | | |
| Legacy Privately Held Equity and Equity-Related Securities - | | | | | | | | | |
| 23.4% of net assets at value | | | | | | | | | |
| | | | | | | | | |
| AgBiome, LLC (3)(5) | | | Fertilizers & Agricultural Chemicals | | | | | | |
| Develops agricultural products that reduce risk and improve yield | | | | | | | | | |
| Series A-1 Convertible Preferred Units (acquired 1/30/13) | (H) (L3) | | | | 2,000,000 | | $ | 2,000,000 | | | $ | 9,772,240 | |
| Series A-2 Convertible Preferred Units (acquired 4/9/13-10/15/13) | (H) (L3) | | | | 417,392 | | 521,740 | | | 2,040,567 | |
| Series B Convertible Preferred Units (acquired 8/7/15) | (H) (L3) | | | | 160,526 | | 500,006 | | | 796,279 | |
| | | | | | | | 3,021,746 | | | 12,609,086 | |
| | | | | | | | | |
The accompanying notes are an integral part of this unaudited consolidated financial statements.
27
| | | | | | | | | | | | | | | | | | | | | | | | | | | | | |
| 180 DEGREE CAPITAL CORP. CONSOLIDATED SCHEDULE OF INVESTMENTS AS OF JUNE 30, 2022 (UNAUDITED) |
| | | | | | | | | |
| Method of
Valuation (1) | | Industry | | Shares/Principal | | Cost | | Value |
| | | | | | | | | | | | | | | | | | | | | | | | | | | | | |
| Investments in Unaffiliated Equity and Equity-Related Securities (2) - | | | | | | | | | |
| 54.8% of net assets at value (cont.) | | | | | | | | | |
| | | | | | | | | |
| Legacy Privately Held Equity and Equity-Related Securities - | | | | | | | | | |
| 23.4% of net assets at value (cont.) | | | | | | | | | |
| | | | | | | | | |
| AutoTech Ventures Management I, LLC (3)(5)(6) | | | Asset Management & Custody Banks | | | | | | |
| Venture capital investing in automotive-related companies | | | | | | | | | |
| LLC Interests (acquired 12/1/17) | (M) (L3) | | | | 0 | | $ | 0 | | | $ | 225,000 | |
| | | | | | | | | |
| D-Wave Systems, Inc. (3)(5)(7)(8) | | | Technology Hardware, Storage & Peripherals | | | | | | |
| Develops high-performance quantum computing systems | | | | | | | | | |
| Class A Convertible Preferred Stock (acquired 4/14/20) | (M) (L3) | | | | 1,025,045.6 | | 1,238,050 | | | 6,018,616 | |
| | | | | | | | | |
| Fleet Health Alliance, LLC (3)(5)(8)(9) | | | Health Care Technology | | | | | | |
| Develops software for information transfer amongst healthcare providers and consumers | | | | | | | | | |
| Unsecured Convertible Bridge Note, 0%, (acquired 4/22/16, no maturity date) | (I) (L3) | | | | $ | 225,000 | | | 225,000 | | | 0 | |
| | | | | | | | | |
| Magnolia Neurosciences Corporation (3)(5)(8)(9) | | | Pharmaceuticals | | | | | | |
| Develops novel therapeutics for treatment of neurodegeneration | | | | | | | | | |
| Series A Convertible Preferred Stock (acquired 8/3/18) | (I) (L3) | | | | 862,872 | | 862,872 | | | 151,002 | |
| | | | | | | | | |
| Nanosys, Inc. (3)(5)(8)(10) | | | Specialty Chemicals | | | | | | |
| Develops inorganic nanowires and quantum dots for use in LED-backlit devices | | | | | | | | | |
| Series A-1 Convertible Preferred Stock (acquired 5/22/21) | (H) (L3) | | | | 496,572 | | 496,573 | | | 205,884 | |
| Series A-2 Convertible Preferred Stock (acquired 5/22/21) | (H) (L3) | | | | 2,232,001 | | 4,500,003 | | | 858,087 | |
| | | | | | | | 4,996,576 | | | 1,063,971 | |
| | | | | | | | | |
The accompanying notes are an integral part of this unaudited consolidated financial statements.
28
| | | | | | | | | | | | | | | | | | | | | | | | | | | | | |
| 180 DEGREE CAPITAL CORP. CONSOLIDATED SCHEDULE OF INVESTMENTS AS OF JUNE 30, 2022 (UNAUDITED) |
| | | | | | | | | |
| Method of
Valuation (1) | | Industry | | Shares/Principal | | Cost | | Value |
| | | | | | | | | | | | | | | | | | | | | | | | | | | | | |
| Investments in Unaffiliated Equity and Equity-Related Securities (2) - | | | | | | | | | |
| 54.8% of net assets at value (cont.) | | | | | | | | | |
| | | | | | | | | |
| Legacy Privately Held Equity and Equity-Related Securities - | | | | | | | | | |
| 23.4% of net assets at value (cont.) | | | | | | | | | |
| | | | | | | | | |
| Phylagen, Inc. (3)(5)(8) | | | Research & Consulting Services | | | | | | |
| Develops technology to improve human health and business productivity | | | | | | | | | |
| Series A Convertible Preferred Stock (acquired 11/14/18) | (M) (L3) | | | | 548,031 | | $ | 233,845 | | | $ | 206,828 | |
| | | | | | | | | |
| Ravenna Pharmaceuticals, Inc. (3)(5)(8)(9)(11) | | | Pharmaceuticals | | | | | | |
| Holding company for intellectual property in oncology therapeutics | | | | | | | | | |
| Common Stock (acquired 5/14/20-8/26/21) | (M) (L3) | | | | 2,785,274 | | 108,258 | | | 16,414 | |
| | | | | | | | | |
| Seaport Diagnostics, Inc. (3)(5)(8)(9)(12) | | | Health Care Technology | | | | | | |
| Develops consumer focused genetic tests | | | | | | | | | |
| Series 1 Convertible Preferred Stock (acquired 2/5/15-8/5/15) | (I) (L3) | | | | 1,195,315 | | 500,000 | | | 0 | |
| Series A Convertible Preferred Stock (acquired 11/25/15-9/7/16) | (I) (L3) | | | | 1,364,666 | | 1,500,000 | | | 0 | |
| Series A-2 Convertible Preferred Stock (acquired 5/11/17-2/8/18) | (I) (L3) | | | | 176,386 | | 200,002 | | | 0 | |
| | | | | | | | 2,200,002 | | | 0 | |
| | | | | | | | | |
| Total Unaffiliated Legacy Privately Held Equity and Equity-Related Securities (cost: $12,886,349) | | | | | | | | | $ | 20,290,917 | |
| | | | | | | | | |
| Total Investments in Unaffiliated Equity and Equity-Related Securities (cost: $46,320,097) | | | | | | | | | $ | 47,466,124 | |
| | | | | | | | | |
The accompanying notes are an integral part of this unaudited consolidated financial statements.
29
| | | | | | | | | | | | | | | | | | | | | | | | | | | | | |
| 180 DEGREE CAPITAL CORP. CONSOLIDATED SCHEDULE OF INVESTMENTS AS OF JUNE 30, 2022 (UNAUDITED) |
| | | | | | | | | |
| Method of
Valuation (1) | | Industry | | Shares/Principal | | Cost | | Value |
| | | | | | | | | | | | | | | | | | | | | | | | | | | | | |
| Investments in Non-Controlled Affiliated Equity and Equity-Related Securities (2) - | | | | | | | | | |
| 25.9% of net assets at value | | | | | | | | | |
| | | | | | | | | |
| Non-Controlled Affiliated Publicly Traded Equity and Equity-Related Securities - | | | | | | | | | |
| 24.7% of net assets at value | | | | | | | | | |
| | | | | | | | | |
| Arena Group Holdings, Inc. (3)(13) | | | Interactive Media & Services | | | | | | |
| Provides a shared digital publishing, advertising and distribution platform | | | | | | | | | |
| Common Stock (acquired 12/18/20-1/24/22) | (M) (L1) | | | | 791,545 | | $ | 9,117,536 | | | $ | 7,123,905 | |
| | | | | | | | | |
| Potbelly Corporation (3)(13) | | | Restaurants | | | | | | |
| Operates a chain of sandwich shops | | | | | | | | | |
| Common Stock (acquired 6/24/19-2/24/22) | (M) (L1) | | | | 1,518,671 | | 6,720,177 | | | 8,580,491 | |
| | | | | | | | | |
| Synchronoss Technologies, Inc. (3)(13) | | | Application Software | | | | | | |
| Provides white-label cloud storage, messaging and other digital analytic services | | | | | | | | | |
| Common Stock (acquired 7/17/20-6/30/22) | (M) (L1) | | | | 4,990,259 | | 12,281,774 | | | 5,738,798 | |
| | | | | | | | | |
| Total Non-Controlled Affiliated Publicly Traded Equity and Equity-Related Securities (cost: $28,119,487) | | | | | | | | | $ | 21,443,194 | |
| | | | | | | | | |
| Legacy Privately Held Equity and Equity-Related Securities - | | | | | | | | | |
| 1.2% of net assets at value | | | | | | | | | |
| | | | | | | | | |
| EchoPixel, Inc. (3)(5)(8) | | | Health Care Equipment | | | | | | |
| Develops virtual reality 3-D visualization software for life sciences and health care applications | | | | | | | | | |
| Series Seed Convertible Preferred Stock (acquired 6/21/13-6/30/14) | (I) (L3) | | | | 4,194,630 | | $ | 1,250,000 | | | $ | 276,270 | |
| Series Seed-2 Convertible Preferred Stock (acquired 1/22/16) | (I) (L3) | | | | 1,476,668 | | 500,000 | | | 99,118 | |
| Series A-2 Convertible Preferred Stock (acquired 3/23/17) | (I) (L3) | | | | 1,471,577 | | 350,000 | | | 138,364 | |
| | | | | | | | 2,100,000 | | | 513,752 | |
| | | | | | | | | |
The accompanying notes are an integral part of this unaudited consolidated financial statements.
30
| | | | | | | | | | | | | | | | | | | | | | | | | | | | | |
| 180 DEGREE CAPITAL CORP. CONSOLIDATED SCHEDULE OF INVESTMENTS AS OF JUNE 30, 2022 (UNAUDITED) |
| | | | | | | | | |
| Method of
Valuation (1) | | Industry | | Shares/Principal | | Cost | | Value |
| | | | | | | | | | | | | | | | | | | | | | | | | | | | | |
| Investments in Non-Controlled Affiliated Equity and Equity-Related Securities (2) - | | | | | | | | | |
| 25.9% of net assets at value (cont.) | | | | | | | | | |
| | | | | | | | | |
| Legacy Privately Held Equity and Equity-Related Securities - | | | | | | | | | |
| 1.2% of net assets at value (cont.) | | | | | | | | | |
| | | | | | | | | |
| HALE.life Corporation (3)(5)(8) | | | Health Care Technology | | | | | | |
| Develops a platform to facilitate precision health and medicine | | | | | | | | | |
| Common Stock (acquired 3/1/16) | (I) (L3) | | | | 1,000,000 | | $ | 10 | | | $ | 8,227 | |
| Series Seed-1 Convertible Preferred Stock (acquired 3/28/17) | (I) (L3) | | | | 11,000,000 | | 1,896,920 | | | 234,175 | |
| Series Seed-2 Convertible Preferred Stock (acquired 12/28/18) | (I) (L3) | | | | 12,083,132 | | 2,500,000 | | | 290,494 | |
| | | | | | | | 4,396,930 | | | 532,896 | |
| | | | | | | | | |
| Total Non-Controlled Affiliated Legacy Privately Held Equity and Equity-Related Securities (cost: $6,496,930) | | | | | | | | | $ | 1,046,648 | |
| | | | | | | | | |
| Total Investments in Non-Controlled Affiliated Equity and Equity-Related Securities (cost: $34,616,417) | | | | | | | | | $ | 22,489,842 | |
| | | | | | | | | |
The accompanying notes are an integral part of this unaudited consolidated financial statements.
31
| | | | | | | | | | | | | | | | | | | | | | | | | | | | | |
| 180 DEGREE CAPITAL CORP. CONSOLIDATED SCHEDULE OF INVESTMENTS AS OF JUNE 30, 2022 (UNAUDITED) |
| | | | | | | | | |
| Method of
Valuation (1) | | Industry | | Shares/Principal | | Cost | | Value |
| | | | | | | | | | | | | | | | | | | | | | | | | | | | | |
| Controlled Affiliated Equity and Equity-Related Securities (2) - | | | | | | | | | |
| 6.9% of net assets at value | | | | | | | | | |
| | | | | | | | | |
| LS180 Acquisition Holdings, LLC (3)(5) | | | Specialized Finance | | | | | | |
| Holding company for Special Purpose Acquisition Company (SPAC) interests | | | | | | | | | |
| Membership Units (acquired 4/13/21) | (I) (L3) | | | | 1,300,000 | | $ | 13,000 | | | $ | 0 | |
| Unsecured Promissory Note, 0% (acquired 5/10/2021, maturing 12/31/22) | (I) (L3) | | | | $ | 50,000 | | | 50,000 | | | 2,500 | |
| Unsecured Promissory Note, 0% (acquired 9/7/21, maturing 12/31/22) | (I) (L3) | | | | $ | 50,000 | | | 50,000 | | | 2,500 | |
| Unsecured Promissory Note, 0% (acquired 1/27/22, maturing 12/31/22) | (I) (L3) | | | | $ | 50,000 | | | 50,000 | | | 2,500 | |
| | | | | | | | 163,000 | | | 7,500 | |
| | | | | | | | | |
| Parabellum Acquisition Holdings, LLC (3)(5) | | | Specialized Finance | | | | | | |
| Holding company for Special Purpose Acquisition Company (SPAC) interests | | | | | | | | | |
| Membership Units (acquired 4/22/21) | (M) (L3) | | | | 693,151 | | 2,717,646 | | | 5,963,133 | |
| | | | | | | | | |
| Total Controlled Affiliated Equity and Equity-Related Securities (cost: $2,880,646) | | | | | | | | | $ | 5,970,633 | |
| | | | | | | | | |
| Total Investments in Publicly Traded Equity and Equity-Related Securities and Legacy Privately Held Equity and Equity-Related Securities (cost: $83,817,160) | | | | | | | | | $ | 75,926,599 | |
| | | | | | | | | |
| Derivative Securities - | | | | | | | | | |
| 0.3% of net assets at value | | | | | | | | | |
| | | | | | | | | |
| Unaffiliated Derivative Securities (2) - | | | | | | | | | |
| 0.0% of net assets at value | | | | | | | | | |
| | | | | | | | | |
| Magnolia Neurosciences Corporation (3)(5)(8)(9) | | | Pharmaceuticals | | | | | | |
| Develops novel therapeutics for treatment of neurodegeneration | | | | | | | | | |
| Warrants for the Purchase of Common Stock expiring 8/3/28 (acquired 8/26/21) | (I) (L3) | | | | 138,059 | | | $ | 112,854 | | | $ | 0 | |
| | | | | | | | | |
The accompanying notes are an integral part of this unaudited consolidated financial statements.
32
| | | | | | | | | | | | | | | | | | | | | | | | | | | | | |
| 180 DEGREE CAPITAL CORP. CONSOLIDATED SCHEDULE OF INVESTMENTS AS OF JUNE 30, 2022 (UNAUDITED) |
| | | | | | | | | |
| Method of
Valuation (1) | | Industry | | Shares/Principal | | Cost | | Value |
| | | | | | | | | | | | | | | | | | | | | | | | | | | | | |
| Derivative Securities - | | | | | | | | | |
| 0.3% of net assets at value (cont.) | | | | | | | | | |
| | | | | | | | | |
| Unaffiliated Derivative Securities (2) - | | | | | | | | | |
| 0.0% of net assets at value (cont.) | | | | | | | | | |
| | | | | | | | | |
| NanoTerra, Inc. (3)(5)(9) | | | Research & Consulting Services | | | | | | |
| Develops surface chemistry and nano-manufacturing solutions | | | | | | | | | |
| Warrants for Series A-3 Preferred Stock expiring on 11/15/22 (acquired 11/15/12) | (I) (L3) | | | | 47,508 | | $ | 35,403 | | | $ | 0 | |
| | | | | | | | | |
| OpGen, Inc. (3) | | | Biotechnology | | | | | | |
| Developing tools for genomic sequence assembly and analysis | | | | | | | | | |
| Warrants for the Purchase of Common Stock expiring 2/17/25 (acquired 5/5/15) | (I) (L3) | | | | 62 | | 785 | | | 0 | |
| | | | | | | | | |
| Total Unaffiliated Derivative Securities (cost: $149,042) | | | | | | | | | $ | 0 | |
| | | | | | | | | |
| Non-Controlled Affiliated Derivative Securities (2) - | | | | | | | | | |
| 0.3% of net assets at value | | | | | | | | | |
| | | | | | | | | |
| Potbelly Corporation (3)(13) | | | Restaurants | | | | | | |
| Operates a chain of sandwich shops | | | | | | | | | |
| Warrants for the Purchase of Common Stock expiring 2/12/26 (acquired 2/10/21) | (I) (L3) | | | | 80,605 | | $ | 224,849 | | | $ | 232,632 | |
| | | | | | | | | |
| Total Non-Controlled Affiliated Derivative Securities (cost: $224,849) | | | | | | | | | $ | 232,632 | |
| | | | | | | | | |
| Total Derivative Securities (cost: $373,891) | | | | | | | | | $ | 232,632 | |
| | | | | | | | | |
| Total Investments (cost: $84,191,051) | | | | | | | | | $ | 76,159,231 | |
| | | | | | | | | |
The accompanying notes are an integral part of this unaudited consolidated financial statements.
33
| | | | | | | | | | | | | | | | | | | | | | | | | | | | | |
| 180 DEGREE CAPITAL CORP. CONSOLIDATED SCHEDULE OF INVESTMENTS AS OF JUNE 30, 2022 (UNAUDITED) |
| | | | | | | | | |
| Method of
Valuation (1) | | Industry | | Shares/Principal | | Cost | | Value |
| | | | | | | | | | | | | | | | | | | | | | | | | | | | | |
| Other Financial Instruments (14) - | | | | | | | | | |
| | | | | | | | | |
| Unaffiliated Rights to Payments (Illiquid) (2) - | | | | | | | | | |
| 3.8% of net assets at value | | | | | | | | | |
| | | | | | | | | |
| Rights to Milestone Payments from Acquisition of BioVex Group, Inc. (acquired 3/4/11) (3)(5)(8)(15) | (I) (L3) | | Biotechnology | | $ | 548,998 | | | $ | 548,998 | | | $ | 373,329 | |
| | | | | | | | | |
| Rights to Milestone Payments from Acquisition of TARA Biosystems, Inc. (acquired 4/1/22) (3)(5)(8)(16) | (I) (L3) | | Pharmaceuticals | | $ | 3,012,461 | | | 3,012,461 | | | 2,917,437 | |
| | | | | | | | | |
| Total Unaffiliated Rights to Payments (cost: $3,561,459) | | | | | | | | | $ | 3,290,766 | |
| | | | | | | | | |
| Total Investments in Publicly Traded and Privately Held Equity and Equity-Related Securities, Derivative Securities and Other Financial Instruments (cost: $87,752,510) | | | | | | | | | $ | 79,449,997 | |
The accompanying notes are an integral part of this unaudited consolidated financial statements.
34
180 DEGREE CAPITAL CORP.
NOTES TO CONSOLIDATED SCHEDULE OF INVESTMENTS AS OF JUNE 30, 2022
(UNAUDITED)
Notes to Consolidated Schedule of Investments
(1)See Note 2. Summary of Significant Accounting Policies: Portfolio Investment Valuations.
(2)Investments in unaffiliated securities consist of investments in which the Company owns less than five percent of the voting shares of the portfolio company. Investments in non-controlled affiliated securities consist of investments in which the Company owns five percent or more, but less than 25 percent, of the voting shares of the portfolio company, or where the Company controls one or more seats on the portfolio company’s board of directors but do not control the company. Investments in controlled affiliated securities consist of investments in which the Company owns 25 percent or more of the outstanding voting rights of the portfolio company or otherwise control the company, including control of a majority of the seats on the board of directors, or more than 25 percent of the seats on the board of directors, with no other entity or person in control of more director seats than us.
(3)Represents a non-income producing investment. Investments that have not paid dividends or interest within the last 12 months or are on non-accrual status for at least 12 consecutive months are considered to be non-income producing.
(4)The identities of these securities have been concealed while the Company completes a purchase or selling program for these securities.
(5)The Company is subject to legal restrictions on the sale of all or a portion of our investment(s) in this company. The total amount of restricted securities held is $30,598,964, or 35.3 percent of net assets.
(6)The Company received LLC Interests of 1.25 percent in AutoTech Ventures Management I, LLC ("AutoTech") pursuant to an Administrative Services Agreement between us and AutoTech and due to us following the termination of a former employee of the Company. These LLC Interests were separate from the compensation received for providing the administrative services under the agreement that were paid in cash. The LLC interests have a capital percentage of 0 percent.
(7)The Company initially invested in D-Wave Systems, Inc. starting in 2008 and through 2014, acquiring various classes of preferred stock.
(8)These securities are held by the Company's wholly owned subsidiary, 180 Degree Private Holdings, LLC ("180PH"), which were transferred from the Company to 180PH in the fourth quarter of 2020. The acquisition dates of the securities reflect the dates such securities were obtained by the Company rather than the transfer date.
(9)Represents a non-operating entity that exists to collect future payments from licenses or other engagements, monetize assets for future distributions to investors and debt holders, or is in the process of shutting down and distributing remaining assets according to a liquidation waterfall.
(10)The Company invested in Nanosys, Inc. in rounds of financing that occurred in 2003, 2004 and 2005. In May 2021, Nanosys completed a restructuring of its capitalization table that resulted in shares of Series C and Series D Preferred Stock being converted into shares of Series A-2 Preferred Stock and Series E Preferred Stock being converted into shares of Series A-1 Preferred Stock. The date of acquisition listed reflects the date of this conversion rather than the date of our investment in the company.
(11)The Company received shares of Ravenna Pharmaceuticals, Inc., as part of the consideration of the acquisition of Petra Pharma Corporation.
(12)ORIG3N, Inc., changed its name to Seaport Diagnostics, Inc. in April 2021.
(13)The Company is the Investment Manager of a separately managed account ("SMA") that owns shares of these portfolio companies. Under our investment management agreement for this SMA, the Company has the right to control the votes of the securities held by the SMA. The Company has voting ownership between 5 percent and 25 percent in these companies when the shares held by us and our SMA are aggregated.
(14)Other financial instruments are holdings of the Company that do not meet the definition of a security or a derivative.
The accompanying notes are an integral part of this unaudited consolidated financial statements.
35
180 DEGREE CAPITAL CORP.
NOTES TO CONSOLIDATED SCHEDULE OF INVESTMENTS AS OF JUNE 30, 2022
(UNAUDITED)
(15)If all the remaining milestones are met, the Company would receive $4.1 million. There can be no assurance as to how much of these amounts the Company will ultimately realize or when they will be realized, if at all.
(16)If all the remaining milestones are met and the time-based payments are completed, the Company would receive approximately $5.9 million. Of this amount, approximately $2.3 million are solely based on time between this statement date and April 2024. There can be no assurance as to how much of the milestone-based payments will ultimately be realized or when they will be realized, if at all.
The accompanying notes are an integral part of this unaudited consolidated financial statements.
36
180 DEGREE CAPITAL CORP.
NOTES TO CONSOLIDATED FINANCIAL STATEMENTS
NOTE 1. THE COMPANY
180 Degree Capital Corp. (f/k/a Harris & Harris Group, Inc.) (the "Company," "us," "our" and "we"), withdrew its election to be treated as a business development company on March 30, 2017, and subsequently returned to its prior status as a registered non-diversified closed-end management investment company ("Closed-End Fund" or "CEF") under the Investment Company Act of 1940 (the "1940 Act"). We operate as an internally managed investment company whereby our officers and employees, under the general supervision of our Board of Directors, conduct our operations. As of May 22, 2020, we are also registered with the Securities and Exchange Commission as a Registered Investment Adviser under the Investment Advisers Act of 1940 (the "Advisers Act").
180 Degree Private Holdings, LLC ("180PH"), is a wholly owned limited liability company that was created in October 2020 to hold certain of the Company's securities of privately held companies. 180PH is consolidated for financial reporting purposes and is a disregarded entity for tax purposes under the Code.
180 Degree Capital BD, LLC ("180BD") is a 100 percent owned subsidiary of the Company. 180BD was formed to provide services to the Company related to fundraising for co-investment funds and not for investment returns. 180BD is a registered broker-dealer with the Financial Industry Regulatory Authority ("FINRA"). The Company consolidates 180BD for financial reporting purposes. 180BD is currently a disregarded entity for tax purposes under the Code.
The Company is the Managing Member of 180 Degree Capital Management, LLC ("180CM"), a limited liability company formed to facilitate the opportunity for interested investors to co-invest alongside the Company in individual publicly traded portfolio companies. As of June 30, 2022, the Company has no capital under management in 180CM.
The Company is the General Partner of 180 Phoenix Fund, L.P. ("180 Phoenix"), a limited partnership formed to facilitate management of a fund that was formed to co-invest alongside the Company in its publicly traded companies on an on-going basis. As of June 30, 2022, 180 Phoenix did not have any capital under management.
As of June 30, 2022, the Company has approximately $27.9 million in net assets under management in two separately managed accounts ("SMA").
The Company may, in certain cases, receive management fees and carried interest on profits generated on invested capital from any capital under management if and when capital is raised and if and when profits are realized, respectively. The Company does not consolidate the operations of any capital managed in separate series of 180CM, or in the separately managed accounts, and it does not expect to consolidate the operations of any capital managed in 180 Phoenix if and when the entity has capital under management.
Following receipt of approval from shareholders at an annual meeting of shareholders held on May 14, 2020, the Company filed an amendment to its Amended and Restated Certificate of Incorporation on December 31, 2020, to affect a reverse stock split of its issued and outstanding shares of common stock, at a ratio of one share for three shares. All share amounts, per share data and operating performance have been adjusted to reflect the reverse stock split.
NOTE 2. SUMMARY OF SIGNIFICANT ACCOUNTING POLICIES
The following is a summary of significant accounting policies followed in the preparation of the consolidated financial statements:
Principles of Consolidation. The consolidated financial statements have been prepared in accordance with accounting principles generally accepted in the US ("GAAP") and Articles 6 and 12 of Regulation S-X of the SEC and include the accounts of the Company and its wholly owned subsidiaries. The Company is an investment company following accounting and reporting guidance in Accounting Standards Codification 946. In accordance with GAAP and Regulation S-X under 17 C.F.R. Part 210, the Company may only consolidate its interests in investment company subsidiaries and controlled operating companies whose business consists of providing services to the Company. Our wholly owned subsidiary, 180BD, is a controlled operating company that provide services to us and is, therefore, consolidated. All significant intercompany accounts and transactions have been eliminated in the consolidation.
Use of Estimates. The preparation of the consolidated financial statements in conformity with GAAP requires management to make estimates and assumptions that affect the reported amounts of assets and liabilities and contingent assets and liabilities and the reported amounts of revenues and expenses. Actual results could differ from these estimates, and the differences could be material. The most significant estimates relate to the fair valuations of our investments.
Portfolio Investment Valuations. Investments are stated at "value" as defined in the 1940 Act and in the applicable regulations of the SEC and in accordance with GAAP. Value, as defined in Section 2(a)(41) of the 1940 Act, is (i) the market price for those securities for which a market quotation is readily available and (ii) the fair value as determined in good faith by, or under the direction of, the Board of Directors for all other assets. The Valuation Committee, comprised of all of the independent Board members, is responsible for determining the valuation of the Company’s assets within the guidelines established by the Board of Directors. The Valuation Committee receives information and recommendations from management. An independent valuation firm also reviews select portfolio company valuations. The independent valuation firm does not provide independent valuations. The fair values assigned to these investments are based on available information and do not necessarily represent amounts that might ultimately be realized when that investment is sold, as such amounts depend on future circumstances and cannot reasonably be determined until the individual investments are actually liquidated or become readily marketable. The Valuation Committee values the Company's investment assets as of the end of each calendar quarter and as of any other time requested by the Board of Directors.
Accounting Standards Codification Topic 820, "Fair Value Measurements," ("ASC 820") defines fair value as the price that would be received to sell an asset or paid to transfer a liability in an orderly transaction between market participants at the measurement date (exit price). It applies fair value terminology to all valuations whereas the 1940 Act applies market value terminology to readily marketable assets and fair value terminology to other assets.
The main approaches to measuring fair value utilized are the market approach, the income approach and the hybrid approach.
•Market Approach (M): The market approach focuses on inputs and not techniques. The market approach may use quantitative inputs such as prices and other relevant information generated by market transactions involving identical or comparable assets or liabilities and the values of market multiples derived from a set of comparable companies. The market approach may also use qualitative inputs such as progress toward milestones, the long-term potential of the business, current and future financing requirements and the rights and preferences of certain securities versus those of other securities. The selection of the relevant inputs used to derive value under the market approach requires judgment considering factors specific to the significance and relevance of each input to deriving value.
•Income Approach (I): The income approach focuses on techniques and not inputs. The income approach uses valuation techniques to convert future amounts (for example, revenue, cash flows or earnings) to a single present value amount (discounted). The measurement is based on the value indicated by current market expectations about those future amounts. Those valuation techniques include present value techniques; option-pricing models, such as the Black-Scholes-Merton formula (a closed-form model) and a binomial model (a lattice model), which incorporate present value techniques; and the multi-period excess earnings method, which is used to measure the fair value of certain assets.
•Hybrid Approach (H): The hybrid approach uses elements of both the market approach and the income approach. The hybrid approach calculates values using the market and income approach, individually. The resulting values are then distributed among the share classes based on probability of exit outcomes.
ASC Topic 820 classifies the inputs used to measure fair value by these approaches into the following hierarchy:
•Level 1 (L1): Unadjusted quoted prices in active markets for identical assets or liabilities;
•Level 2 (L2): Inputs other than quoted prices included within Level 1 that are observable for the asset or liability, either directly or indirectly. These include quoted prices in active markets for similar assets or liabilities, or quoted prices for identical or similar assets or liabilities in markets that are not active, or inputs other than quoted prices that are observable for the asset or liability, either directly or indirectly, for substantially the full term of the financial instrument. Level 2 inputs are in those markets for which there are few transactions, the prices are not current, little public information exists or instances where prices vary substantially over time or among brokered market makers; and
•Level 3 (L3): Inputs to the valuation methodology are unobservable and significant to the fair value measurement. Unobservable inputs are those inputs that reflect our own assumptions that market participants would use to price the asset or liability based upon the best available information.
Financial assets and liabilities are classified in their entirety based on the lowest level of input that is significant to the fair value measurement and are not necessarily an indication of risks associated with the investment.
As of June 30, 2022, our financial statements include investments fair valued by the Board of Directors of $30,831,596. The fair values were determined in good faith by, or under the direction of, the Board of Directors. The fair value amount includes the values of our investments in legacy privately held companies and rights to future milestone payments, as well as our membership units of Parabellum Acquisition Holdings, LLC, an entity through which we own shares and warrants of Parabellum Acquisition Corp., our membership units of LS180 Acquisition Holdings, LLC, and our warrants of OpGen, Inc. and Potbelly Corporation, which are securities of publicly traded companies.
Cash. Cash includes demand deposits. Cash is carried at cost, which approximates fair value.
Unaffiliated Rights to Payments. At June 30, 2022, the outstanding potential milestone payments from Amgen, Inc.’s acquisition of BioVex Group, Inc., were valued at $373,329. At June 30, 2022, the outstanding potential milestone and time-based payments from the acquisition of TARA Biosystems, Inc., by Valo Health, LLC were valued at $2,917,437. The milestone payments are valued using the probability-adjusted, present value of proceeds from future payments that would be due upon successful completion of certain regulatory milestones. There can be no assurance as to how much of the amounts related to milestone payments that we will ultimately realize or when they will be realized, if at all. The time-based payments are valued using a discount for time-value of money that includes estimated default risk of the acquirer.
Prepaid Expenses. We include prepaid insurance premiums and deferred financing charges in "Prepaid expenses." Prepaid insurance premiums are recognized over the term of the insurance contract and are included in "Insurance" in the Company's Consolidated Statement of Operations.
Property and Equipment. Property and equipment are included in "Other assets" and are carried at $15,999 at June 30, 2022, representing cost of $221,868, less accumulated depreciation of $205,869. Depreciation is provided using the straight-line method over the estimated useful lives of the property and equipment. We estimate the useful lives to be five to ten years for furniture and fixtures, and three years for computer equipment.
Post-Retirement Plan Liabilities. Until it was terminated on April 27, 2017, the Company provided a Retiree Medical Benefit Plan for employees who met certain eligibility requirements. Until it was terminated on May 5, 2011, the Company also provided an Executive Mandatory Retirement Benefit Plan for certain individuals employed by us in a bona fide executive or high policy-making position. The net periodic post-retirement benefit cost includes service cost and interest cost on the accumulated post-retirement benefit obligation. Unrecognized actuarial gains and losses are recognized as net periodic benefit cost, pursuant to the Company's historical accounting policy in "Salaries, bonus and benefits" in the Company's Consolidated Statement of Operations. The impact of plan amendments was amortized over the employee's average service period as a reduction of net periodic benefit cost. Unamortized prior service cost was fully amortized during 2017 as a result of the termination of the Retiree Medical Benefit Plan.
Interest Income Recognition. Interest income, including amortization of premium and accretion of discount, is recorded on an accrual basis. When accrued interest is determined not to be recoverable, the Company ceases accruing interest and writes off any previously accrued interest. Write-offs are netted in interest income. Securities are deemed to be non-income producing if investments have not paid dividends or interest within the last 12 months or are on non-accrual status for at least 12 consecutive months. When the fair value of a security that includes PIK interest is less than the accrued interest, the Company may place the security on non-accrued status.
Board Fees From Portfolio Companies. The Company recognizes revenues from fee income from board fees as those services are provided.
Management Fees and Performance Fees/Carried Interest from Managed Funds. As a Registered Investment Adviser under the Advisers Act, the Company may be entitled to receive management fees and performance fees from clients including separately managed accounts (SMAs) and special purpose vehicles (SPVs). The Company does not currently collect a management fee on its two SMA accounts. When applicable, the Company accrues management fees on our SPVs that are to be paid upon liquidation of the entity regardless of performance. Performance fees or carried interest, if any, is paid annually by our SMAs based on a fixed percentage of the increase in net assets during the year. Performance fees on SPVs, if any, are
generally paid based on the amount of increase in net assets at the time of any distribution of capital above the amount of initial invested capital plus accrued expenses. The timing and payment terms of management fees and performance fees for future client accounts may be different than those of our current SMAs.
Expenses that are the responsibility of client accounts are generally paid for by the Company and then reimbursed at a future date by the client accounts. Our SMA generally pays any reimbursable expenses within 30 days of invoice. As of June 30, 2022, $152,151 of expenses reimbursable to us by 180 Phoenix for formation expenses is included in “Receivable from managed funds” in our Consolidated Statement of Assets and Liabilities. If we are unable to raise funds for 180 Phoenix, or if the terms under which we raise capital do not include reimbursement for formation costs, we may not be able to collect on this receivable.
The Company does not include accruals for carried interest in the consolidated financial statements until such carried interest is received and/or the Company concludes that it is probable that a reversal of any accrual will not occur. The Company did not accrue any carried interest in the period ended June 30, 2022. If the year ended as of this statement date, the Company would not receive any carried interest from its SMAs.
Other Income. The Company may purchase restricted securities issued by publicly traded companies that include provisions that provide for payment of partial liquidated damages in the event the issuer does not meet obligations specified in the purchase agreement or other ancillary documents associated with the transaction. These obligations most commonly are associated with the filing of registration statements and/or being up to date with the filing of the issuer's financial statements with the SEC. During the period ended June 30, 2022, the Company received additional shares in lieu of cash for $202,077 as partial liquidated damages from Arena Group Holdings, Inc, one of its publicly traded portfolio companies and is recorded in "Other income" in the Company's Consolidated Statement of Operations. The amount for partial liquidated damages recorded in prior periods was $891,937. During the period ended June 30, 2022, the Company received shares in lieu of cash valued at $1,094,014. A certain amount of these shares valued at $196,290 were transferable to another party and was recorded as a realized loss on the Company's Consolidated Statement of Operations.
Put and Call Options. The Company may purchase options on publicly traded securities as an investment and/or with the intention of limiting its downside risk. When the Company purchases an option, an amount equal to the premium paid is recorded in the Consolidated Statements of Assets and Liabilities as an investment. The Company may also purchase an option at one price and write/sell an option at another price in a simultaneous transaction referred to as a spread. The amount of these assets is subsequently marked-to-market to reflect the current value of the options. In the event that the options are exercised, the Company would be required to deliver those shares to the counterparty. When the options expire unexercised, the Company realizes a loss on the premium paid, or the difference between the premium paid and the premium received, as applicable. Net realized gain from investments in purchased put options and written put options was $35,909.
Rent Expense. The Company currently leases and runs daily operations in approximately 1,250 square feet of office space in Montclair, New Jersey. Prior to November 17, 2021, the Company leased this space on a month-to-month basis at a base rent of approximately $26 per square foot per year. On November 17, 2021, the Company entered into a three-year lease extension that set the average base rent beginning January 1, 2022, at approximately $30 per square foot over the term of the extension. Either the Company or the landlord may terminate the lease at any time with two months' written notice to either party. As of June 30, 2022, the present value of the future lease payments (lease liability) is recorded as an asset and a liability in the Company's Consolidated Statement of Assets and Liabilities. The amount is calculated using weighted average discount rate of 1.32 percent and weighted based on the terms of the the lease agreement.
Realized Gain or Loss and Unrealized Appreciation or Depreciation of Portfolio Investments. Realized gain or loss is recognized when an investment is disposed of and is computed as the difference between the Company's cost basis in the investment at the disposition date and the net proceeds received from such disposition. Realized gain or loss on investment transactions are determined by specific identification. Unrealized appreciation or depreciation is computed as the difference between the fair value of the investment and the cost basis of such investment.
Income Taxes. The Company did not qualify as a Regulated Investment Company (RIC) under Subchapter M of the Code in 2021, and was therefore taxed as a C-Corporation for that year. As we currently intend to qualify as a RIC under Subchapter M of the Code in future years and distribute any ordinary income, however, the Company does not accrue for income taxes. The Company has capital loss carryforwards that can be used to offset net realized capital gains. The Company also has operating loss carryforwards that can be used to offset operating income and net realized capital gains in years when we fail to qualify as a RIC. The Company recognizes interest and penalties in income tax expense. See Note 9. Income Taxes for further discussion.
Foreign Currency Translation. The accounting records of the Company are maintained in U.S. dollars. All assets and liabilities denominated in foreign currencies are translated into U.S. dollars based on the rate of exchange of such currencies against U.S. dollars on the date of valuation. If Company has assets denominated in foreign currencies, it does not isolate the portion of the results of operations that arises from changes in foreign currency rates on investments held on its Consolidated Statement of Operations.
Securities Transactions. Securities transactions are accounted for on the date the transaction for the purchase or sale of the securities is entered into by the Company (i.e., trade date). Securities transactions outside conventional channels, such as private transactions, are recorded as of the date the Company obtains the right to demand the securities purchased or to collect the proceeds from a sale and incurs the obligation to pay for the securities purchased or to deliver the securities sold.
Concentration of Credit Risk. The Company places its cash with financial institutions and, at times, cash held in depository accounts may exceed the Federal Deposit Insurance Corporation's insured limit and is subject to the credit risk of such institutions to the extent it exceeds such limit.
Recent Accounting Pronouncements and Adoptions. On June 30, 2022, the FASB issued ASU 2022-03, "'Fair Value Measurement (Topic 820): Fair Value Measurement of Equity Securities Subject to Contractual Sale Restrictions." This ASU clarifies that a contractual restriction on the sale of an equity security is not considered part of the unit of account of the equity security and, therefore, is not considered in measuring fair value. The guidance is effective for fiscal years, including interim periods within those fiscal years, beginning after December 15, 2023, and early adoption is permitted. This ASU is not expected to have a material impact on the Company's financial statements as the Company does not consider contractual restrictions (such as lock-up agreements) in the determination of fair value of its equity securities.
NOTE 3. BUSINESS RISKS AND UNCERTAINTIES
Our business activities contain elements of risk. We consider the principal types of market risk to be valuation risk, diversification risk, interest rate risk and foreign currency risk. Although we are risk-seeking rather than risk-averse in our investments, we consider the management of risk to be essential to our business.
Investment Objective
Our investment objective is to generate capital appreciation and current income from investments and investment-related activities such as managed funds and accounts.
Investment Strategy
Our investment strategy on future new investments is focused on generating capital appreciation and current income from investments in what we believe are deeply undervalued, small publicly traded companies where we believe we can positively impact the business and valuation through constructive activism. Historically, our investment strategy was to achieve long-term capital appreciation investing in venture capital investments. While we continue to provide such resources to our existing legacy portfolio companies, we no longer make venture capital investments. We classify our legacy portfolio companies as Legacy Privately Held Equity and Equity-Related Securities.
We believe we combine new perspectives with the historical knowledge and experience of managing the current portfolio. Our investment approach is comprised of a patient examination of available opportunities through due diligence and close involvement with management of our portfolio companies. We invest our capital directly into portfolio companies or through purchases of securities of publicly traded companies directly and through open-market purchases. We may seek to invest our capital alongside capital from other investors through that we control.
We have discretion in the investment of our capital to achieve our objectives by investing in various types of assets, and we do not currently limit our investments to any security type. Our investments may include, among other asset types: equity, equity-related securities (including warrants and options) and debt with equity features from either private or public issuers; debt obligations of all types having varying terms with respect to security or credit support, subordination, purchase price, interest payments and maturity; foreign securities; and miscellaneous investments.
Investment Policies
Fundamental policies may not be changed without the approval of the holders of a majority of our voting securities, as defined in the 1940 Act. As a matter of fundamental policy, the Company will not:
(1) Issue senior securities, borrow money from banks, brokers or other lenders, or engage in transactions involving the issuance by us of "senior securities" representing indebtedness, except to the extent permitted under the 1940 Act or the rules, regulations or interpretations thereof.
(2) Underwrite securities of other issuers, except insofar as we may be deemed an underwriter under the Securities Act of 1933, as amended (the "Securities Act"), in connection with the disposition of our portfolio securities. We may invest in restricted securities (those that must be registered under the Securities Act before they may be offered or sold to the public) to the extent permitted by the 1940 Act or the rules, regulations or interpretations thereof.
(3) Invest more than 25% of our total assets in the securities of companies or entities engaged in any one industry, or group of industries. This limitation does not apply to investment in the securities of the U.S. Government, its agencies or instrumentalities.
(4) Purchase or sell real estate or interests in real estate (except that we may (a) purchase and sell real estate or interests in real estate in connection with the orderly liquidation of investments, or in connection with foreclosure on collateral, or (b) own the securities of companies that are in the business of buying, selling or developing real estate).
(5) Purchase or sell commodities or commodity contracts, but we may purchase and sell foreign currency and enter into foreign currency forward contracts, and may engage in other transactions in financial instruments, in each case to the extent permitted under the Company's investment policies as in effect from time to time.
(6) Make loans of money or securities to other persons, except through purchasing fixed-income securities or other debt instruments, lending portfolio securities or entering into repurchase agreements in a manner consistent with our investment policies. With respect to these investment restrictions, if a percentage restriction is adhered to at the time of entering into the investment or transaction, a later change in percentage resulting from a change in the values of investments or the value of our total assets, unless otherwise stated or required by law, will not constitute a violation of the restriction or policy.
Valuation Risk
Value, as defined in Section 2(a)(41) of the 1940 Act, is (i) the market price for those securities for which market quotations are readily available and (ii) fair value as determined in good faith by, or under the direction of, the Board of Directors for all other assets. See Note 2. Summary of Significant Accounting Policies for further discussion. In December 2020, the SEC adopted Rule 2a-5 under the 1940 Act governing fund valuation practices. The rule establishes certain requirements for determining fair value in good faith, and defines when market quotations are considered to be "readily available" for purposes of the 1940 Act. We continue to monitor and assess the impact that this provision may have on the Company's consolidated financial statements.
We historically invested in privately held companies, the securities of which are inherently illiquid. We are currently focused on investing in what we believe are deeply undervalued microcapitalization publicly traded companies. Our publicly traded and public company-related securities account for approximately 69 percent of the value of our portfolio of investments. Although these companies are publicly traded, their stock may not trade at high volumes and/or we may own a significant portion of a company's outstanding stock, which may restrict our ability to sell our positions in an orderly fashion and prices at which sales can be made may be volatile and materially different than the closing prices of such positions at each financial statement date. We may also be subject to restrictions on transfer and/or other lock-up provisions after these companies complete public offerings and/or if we invest in unregistered securities of public companies. Many of our legacy privately held and publicly traded companies tend to not have attained profitability, and many of these companies also lack management depth and have limited or no history of operations. Because of the speculative nature of our investments and the lack of a liquid market for and restrictions on transfers of privately held investments, there is greater risk of loss relative to traditional marketable investment securities.
Approximately 39 percent of our portfolio was fair valued and comprised of securities of legacy privately held companies and rights to potential future milestone payments, as well as our warrants of OpGen, Inc. and Potbelly Corporation (Level 3 investments) which are securities of publicly traded companies and our membership units of LS180 Acquisition Holdings, LLC and Parabellum Acquisition Holdings, LLC (Level 3 investments) which are holding companies for special purpose acquisition company (SPAC) interests. Because there is typically no public or readily ascertainable market for our interests in the small privately held companies in which we invest, the valuation of the securities in that portion of our portfolio is determined in good faith by our Valuation Committee, which is comprised of all of the independent members of our Board of Directors. The values are determined in accordance with our Valuation Procedures and are subject to significant estimates and judgments. The fair value of the securities in our portfolio may differ significantly from the values that would be placed on these securities if a ready market for the securities existed. Additionally, inputs may become available after a financial statement date that could result in a material change in value at a future financial statement date from the value reported in the current financial statements. Any changes in valuation are recorded in the Company's Consolidated Statement of Operations as "Change in unrealized appreciation (depreciation) on investments." Changes in valuation of any of our investments in privately held companies from one period to another may be significant.
Diversification Risk
While we are subject to certain diversification requirements regarding the concentration of investments in any one industry or group of industries, we do not choose investments based on a strategy of diversification. We also do not rebalance the portfolio should one of our portfolio companies increase in value substantially relative to the rest of the portfolio. Therefore, the value of our portfolio may be more vulnerable to microeconomic events affecting a single sector, industry or portfolio company and to general macroeconomic events that may be unrelated to our portfolio companies. These factors may subject the value of our portfolio to greater volatility than a company that follows a diversification strategy. As of June 30, 2022 our largest 10 investments by value accounted for approximately 79 percent of the value of our investment portfolio. Our largest three investments, by value, AgBiome, LLC, Potbelly Corporation, and Arena Group Holdings, Inc., accounted for approximately 16 percent, 11 percent and 9 percent, respectively, of our investment portfolio at June 30, 2022. AgBiome, LLC, is a privately held portfolio company and Potbelly Corporation and Arena Group Holdings, Inc. are publicly traded companies.
Interest Rate Risk
Interest rate sensitivity refers to the change in earnings that may result from changes in the level of interest rates. We may invest in both short- and long-term U.S. government and agency securities. To the extent that we invest in short- and long-term U.S. government and agency securities, changes in interest rates result in changes in the value of these obligations that result in an increase or decrease of our net asset value. The level of interest rate risk exposure at any given point in time depends on the market environment, the expectations of future price and market movements, and the quantity and duration of long-term U.S. government and agency securities held by the Company, and it will vary from period to period.
In addition, market interest rates for high-yield corporate debt may be an input in determining value of our investments in debt securities of privately held and publicly traded companies. Significant changes in these market rates could affect the value of our debt securities as of the valuation date of measurement of value. While we do not currently have any investments in debt securities with floating interest rates, investment income in such securities should we acquire them in the future could be adversely affected by changes in interest rates, including any that might result from the anticipated transition away from the London Interbank Offered Rate ("LIBOR"). In March 2021, LIBOR's administrator announced that most LIBOR settings will no longer be published after the end of 2021, and that a majority of U.S. dollar LIBOR settings will no longer be published after June 30, 2023. To the extent we acquire investments with floating interest rates tied to LIBOR, this transition could result in losses for the Company.
Foreign Currency Risk
Our investments are not subject to foreign currency risk as they are all denominated in U.S. dollars. We have one investment in a company based in Canada, D-Wave Systems, Inc., however the price per share and terms of those shares are denominated in U.S. dollars.
Coronavirus (COVID-19) Pandemic
In March 2020, the World Health Organization declared COVID-19 (a novel coronavirus) to be a pandemic. Global financial markets have experienced and may continue to experience significant volatility resulting from the spread of COVID-19. The outbreak of COVID-19 has resulted in travel and border restrictions, quarantines, supply chain disruptions, lower consumer demand and general market uncertainty. The global economy, the economies of certain nations and individual issuers have been and may continue to be adversely affected by COVID-19, particularly in light of the interconnectivity between economies and financial markets, all of which may negatively impact the Company's performance. In addition, COVID-19 and governmental responses to COVID-19 may negatively impact the capabilities of the Company's service providers and disrupt the Company's operations.
Beginning in the first quarter of 2021, there has been a trend in many parts of the world of increasing availability and administration of vaccines against COVID-19, as well as an easing of restrictions on social, business, travel and government activities and functions. On the other hand, infection rates and regulations continue to fluctuate in various regions and there are ongoing global impacts resulting from the pandemic, including challenges and increases in costs for logistics and supply chains, such as increased port congestion, intermittent supplier delays and a shortfall of microchip supply. Management of the Company will continue to monitor the impact of COVID-19 on its business.
NOTE 4. FAIR VALUE OF INVESTMENTS
At June 30, 2022, our financial assets valued at fair value were categorized as follows in the fair value hierarchy:
| | | | | | | | | | | | | | | | | | | | | | | | | | |
| | | Fair Value Measurement at Reporting Date Using: |
Description | | Unadjusted Quoted Prices in Active Markets for Identical Assets (Level 1) | |
Significant Other Observable Inputs (Level 2) | |
Significant Unobservable Inputs (Level 3) | | June 30, 2022 |
| Legacy Privately Held Securities: | | | | | | | | |
| Preferred Stock / Units | | $ | 0 | | | $ | 0 | | | $ | 21,087,924 | | | $ | 21,087,924 | |
| Bridge / Promissory Notes | | 0 | | | 0 | | | 0 | | | 0 | |
| Common Stock / Membership Units | | 0 | | | 0 | | | 24,641 | | | 24,641 | |
| Warrants | | 0 | | | 0 | | | 0 | | | 0 | |
| LLC Interests | | 0 | | | 0 | | | 225,000 | | | 225,000 | |
| | | | | | | | |
| Publicly Traded and Public-Related Portfolio Companies: | | | | | | | | |
| | | | | | | | |
| Bridge / Promissory Notes | | $ | 0 | | | $ | 0 | | | $ | 7,500 | | | $ | 7,500 | |
| Common Stock / Membership Units | | 48,618,401 | | | 0 | | | 5,963,133 | | | 54,581,534 | |
| Warrants | | 0 | | | 0 | | | 232,632 | | | 232,632 | |
| Total Investments: | | $ | 48,618,401 | | | $ | 0 | | | $ | 27,540,830 | | | $ | 76,159,231 | |
| | | | | | | | |
| Other Financial Instruments: | | | | | | | | |
| Rights to Milestone Payments | | $ | 0 | | | $ | 0 | | | $ | 3,290,766 | | | $ | 3,290,766 | |
| Total Financial Assets: | | $ | 48,618,401 | | | $ | 0 | | | $ | 30,831,596 | | | $ | 79,449,997 | |
Significant Unobservable Inputs
The table below presents the valuation technique and quantitative information about the significant unobservable inputs utilized by the Company in the fair value measurements of Level 3 assets. Unobservable inputs are those inputs for which little or no market data exists and, therefore, require an entity to develop its own assumptions.
| | | | | | | | | | | | | | | | | | | | | | | |
| Value as of June 30, 2022 | | Valuation Approach(es) | | Unobservable Input(s) | | Range(s) (Weighted Average(a)) |
| | | | | | | |
| | | | | | | |
| | | | | Price Per Share | | $0.48 - $5.93 ($5.50) |
| | | | | Volatility | | 73.0% - 82.2% (81.5%) |
| Preferred Stock / Units | $ | 13,673,057 | | | Hybrid Approach | | Time to Exit / Cash Flows (Years) | | 0.0 - 5.0 (5.0) |
| | | | | | | |
| | | | | Price Per Share | | $0.00 - $0.30 ($0.24) |
| | | | | Public Comparable Adjustment (Including Non-Performance Risk) | | -90.0% - -70.1% (-80.2%) |
| | | | | Volatility | | 82.0% - 98.2% (90.0%) |
| Preferred Stock / Units | 1,189,423 | | | Income Approach | | Time to Exit / Cash Flows (Years) | | 5.0 (5.0) |
| | | | | Probability of Achieving Independent Milestones | | 75.0% (75.0%) |
| | | | | | | |
| | | | | Volatility | | 106.9% (106.9%) |
| | | | | Public Comparable Adjustment (Including Non-Performance Risk) | | -44.8% (-44.8%) |
| | | | | | | |
| | | | | Time to Exit/Lapse of Restrictions (Years) | | 0.2 (0.2) |
| | | | | Discount for Lack of Marketability | | 10.6% (10.6%) |
| Preferred Stock / Units | 6,225,444 | | | Market Approach | | Price Per Share | | $0.38 - $8.85 ($8.57) |
| Bridge Notes / Promissory Notes | 7,500 | | | Income Approach | | Estimated Value to Cost Ratio at Payout | | 0.05 (0.05) |
| | | | | | | |
| | | | | | | |
| | | | | | | |
| | | | | | | |
| | | | | | | |
| | | | | | | |
| | | | | Public Comparable Adjustment (Including Non-Performance Risk) | | -90.0% (-90.0%) |
| | | | | Volatility | | 82.0% (82.0%) |
| | | | | Time to Exit (Years) | | 5.0 (5.0) |
| Common Stock / Membership Units | 8,227 | | | Income Approach | | Price Per Share | | $0.21 ($0.21) |
| | | | | Probability of Successful SPAC Merger Transaction | | 75% (75%) |
| | | | | | | |
| | | | | | | |
| | | | | | | |
| | | | | Volatility | | 94.1% (94.1%) |
| | | | | Time to Exit/Lapse of Restrictions (Years) | | 0.2 (0.2) |
| | | | | Discount for Lack of Marketability | | 8.3% (8.3%) |
| Common Stock / Membership Units | 5,979,547 | | | Market Approach | | Price Per Share | | $0.000 - $0.006 ($0.006) |
| | | | | Price Per Share | | $0.00 ($0.00) |
| | | | | Volatility | | 0.0% - 117.7% (66.1%) |
| Warrants | 232,632 | | | Income Approach | | Time to Exit (Years) | | 0.0 - 3.6 (3.6) |
| LLC Profit Interests | 225,000 | | | Market Approach | | Bid/Ask | | $150,000-$300,000 ($225,000) |
| | | | | Probability of Achieving Independent Milestones | | 25.0% - 100.0% (25.0%) |
| | | | | Probability of Achieving Dependent Milestones | | 6.3% - 18.3% (9.8%) |
| Rights to Milestone Payments | 3,290,766 | | | Income Approach | | Time to Cash Flows (Years) | | 0.4 - 10.5 (8.1) |
| | | | | | | |
| | | | | | | |
| Total | $ | 30,831,596 | | | | | | | |
(a) Weighted average based on fair value at June 30, 2022.
Valuation Methodologies and Inputs for Level 3 Assets
The following sections describe the valuation techniques and significant unobservable inputs used to measure Level 3 assets.
Preferred Stock, Preferred Units, LLC Interests, Bridge Notes, Common Stock and Common Units
Preferred stock, preferred units, LLC interests, bridge notes, common stock and common units are valued by either a market, income or hybrid approach using internal models with inputs, most of which are not market observable. Common inputs for valuing Level 3 investments include prices from recently executed private transactions in a company’s securities or unconditional firm offers, revenue multiples of comparable publicly traded companies, merger and acquisition ("M&A") transactions consummated by comparable companies, discounts for lack of marketability, rights and preferences of the class of securities we own as compared with other classes of securities the portfolio company has issued, particularly related to potential liquidity scenarios of an initial public offering ("IPO") or an acquisition transaction, estimated time to exit, volatilities of comparable publicly traded companies and management’s best estimate of risk attributable to non-performance risk. Certain securities are valued using the present value of future cash flows.
We may also consider changes in market values for sets of comparable companies when recent private transaction information is not available and/or in consideration of non-performance risk. We define non-performance risk as the risk that the price per share (or implied valuation of a portfolio company) or the effective yield of a debt security of a portfolio company, as applicable, does not appropriately represent the risk that a portfolio company with negative cash flow will be: (a) unable to raise capital, will need to be shut down and will not return our invested capital; or (b) able to raise capital, but at a valuation significantly lower than the implied post-money valuation of the last round of financing. We assess non-performance risk for each private portfolio company quarterly. Our assessment of non-performance risk typically includes an evaluation of the financial condition and operating results of the company, the company's progress towards milestones, and the long-term potential of the business and technology of the company and how this potential may or may not affect the value of the shares owned by us. An increase to the non-performance risk or a decrease in the private offering price of a future round of financing from that of the most recent round would result in a lower fair value measurement and/or a change in the distribution of value among the classes of securities we own.
Option pricing models place a high weighting on liquidation preferences, which means that small differences in how the preferences are structured can have a material effect on the fair value of our securities at the time of valuation and also on future valuations should additional rounds of financing occur with senior preferences. As such, valuations calculated by option pricing models may not increase if 1) rounds of financing occur at higher prices per share, 2) liquidation preferences include multiples on investment, 3) the amount of invested capital is small and/or 4) liquidation preferences are senior to prior rounds of financing. Additionally, an increase in the volatility assumption generally increases the enterprise value calculated in an option pricing model. An increase in the time to exit assumption also generally increases the enterprise value calculated in an option pricing model. Variations in the expected time to exit or expected volatility assumptions have a significant impact on fair value.
Bridge notes commonly contain terms that provide for the conversion of the full amount of principal, and sometimes interest, into shares of preferred stock at a defined price per share and/or the price per share of the next round of financing. The use of a discount for non-performance risk in the valuation of bridge notes would indicate the potential for conversion of only a portion of the principal, plus interest when applicable, into shares of preferred stock or the potential that a conversion event will not occur and that the likely outcome of a liquidation of assets would result in payment of less than the remaining principal outstanding of the note. An increase in non-performance risk would result in a lower fair value measurement.
Warrants
We use the Black-Scholes-Merton option-pricing model to determine the fair value of warrants held in our portfolio unless there is a publicly traded active market for such warrants or another indication of value such as a sale of the portfolio company. Option pricing models, including the Black-Scholes-Merton model, require the use of subjective input assumptions, including expected volatility, expected life, expected dividend rate, and expected risk-free rate of return. In the Black-Scholes-Merton model, variations in the expected volatility or expected term assumptions have a significant impact on fair value. Because certain securities underlying the warrants in our portfolio are not publicly traded, many of the required input assumptions are more difficult to estimate than they would be if a public market for the underlying securities existed.
An input to the Black-Scholes-Merton option-pricing model is the value per share of the type of stock for which the warrant is exercisable as of the date of valuation. This input is derived according to the methodologies discussed in "Preferred Stock, Preferred Units, LLC Interests, Bridge Notes, Common Stock and Common Units."
Rights to Milestone Payments
Rights to milestone payments are valued using a probability-weighted discounted cash flow model. As part of Amgen Inc.’s acquisition of our former portfolio company, BioVex Group, Inc., we are entitled to potential future milestone payments based upon the achievement of certain regulatory and sales milestones. We are also entitled to future payments from the acquisition of TARA Biosystems, Inc. by Valo Health, LLC. We assign probabilities to the achievements of the various milestones. Milestones identified as independent milestones can be achieved irrespective of the achievement of other contractual milestones. Dependent milestones are those that can only be achieved after another, or series of other, milestones are achieved. The interest rates used in these models are observable inputs from sources such as the published interest rates for corporate bonds of the acquiring or comparable companies.
Changes in Valuation Approaches
During the period ended June 30, 2022, the following changes in valuation methodology occurred since December 31, 2021:
•We changed the valuation methodology of our securities of Nanosys, Inc., from the market approach to the hybrid approach to reflect financing and business related inputs.
•We changed the valuation methodology of our securities of LS180 Acquisition Holdings, LLC from the market approach to the income approach to reflect the expectation the entity will be liquidated.
The following chart shows the components of change in the financial assets categorized as Level 3 for the period ended June 30, 2022.
| | | | | | | | | | | | | | | | | | | | | | | | | | | | | | | | | | | | | | | | | | | | | | | |
| | Beginning
Balance
1/1/2022 | | Total
Realized
Gains (Loss)
Included in
Changes in
Net Assets | | Transfers | | Total
Unrealized
(Depreciation) Appreciation
Included in
Changes in
Net Assets | | Investments in
Portfolio
Companies and
Interest on
Bridge Notes | | Disposals
and
Settlements | | Ending
Balance
6/30/2022 | | Amount of Total
(Depreciation) Appreciation for the
Period Included in
Changes in Net
Assets Attributable
to the Change in
Unrealized Gains or
Losses Relating to
Assets Still Held at
the Reporting Date |
| | | | | | | | | | | | | | | |
| Preferred Stock/Units | $ | 26,324,664 | | | $ | (2,876,147) | | 1 | $ | 0 | | | $ | 158,753 | | | $ | 0 | | | $ | (2,519,346) | | 2 | $ | 21,087,924 | | | $ | (2,485,695) | |
| | | | | | | | | | | | | | | |
| Bridge/Promissory Notes | 100,000 | | | (50,000) | | 1 | 0 | | | (92,500) | | | 50,000 | | | 0 | | | 7,500 | | | (142,500) | |
| | | | | | | | | | | | | | | |
| Common Stock/Membership Units | 7,099,715 | | | 560,716 | | 1 | 0 | | | (1,111,901) | | | 0 | | | (560,756) | | 2 | 5,987,774 | | | (792,495) | |
| | | | | | | | | | | | | | | |
| Warrants | 259,979 | | | 0 | | | 0 | | | (27,347) | | | 0 | | | 0 | | | 232,632 | | | (27,347) | |
| | | | | | | | | | | | | | | |
| LLC Interests | 225,000 | | | 0 | | | 0 | | | 0 | | | 0 | | | 0 | | | 225,000 | | | 0 | |
| | | | | | | | | | | | | | | |
| Rights to Milestone Payments | 8,012,759 | | | 5,990,170 | | 1 | 0 | | | (1,414,017) | | | 3,012,461 | | 2 | (12,310,607) | | | 3,290,766 | | | (122,115) | |
| | | | | | | | | | | | | | | |
| Total | $ | 42,022,117 | | | $ | 3,624,739 | | | $ | 0 | | | $ | (2,487,012) | | | $ | 3,062,461 | | | $ | (15,390,709) | | | $ | 30,831,596 | | | $ | (3,570,152) | |
1 Represents gross realized gains or gross realized losses.
2 The Company received Right to Milestone Payments from Acquisition of TARA Biosystems, Inc. as consideration for its investment in Preferred Stock and Common Stock.
We elected to use beginning of the year values to recognize transfers in and out of Level 3 investments, when transfers occur.
NOTE 5. INDUSTRY DIVERSIFICATION
The following table shows the percentage of our net assets invested by industry as of June 30, 2022. | | | | | | | | | | | | | | | | | | | | | | | |
| Industry | Value as of June 30, 2022 | | % of Net Assets | | Value as of June 30, 2022 | | % of Net Assets |
| Advertising | | | | | $ | 5,130,838 | | | 5.9% |
| Unaffiliated Portfolio Companies | $ | 5,130,838 | | | 5.9% | | | | |
| Non-Controlled Affiliated Portfolio Companies | 0 | | | 0.0% | | | | |
| Controlled Affiliated Portfolio Companies | 0 | | | 0.0% | | | | |
| Application Software | | | | | 5,738,798 | | | 6.6% |
| Unaffiliated Portfolio Companies | 0 | | | 0.0% | | | | |
| Non-Controlled Affiliated Portfolio Companies | 5,738,798 | | | 6.6% | | | | |
| Controlled Affiliated Portfolio Companies | 0 | | | 0.0% | | | | |
| Asset Management & Custody Banks | | | | | 225,000 | | | 0.3% |
| Unaffiliated Portfolio Companies | 225,000 | | | 0.3% | | | | |
| Non-Controlled Affiliated Portfolio Companies | 0 | | 0.0% | | | | |
| Controlled Affiliated Portfolio Companies | 0 | | 0.0% | | | | |
| Biotechnology | | | | | 373,329 | | | 0.4% |
| Unaffiliated Portfolio Companies | 373,329 | | | 0.4% | | | | |
| Non-Controlled Affiliated Portfolio Companies | 0 | | | 0.0% | | | | |
| Controlled Affiliated Portfolio Companies | 0 | | | 0.0% | | | | |
| Communications Equipment | | | | | 2,284,488 | | | 2.6% |
| Unaffiliated Portfolio Companies | 2,284,488 | | | 2.6% | | | | |
| Non-Controlled Affiliated Portfolio Companies | 0 | | | 0.0% | | | | |
| Controlled Affiliated Portfolio Companies | 0 | | | 0.0% | | | | |
| Construction Machinery & Heavy Trucks | | | | | 2,032,910 | | | 2.3% |
| Unaffiliated Portfolio Companies | 2,032,910 | | | 2.3% | | | | |
| Non-Controlled Affiliated Portfolio Companies | 0 | | 0.0% | | | | |
| Controlled Affiliated Portfolio Companies | 0 | | 0.0% | | | | |
| Electronic Manufacturing Services | | | | | 1,412,131 | | | 1.6% |
| Unaffiliated Portfolio Companies | 1,412,131 | | | 1.6% | | | | |
| Non-Controlled Affiliated Portfolio Companies | 0 | | | 0.0% | | | | |
| Controlled Affiliated Portfolio Companies | 0 | | | 0.0% | | | | |
| Fertilizers & Agricultural Chemicals | | | | | 12,609,086 | | | 14.6% |
| Unaffiliated Portfolio Companies | 12,609,086 | | | 14.6% | | | | |
| Non-Controlled Affiliated Portfolio Companies | 0 | | | 0.0% | | | | |
| Controlled Affiliated Portfolio Companies | 0 | | | 0.0% | | | | |
| Health Care Equipment | | | | | 513,752 | | | 0.6% |
| Unaffiliated Portfolio Companies | 0 | | | 0.0% | | | | |
| Non-Controlled Affiliated Portfolio Companies | 513,752 | | | 0.6% | | | | |
| Controlled Affiliated Portfolio Companies | 0 | | | 0.0% | | | | |
| | | | | | | |
| | | | | | | |
| | | | | | | |
| | | | | | | |
| Health Care Technology | | | | | 532,896 | | | 0.6% |
| Unaffiliated Portfolio Companies | 0 | | | 0.0% | | | | |
| Non-Controlled Affiliated Portfolio Companies | 532,896 | | | 0.6% | | | | |
| Controlled Affiliated Portfolio Companies | 0 | | | 0.0% | | | | |
| | | | | | | |
| | | | | | | | | | | | | | | | | | | | | | | |
| Industry | Value as of June 30, 2022 | | % of Net Assets | | Value as of June 30, 2022 | | % of Net Assets |
| Interactive Media & Services | | | | | $ | 7,123,905 | | | 8.2% |
| Unaffiliated Portfolio Companies | $ | 0 | | | 0.0% | | | | |
| Non-Controlled Affiliated Portfolio Companies | 7,123,905 | | | 8.2% | | | | |
| Controlled Affiliated Portfolio Companies | 0 | | | 0.0% | | | | |
| Pharmaceuticals | | | | | 3,084,853 | | | 3.6% |
| Unaffiliated Portfolio Companies | 3,084,853 | | | 3.6% | | | | |
| Non-Controlled Affiliated Portfolio Companies | 0 | | | 0.0% | | | | |
| Controlled Affiliated Portfolio Companies | 0 | | | 0.0% | | | | |
| Research & Consulting Services | | | | | 206,828 | | | 0.2% |
| Unaffiliated Portfolio Companies | 206,828 | | | 0.2% | | | | |
| Non-Controlled Affiliated Portfolio Companies | 0 | | | 0.0% | | | | |
| Controlled Affiliated Portfolio Companies | 0 | | | 0.0% | | | | |
| Restaurants | | | | | 8,813,123 | | | 10.2% |
| Unaffiliated Portfolio Companies | 0 | | | 0.0% | | | | |
| Non-Controlled Affiliated Portfolio Companies | 8,813,123 | | | 10.2% | | | | |
| Controlled Affiliated Portfolio Companies | 0 | | | 0.0% | | | | |
| Specialized Finance | | | | | 5,970,633 | | | 6.9% |
| Unaffiliated Portfolio Companies | 0 | | | 0.0% | | | | |
| Non-Controlled Affiliated Portfolio Companies | 0 | | | 0.0% | | | | |
| Controlled Affiliated Portfolio Companies | 5,970,633 | | | 6.9% | | | | |
| Specialty Chemicals | | | | | 1,063,971 | | | 1.2% |
| Unaffiliated Portfolio Companies | 1,063,971 | | | 1.2% | | | | |
| Non-Controlled Affiliated Portfolio Companies | 0 | | | 0.0% | | | | |
| Controlled Affiliated Portfolio Companies | 0 | | | 0.0% | | | | |
| Specialty Stores | | | | | $1,371,092 | | 1.6% |
| Unaffiliated Portfolio Companies | 1,371,092 | | | 1.6% | | | | |
| Non-Controlled Affiliated Portfolio Companies | 0 | | | 0.0% | | | | |
| Controlled Affiliated Portfolio Companies | 0 | | | 0.0% | | | | |
| Steel | | | | | 2,519,664 | | | 2.9% |
| Unaffiliated Portfolio Companies | 2,519,664 | | | 2.9% | | | | |
| Non-Controlled Affiliated Portfolio Companies | 0 | | | 0.0% | | | | |
| Controlled Affiliated Portfolio Companies | 0 | | | 0.0% | | | | |
| Technology Hardware, Storage & Peripherals | | | | | 12,591,347 | | | 14.5% |
| Unaffiliated Portfolio Companies | 12,591,347 | | | 14.5% | | | | |
| Non-Controlled Affiliated Portfolio Companies | 0 | | | 0.0% | | | | |
| Controlled Affiliated Portfolio Companies | 0 | | | 0.0% | | | | |
| Trading Companies & Distributors | | | | | 4,870,324 | | | 5.6% |
| Unaffiliated Portfolio Companies | 4,870,324 | | | 5.6% | | | | |
| Non-Controlled Affiliated Portfolio Companies | 0 | | | 0.0% | | | | |
| Controlled Affiliated Portfolio Companies | 0 | | | 0.0% | | | | |
| | | | | | | |
| | | | | | | |
| | | | | | | |
| | | | | | | |
| Miscellaneous Common Stocks Industries | | | | | 981,029 | | | 1.1% |
| Unaffiliated Portfolio Companies | 981,029 | | | 1.1% | | | | |
| Non-Controlled Affiliated Portfolio Companies | 0 | | 0.0% | | | | |
| Controlled Affiliated Portfolio Companies | 0 | | 0.0% | | | | |
| Total | $ | 79,449,997 | | | | | $ | 79,449,997 | | | |
NOTE 6. DERIVATIVES
We also purchased call options during the period. A call option gives its holder the right to buy a specific security at a specific price (known as the exercise strike price) by a certain date.
Transactions in call options during the period ended June 30, 2022, were as follows:
| | | | | | | | | | | | | | |
| | Number of Contracts | | Premium |
| Call options outstanding as of December 31, 2021 | | 0 | | $ | 0 | |
| Call options purchased | | 220 | | (174,765) | |
| Purchased call options expired | | (220) | | | 210,674 | |
| Call options as of June 30, 2022 | | 0 | | $ | 35,909 | |
| | | | |
The following table presents the effect of derivatives held during the period ended June 30, 2022, along with the respective location in the consolidated financial statements.
CONSOLIDATED STATEMENT OF ASSETS AND LIABILITIES:
| | | | | | | | | | | | | | | | | | | | | | | | | | | | | |
| | Assets | | Liabilities | |
| Derivatives | | Location | | Fair Value | | Location | | Fair Value | |
| Warrants for the purchase of Common Stock of Potbelly Corporation expiring 2/12/26 | | Investments | | $ | 232,632 | | | -- | | -- | |
| | | | | | | | | |
| Warrants for the purchase of Common Stock of Magnolia Neurosciences Corporation expiring 8/3/28 | | Investments | | 0 | | | -- | | -- | |
| | | | | | | | | |
| Warrants for the purchase of Series A-3 Preferred Stock of NanoTerra, Inc. expiring 11/15/22 | | Investments | | 0 | | | -- | | -- | |
| | | | | | | | | |
| Warrants for the purchase of Common Stock of OpGen, Inc. expiring 2/17/25 | | Investments | | 0 | | | -- | | -- | |
| | | | | | | | | |
| | | | | | | | | |
CONSOLIDATED STATEMENT OF OPERATIONS:
| | | | | | | | | | | | | | | | | | | | | | | |
| Derivatives | | Location | | Net Realized Gain (Loss) | | Net Change in Unrealized Appreciation (Depreciation) | |
| Warrants for the purchase of Common Stock of Potbelly Corporation expiring 2/12/26 | | Net Realized Gain (Loss) and Unrealized Appreciation (Depreciation) on Investments | | $ | 0 | | | $ | 27,319 | | |
| | | | | | | |
| Warrants for the purchase of Common Stock of Magnolia Neurosciences Corporation expiring 8/3/28 | | Net Realized Gain (Loss) and Unrealized Appreciation (Depreciation) on Investments | | 0 | | | (54,666) | | |
| | | | | | | |
| Warrants for the purchase of Series A-3 Preferred Stock of NanoTerra, Inc. expiring 11/15/22 | | Net Realized Gain (Loss) and Unrealized Appreciation (Depreciation) on Investments | | 0 | | | 0 | | |
| | | | | | | |
| Warrants for the purchase of Common Stock of OpGen, Inc. expiring 2/17/25 | | Net Realized Gain (Loss) and Unrealized Appreciation (Depreciation) on Investments | | 0 | | | 0 | | |
| | | | | | | |
| Exchange Traded Fund Options | | Net Realized Gain (Loss) and Unrealized Appreciation (Depreciation) on Investments | | 35,909 | | | 0 | | |
NOTE 7. OFFICERS' AND BOARD OF DIRECTORS' COMPENSATION
The aggregate compensation (salaries, 401(k) employer match, medical and dental benefits) paid by the Company during the period ended June 30, 2022, to its officers amounted to approximately $684,000. In addition, and similar to prior years, the Compensation Committee awarded a deferred bonus in 2021 to certain of the Company's officers of $944,048 payable only upon achievement of certain metrics defined by the Compensation Committee over the next two years, starting 2022. As of June 30, 2022, there is no accrual for this payment as such deferred bonuses were deemed not likely to be paid as of that date. This determination may change in future quarters and a portion or all of the deferred bonus could be paid.
In addition, and similar to prior years, the Compensation Committee awarded a deferred bonus as of December 31, 2021, to certain of the Company's officers of $212,190 payable only upon achievement of certain metrics defined by the Compensation Committee over the next two years, starting 2020. As of December 31, 2021, $106,095 was paid. No further accrual as of June 30, 2022, was made as such deferred bonuses were deemed not likely to be paid as of that date. This determination may change in future quarters and a portion or all of the deferred bonus could be paid.
As of June 30, 2022, $25,000 in a potential bonus was accrued for certain non-investment employees and is included in the Company's Consolidated Statement of Assets and Liabilities. The ultimate payment of this bonus at the end of the year is at the discretion of the Compensation Committee.
The aggregate compensation paid by the Company to the independent members of its Board of Directors during the period ended June 30, 2022 was $143,750.
Certain officers and directors currently and may in the future serve as members of the board of directors of our portfolio companies, including our controlled portfolio companies. These officers and directors do not receive any compensation for serving in such roles directly from the portfolio companies. Any such cash compensation paid by portfolio companies to members of their respective boards of directors is paid directly to the Company. In the case of securities-based compensation (restricted stock or stock options), the officer or director due such compensation assigns all beneficial interest, including but not limited to economic benefit and voting control, to such securities over to the Company.
NOTE 8. EMPLOYEE BENEFITS
401(k) Plan
We adopted a 401(k) Plan covering substantially all of our employees. Matching contributions to the plan are at the discretion of the Compensation Committee. For the period ended June 30, 2022, the Compensation Committee approved a 100 percent match, which amounted to $47,500.
Medical Benefit Retirement Plan
We historically administered a plan to provide medical and dental insurance for retirees and their spouses who, at the time of their retirement, attained certain years of service with us and a certain age (the "Medical Benefit Retirement Plan"). On April 27, 2017, the Board of Directors terminated the plan. The termination does not affect benefits accrued by former employees who are grandfathered under the former terms of the plan, and the termination of the plan does not affect benefits accrued by certain former employees who were grandfathered under the amended terms of the plan. The Medical Benefit Retirement Plan was terminated for all other employees.
Executive Mandatory Retirement Benefit Plan
On May 5, 2011, the Board of Directors terminated the Amended and Restated Executive Mandatory Retirement Benefit Plan. Our former President accrued benefits under this plan prior to his retirement, and the termination of this plan has no impact on his accrued benefits. At June 30, 2022 we had $166,388 accrued for benefits for this former employee under the plan, which is included in "Post-retirement plan liabilities" on the Company's Consolidated Statement of Assets and Liabilities.
NOTE 9. INCOME TAXES
The Company filed for the 1999 tax year to elect treatment as a RIC under Subchapter M of the Code and qualified for the same treatment for the years 2000 through 2015, as well as 2017 and 2019. The Company did not qualify as a RIC under Subchapter M of the Code in 2016, 2018, 2020, and 2021. The Company did not have net taxable income in any of 2016, 2018, 2020 or 2021, so the failure to qualify as a RIC did not result in a tax liability for the Company. We currently intend to qualify as a RIC in 2022, but we cannot guarantee we will do so. To the extent the Company is taxed as a C-Corporation in a given year, the Company is permitted to use historical operating loss carryforwards to offset income and gains for tax purposes.
Under certain circumstances, even if we qualified for Subchapter M treatment for a given year, we might act in a subsequent year to ensure that we would be taxed in that subsequent year as a C Corporation, rather than as a RIC. We will fail to qualify for RIC tax treatment for a taxable year if we do not satisfy the 90 percent Income Test, the Diversification Tests or Annual Distribution Requirement for such year. In the event we do not satisfy the 90 percent Income Test, Diversification Tests or the Annual Distribution Requirement for any taxable year, we will be subject to federal tax with respect to all our taxable income, whether or not distributed. In addition to the corporate tax that would be paid by the Company, all our distributions to shareholders in that situation generally will be taxable as ordinary dividends and generally subject to up to a 30 percent withholding tax if received by a non-U.S. shareholder, although such dividends may qualify for long-term capital gain treatment as "qualified dividends" for U.S. shareholders meeting certain holding period requirements. If the aggregate values of our non-qualifying assets remain below 50 percent of total assets and no non-qualifying asset represents more than 25 percent of the total assets, we will continue to pass the Diversification Tests. Rather than selling portfolio companies that are performing well in order to pass our RIC diversification tests, we may opt instead not to qualify as a RIC. We will choose to take such action only if we believe that the result of the action will benefit the Company and our shareholders.
Historically, we invested in D-Wave Systems, Inc. through Parallel Universes, Inc., a Delaware company ("Parallel Universes"), which held shares of D-Wave Systems, Inc. through a Canadian limited company, 4169841 Canada Ltd. ("Canco"). On April 14, 2020, D-Wave Systems, Inc. reorganized as a subsidiary of a new company, DWSI Holdings, Inc. ("DWSI"). This structure could have resulted in taxation at the Parallel Universes and/or CanCo levels on realized gains on the shares of D-Wave Systems that would not be offset by any current or carryforward losses of the Company. In October 2020, CanCo distributed our shares of DWSI to Parallel Universes in a return of capital. Parallel Universes then distributed the shares to 180PH in exchange for 180PH's ownership of Parallel Universes. As of that date, 180PH directly owned shares of DWSI and no longer had direct or indirect ownership of Parallel Universes or CanCo. As such, future realized gains, if any, on the Company's shares of D-Wave Systems may be able to be offset by current or carryforward losses of the Company should such losses exist at the time of realization. In January 2021, D-Wave Systems completed an amalgamation of the reorganized business and changed its corporate name back to D-Wave Systems, Inc.
The Company's status as a RIC is irrevocable, but qualification is measured annually. Given the Company's status as a RIC and that the ability or inability to use such operating loss carryforwards depends on qualification metrics measured in each taxable year separate from prior years, the Company does not include a deferred tax asset and valuation allowance on its Consolidated Statement of Assets and Liabilities.
For federal tax purposes, the Company’s 2018 through 2020 tax years remain open for examination by the tax authorities under the normal three-year statute of limitations. Generally, for New Jersey state tax purposes, the Company’s 2017 through 2020 tax years remain open for examination by the tax authorities under a four-year statute of limitations. The Company will file its 2021 federal and state taxes.
For the period ended June 30, 2022, the Company recorded a consolidated expense of $3,163 in federal, state and local income taxes.
We paid federal, state and local taxes on behalf of Ventures, which was taxed as a C Corporation.
For the period ended June 30, 2022, the Company recorded aggregate unrealized depreciation of $8,302,513, net unrealized depreciation of $29,588,857 and net unrealized depreciation is $21,286,344. The aggregate book cost of investments is $87,752,510. For the period ended June 30, 2022, the Company was in a loss position and therefore did not have any undistributed ordinary income and/or undistributed long-term capital gains.
As of December 31, 2021, we had post-enactment loss carryforwards under the provisions of the Regulated Investment Company Modernization Act of 2010 (the "Act") in aggregate of $18,235,217, long term. Capital gains for the year ended December 31, 2021, were $2,091,597 and can be offset again capital losses from prior periods. As of December 31, 2021, we had cumulative capital losses, which were offset against losses during years when the Company failed as a RIC, totaling $14,836,653, which may be carried back 3 years or carried forward 5 years. As of December 31, 2021, we had cumulative capital losses, which were derived during years when the Company qualified as a RIC, totaling $3,398,564. Post-enactment losses have no expiration date in years where we qualify as a RIC.
On December 22, 2017, the Tax Cuts and Jobs Act of 2017 (the "2017 Act") was enacted, which among other changes, lowered the tax rates for corporations and how future loss carryforwards can be used against future gains. The change of the federal corporate tax rate from 35 percent to 21 percent in the 2017 Act may impact future decisions regarding the issuance of deemed dividends should the Company failed to qualify as a RIC under Subchapter M of the Code and be in a net taxable gain position on investments.
NOTE 10. COMMITMENTS AND CONTINGENCIES
Portfolio companies may seek additional capital in the future and any decision by the Company to not participate in the round of financing could result in outcomes that negatively impact the value of the Company's securities of those portfolio companies.
On March 23, 2017, we signed a month-to-month lease for approximately 1,250 square feet of office space located at 7 N. Willow Street, Suite 4B, Montclair, New Jersey ("Montclair Office"). On November 17, 2021, we signed a lease extension for our Montclair Office through December 31, 2024. Upon an event of default, the lease provides that the landlord may terminate the lease and require us to pay all rent that would have been payable during the remainder of the lease or until the date the landlord re-enters the premises.
NOTE 11. PORTFOLIO PURCHASES AND SALES
During the period ended June 30, 2022:
| | | | | | | | | | | | | | |
| Company | | Purchases/Cost | | Sales Proceeds/Distributions |
| Alta Equipment Group, Inc. | | $ | 1,143,055 | | | $ | 0 | |
Arena Group Holdings, Inc.(1) | | 1,117,536 | | | 0 | |
| Armstrong Flooring, Inc. | | 19,992 | | | 1,558,865 | |
| Commercial Vehicle Group, Inc. | | 2,243,577 | | | 0 | |
| comScore, Inc. | | 2,258,403 | | | 102,556 | |
| Envela Corporation | | 14,670 | | | 0 | |
| Enzo Biochen, Inc. | | 0 | | | 663,898 | |
| Intevac, Inc. | | 2,609,570 | | | 0 | |
| Lantronix, Inc. | | 831,302 | | | 486,897 | |
| LS180 Acquisition Holdings, LLC | | 50,000 | | | 0 | |
| Potbelly Corporation | | 17,638 | | | 0 | |
| PFSWeb, Inc. | | 0 | | | 1,815,923 | |
| Quantum Corporation | | 3,130,090 | | | 0 | |
| RF Industries, Ltd. | | 92,537 | | | 0 | |
| Synalloy Corporation | | 6,290 | | | 3,345,028 | |
| Synchronoss Technologies, Inc. | | 1,460,458 | | | 16,763 | |
Miscellaneous Common Stocks(2) | | 981,732 | | | 774,864 | |
| Total Publicly Traded Equity and Equity-Related Securities Purchase/Cost and Sales Proceeds/Distributions | | $ | 15,976,850 | | | $ | 8,764,794 | |
| | | | |
TARA Biosystems, Inc.(3) | | $ | 0 | | | $ | 3,080,102 | |
| Rights to Milestone Payments from Acquisition of Petra Pharma Corporation | | 0 | | | 12,310,608 | |
Rights to Milestone Payments from Acquisition of TARA Biosystems, Inc.(3) | | 3,012,461 | | | 0 | |
| Total Legacy Privately Held Equity and Equity-Related Securities Cost and Distributions | | $ | 3,012,461 | | | $ | 15,390,710 | |
| Total Purchases/Cost and Sales Proceeds/Distributions | | $ | 18,989,311 | | | $ | 24,155,504 | |
Note: The table above does not include transactions in short-term call options whose maturities at the time of acquisition were one year or less during the period ended June 30, 2022.
(1) During the period ended June 30, 2022, the Company received common stock of Arena Group Holdings, Inc. in lieu of cash valued at $897,724.
(2) Miscellaneous Common Stocks are unrestricted common stocks of publicly traded companies that the Company has not disclosed publicly.
(3) During the period ended June 30, 2022, the Company received distributions of cash of $67,641 and rights to milestone payments from the acquisition of TARA Biosystems, Inc., valued at $3,012,461.
NOTE 12. SHARE REPURCHASE PROGRAM
On February 22, 2022, our Board reauthorized the repurchase of up to $2.5 million of the Company's common stock within a six-month period from the date of notice to investors, which notice was mailed on or about February 28, 2022. As of June 30, 2022, no repurchase had occurred.
On August 5, 2022, our Board reauthorized the repurchase of up to $2.5 million of the Company's common stock within a six-month period from the date of notice to investors, which notice will be mailed on or about August 12, 2022.
NOTE 13. SUBSEQUENT EVENTS
The Company has evaluated subsequent events as of June 30, 2022, through the date these financial statements, and include the following:
On August 5, 2022, the Company's legacy portfolio company, D-Wave Systems, Inc., completed its merger with DPCM Capital, Inc. to form a new public company, D-Wave Quantum, Inc. ("QBTS"). The Company owns approximately 900,000 shares of QBTS and is subject to a lockup agreement that prevents any sale, hedge or other transaction related to these shares for four-to-six months following the merger date depending on certain trading of QBTS stock beginning three months after the merger date.
NOTE 14. INVESTMENTS AND ADVANCES TO AFFILIATES - SCHEDULE 12-14 (UNAUDITED)
| | | | | | | | | | | | | | | | | | | | | | | | | | | | | | | | | | | | | | | | | | | | | | | | | | |
| Name of Issuer | | Title of Issue or Nature of Indebtedness (A) | | Amount of Dividends or Interest Credited to Income (B) | | Net Realized Gain (Loss) | | Value as of December 31, 2021 | | Gross Additions (C) | | Gross Reductions (D) | | Net Change in Unrealized Appreciation (Depreciation) | | Value as of June 30, 2022 |
| CONTROLLED AFFILIATED PRIVATELY HELD COMPANIES(E): | | | | | | | | | | | | | | | | |
| LS180 Acquisition Holdings, LLC | | Membership Units | | $ | 0 | | | $ | 0 | | | $ | 13,000 | | | $ | 0 | | | $ | (13,000) | | | $ | (13,000) | | | $ | 0 | |
| | Promissory Note | | 0 | | | 0 | | | 100,000 | | | 0 | | | (92,500) | | | (142,500) | | | 7,500 | |
| Parabellum Acquisition Holdings, LLC | | Membership Units | | $ | 0 | | | $ | 0 | | | $ | 6,719,700 | | | $ | 0 | | | $ | (756,567) | | | $ | (756,567) | | | $ | 5,963,133 | |
| Total Non-Controlled Affiliated Privately Held Companies | | | | $ | 0 | | | $ | 0 | | | $ | 6,832,700 | | | $ | 0 | | | $ | (862,067) | | | $ | (912,067) | | | $ | 5,970,633 | |
| NON-CONTROLLED AFFILIATED PRIVATELY HELD COMPANIES(F): | | | | | | | | | | | | | | | | |
| EchoPixel, Inc. | | Series Seed Convertible Preferred Stock | | $ | 0 | | | $ | 0 | | | $ | 520,097 | | | $ | 0 | | | $ | (243,827) | | | $ | (243,827) | | | $ | 276,270 | |
| | Series Seed-2 Convertible Preferred Stock | | 0 | | | 0 | | | 186,084 | | | 0 | | | (86,966) | | | (86,966) | | | 99,118 | |
| | Series A-2 Convertible Preferred Stock | | 0 | | | 0 | | | 238,390 | | | 0 | | | (100,026) | | | (100,026) | | | 138,364 | |
| Essential Health Solutions, Inc. | | Series A Convertible Preferred Stock | | $ | 0 | | | $ | (2,750,000) | | | $ | 0 | | | $ | 0 | | | $ | 0 | | | $ | 2,750,000 | | | $ | 0 | |
| | Common Stock | | 0 | | | (20) | | | 0 | | | 0 | | | 0 | | | 20 | | | 0 | |
| | Convertible Bridge Note | | 0 | | | (50,000) | | | 0 | | | 0 | | | 0 | | | 50,000 | | | 0 | |
| HALE.life Corporation | | Common Stock | | $ | 0 | | | $ | 0 | | | $ | 31,155 | | | $ | 0 | | | $ | (22,928) | | | $ | (22,928) | | | $ | 8,227 | |
| | Series Seed-1 Convertible Preferred Stock | | 0 | | | 0 | | | 561,053 | | | 0 | | | (326,878) | | | (326,878) | | | 234,175 | |
| | Series Seed-2 Convertible Preferred Stock | | 0 | | | 0 | | | 668,023 | | | 0 | | | (377,529) | | | (377,529) | | | 290,494 | |
| TARA Biosystems, Inc. | | Common Stock | | $ | 0 | | | $ | (20) | | | $ | 319,446 | | | $ | 0 | | | $ | (319,446) | | | $ | (319,426) | | | $ | 0 | |
| | Series A Convertible Preferred Stock | | 0 | | | 418,181 | | | 2,670,081 | | | 0 | | | (2,670,081) | | | (124,588) | | | 0 | |
| | Series A-2 Convertible Preferred Stock | | 0 | | | 16,427 | | | 80,964 | | | 0 | | | (80,964) | | | 19,037 | | | 0 | |
| Total Non-Controlled Affiliated Privately Held Companies | | | | $ | 0 | | | $ | (2,365,432) | | | $ | 5,275,293 | | | $ | 0 | | | $ | (4,228,645) | | | $ | 1,216,889 | | | $ | 1,046,648 | |
| | | | | | | | | | | | | | | | |
| | | | | | | | | | | | | | | | | | | | | | | | | | | | | | | | | | | | | | | | | | | | | | | | | | |
| Name of Issuer | | Title of Issue or Nature of Indebtedness (A) | | Amount of Dividends or Interest Credited to Income (B) | | Net Realized Gain (Loss) | | Value as of December 31, 2021 | | Gross Additions (C) | | Gross Reductions (D) | | Net Change in Unrealized Appreciation (Depreciation) | | Value as of June 30, 2022 |
| NON-CONTROLLED AFFILIATED PUBLICLY TRADED SECURITIES(F): | | | | | | | | | | | | | | | | |
| Arena Group Holdings, Inc. | | Common Stock | | $ | 0 | | | $ | 0 | | | $ | 9,993,959 | | | $ | 0 | | | $ | (2,870,054) | | | $ | (3,987,590) | | | $ | 7,123,905 | |
| Potbelly Corporation | | Common Stock | | $ | 0 | | | $ | 0 | | | $ | 8,454,610 | | | $ | 125,881 | | | $ | 0 | | | $ | 108,243 | | | $ | 8,580,491 | |
| | Warrants for Common Stock | | 0 | | | 0 | | | 205,313 | | | 27,319 | | | 0 | | | 27,319 | | | 232,632 | |
| Synchronoss Technologies, Inc. | | Common Stock | | $ | 0 | | | $ | (9,846) | | | $ | 9,961,490 | | | $ | 0 | | | $ | (4,222,692) | | | $ | (5,656,541) | | | $ | 5,738,798 | |
| Total Non- Controlled Affiliated Publicly Traded Securities | | | | $ | 0 | | | $ | (9,846) | | | $ | 28,615,372 | | | $ | 153,200 | | | $ | (7,092,746) | | | $ | (9,508,569) | | | $ | 21,675,826 | |
| Total Non- Controlled Affiliated Privately Held Companies and Publicly Traded Securities | | | | $ | 0 | | | $ | (2,375,278) | | | $ | 40,723,365 | | | $ | 153,200 | | | $ | (12,183,458) | | | $ | (9,203,747) | | | $ | 28,693,107 | |
(A)Common stock, warrants, membership units and, in some cases, preferred stock are generally non-income producing and restricted. The principal amount of debt and the number of shares of common and preferred stock and number of membership units are shown in the accompanying Consolidated Schedule of Investments as of June 30, 2022.
(B)Represents the total amount of interest or dividends credited/(debited) to income for the portion of the period an investment was a control or affiliate investment, as appropriate. Amounts credited to preferred or common stock represent accrued bridge note interest related to conversions that occurred during the period ended June 30, 2022.
(C)Gross additions include increases in investments resulting from new portfolio investments, paid-in-kind interest or dividends, the amortization of discounts and fees. Gross additions also include net increases in unrealized appreciation or decreases in unrealized depreciation.
(D)Gross reductions include decreases in investments resulting from principal collections related to investment repayments or sales, the amortization of premiums and acquisition costs. Gross reductions also include net increases in unrealized depreciation or decreases in unrealized appreciation.
(E)"Controlled Affiliated" is defined as investments in which we own 25 percent or more of the outstanding voting rights of the portfolio company or otherwise control the company, including control of a majority of the seats on the board of directors, or more than 25 percent of the seats on the board of directors, with no other entity or person in control of more director seats than us.
(F)"Non-Controlled Affiliated" is defined as ownership of five percent or more, but less than 25 percent, of the voting shares of the portfolio company, or where we hold the right to appoint one or more members to the portfolio company’s board of directors, but less than 25 percent of the members of the board of directors.
| | | | | | | | | | | | | | | | | | | | | | | | | | | | | |
| Line for Schedule of Investments | Method / Level | | Primary Industry | | # of Shares Purchased/Principal | | Cost of TURN's Investment | | Valuation |
| Controlled Affiliated Equity and Equity-Related Securities | | | | | | | | | |
| LS180 Acquisition Holdings, LLC | | | Specialized Finance | | | | | | |
| Membership Units (acquired 4/13/21) | (I) (L3) | | | | 1,300,000 | | $ | 13,000 | | | $ | 0 | |
| Unsecured Promissory Note, 0% (acquired 5/10/2021, maturing 12/31/22) | (I) (L3) | | | | $ | 50,000 | | | 50,000 | | | 2,500 | |
| Unsecured Promissory Note, 0% (acquired 9/7/21, maturing 12/31/22) | (I) (L3) | | | | $ | 50,000 | | | 50,000 | | | 2,500 | |
| Unsecured Promissory Note, 0% (acquired 1/27/22, maturing 12/31/22) | (I) (L3) | | | | $ | 50,000 | | | 50,000 | | | 2,500 | |
| | | | | | | $ | 163,000 | | | $ | 7,500 | |
| Parabellum Acquisition Holdings, LLC | | | Specialized Finance | | | | | | |
| Membership Units (acquired 4/22/21) | (M) (L3) | | | | 693,151 | | $ | 2,717,646 | | | $ | 5,963,133 | |
| Total Controlled Affiliated Equity and Equity-Related Securities (6.9%) | | | | | | | $ | 2,880,646 | | | $ | 5,970,633 | |
| | | | | | | | | |
| Non-Controlled Affiliated Publicly Traded Equity and Equity-Related Securities | | | | | | | | | |
| Arena Group Holdings, Inc. | | | Interactive Media & Services | | | | | | |
| Common Stock (acquired 12/18/20-1/24/22) | (M) (L1) | | | | 791,545 | | | $ | 9,117,536 | | | $ | 7,123,905 | |
| Potbelly Corporation | | | Restaurants | | | | | | |
| Common Stock (acquired 6/24/19-2/24/22) | (M) (L1) | | | | 1,518,671 | | | $ | 6,720,177 | | | $ | 8,580,491 | |
| Synchronoss Technologies, Inc. | | | Application Software | | | | | | |
| Common Stock (acquired 7/17/20-6/30/22) | (M) (L1) | | | | 4,990,259 | | | $ | 12,281,774 | | | $ | 5,738,798 | |
| Total Non-Controlled Affiliated Publicly Traded Equity and Equity-Related Securities (24.7%) | | | | | | | $ | 28,119,487 | | | $ | 21,443,194 | |
| | | | | | | | | |
| | | | | | | | | | | | | | | | | | | | | | | | | | | | | |
| Line for Schedule of Investments | Method / Level | | Primary Industry | | # of Shares Purchased/Principal | | Cost of TURN's Investment | | Valuation |
| Legacy Privately Held Equity and Equity-Related Securities | | | | | | | | | |
| EchoPixel, Inc. | | | Health Care Equipment | | | | | | |
| Series Seed Convertible Preferred Stock (acquired 6/21/13-6/30/14) | (I) (L3) | | | | 4,194,630 | | | $ | 1,250,000 | | | $ | 276,270 | |
| Series Seed-2 Convertible Preferred Stock (acquired 1/22/16) | (I) (L3) | | | | 1,476,668 | | | 500,000 | | | 99,118 | |
| Series A-2 Convertible Preferred Stock (acquired 3/23/17) | (I) (L3) | | | | 1,471,577 | | | 350,000 | | | 138,364 | |
| | | | | | | $ | 2,100,000 | | | $ | 513,752 | |
| HALE.life Corporation | | | Health Care Technology | | | | | | |
| Common Stock (acquired 3/1/16) | (I) (L3) | | | | 1,000,000 | | | $ | 10 | | | $ | 8,227 | |
| Series Seed-1 Convertible Preferred Stock (acquired 3/28/17) | (I) (L3) | | | | 11,000,000 | | | 1,896,920 | | | 234,175 | |
| Series Seed-2 Convertible Preferred Stock (acquired 12/28/18) | (I) (L3) | | | | 12,083,132 | | 2,500,000 | | 290,494 |
| | | | | | | $ | 4,396,930 | | | $ | 532,896 | |
| Total Non-Controlled Affiliated Legacy Privately Held Equity and Equity-Related Securities (1.2%) | | | | | | | $ | 6,496,930 | | | $ | 1,046,648 | |
| Non-Controlled Affiliated Derivative Securities | | | | | | | | | |
| Potbelly Corporation | | | Restaurants | | | | | | |
| Warrants for the Purchase of Common Stock expiring 2/12/26 (acquired 2/10/21) | (I) (L3) | | | | 80,605 | | | $ | 224,849 | | | $ | 232,632 | |
| Total Non-Controlled Affiliated Derivative Securities (0.3%) | | | | | | | $ | 224,849 | | | $ | 232,632 | |
| Total Non-Controlled Affiliated Securities (26.2%) | | | | | | | $ | 34,841,266 | | | $ | 22,722,474 | |
| | | | | | | | | |
| Total Controlled Affiliated and Non-Controlled Affiliated Equity and Equity-Related Securities (33.1%) | | | | | | | $ | 37,721,912 | | | $ | 28,693,107 | |
Privacy Policy
We are committed to protecting your privacy. This privacy notice explains the privacy policies of 180 Degree Capital Corp. and its affiliates. This notice supersedes any other privacy notice you may have received from 180 Degree Capital Corp.
Generally, we do not receive any non-public personal information relating to our shareholders, although certain non-public personal information of our shareholders may become available to us. We maintain physical, electronic, and procedural safeguards, according to strict standards of security and confidentiality, all information we receive about you. The only information we collect from you is your name, address, and number of shares you hold. This information is used only so that we can send you annual reports and other information about us, and send you proxy statements or other information required by law. When the Company shares non-public shareholder personal information referred to above, the information is made available for limited business purposes and under controlled circumstances designed to protect our shareholders' privacy. We do not permit use of shareholder information for any non-business or marketing purpose, nor do we permit third parties to rent, sell, trade or otherwise release or disclose information to any other party.
We do not share this information with any non-affiliated third party except as described below.
•180 Degree Capital Corp. and affiliate employees. It is our policy that only our authorized employees who need to know your personal information will have access to it. Our personnel who violate our privacy policy are subject to disciplinary action.
•Service Providers. We may disclose your personal information to companies that provide services on our behalf, such as record keeping and mailing you information. These companies are required to protect your information and use it solely for the purpose for which they received it.
•Courts and Government Officials. If required by law, we may disclose your personal information in accordance with a court order or at the request of government regulators. Only that information required by law, subpoena, or court order will be disclosed.
Annual Meeting of Shareholders
The Company held its Annual Meeting of Shareholders on April 20, 2022. The following votes were cast for directors:
| | | | | | | | | | | | | | |
| For | % Voted For | Withheld | % Vote Withheld |
| Stacy R. Brandom | 6,990,200 | 95.7% | 313,928 | 4.3% |
| Tonia L. Pankopf | 6,987,823 | 95.7% | 316,306 | 4.3% |
| Kevin M. Rendino | 6,995,024 | 95.8% | 309,105 | 4.2% |
| Richard P. Shanley | 6,986,724 | 95.7% | 317,404 | 4.3% |
| Parker A. Weil | 6,986,377 | 95.6% | 317,752 | 4.4% |
| Daniel B. Wolfe | 6,996,990 | 95.8% | 307,139 | 4.2% |
The following votes were cast to ratify PricewaterhouseCoopers LLP as the Company's independent public accounting firm for the fiscal year ending December 31, 2022:
| | | | | | | | |
| For | Against | Abstain |
| 7,205,730 | 54,054 | 44,344 |
| 98.7% | 0.7% | 0.6% |
Proxy Voting
We vote proxies relating to our portfolio securities in the best interest of our shareholders. We review on a case-by-case basis each proposal submitted to a shareholder vote to determine its impact on the portfolio securities held by us. Although we generally vote against proposals that may have a negative impact on our portfolio securities, we may vote for such a proposal if there exists compelling long-term reasons to do so.
Our proxy voting decisions are made by our Portfolio Managers, who are responsible for monitoring each of our investments. To ensure that our vote is not the product of a conflict of interest, we require that: (i) anyone involved in the decision making process disclose to our Chief Compliance Officer any potential conflict that he or she is aware of and any contact that he or she has had with any interested party regarding a proxy vote; and (ii) employees involved in the decision making process or vote administration are prohibited from revealing how we intend to vote on a proposal in order to reduce any attempted influence from interested parties.
Information regarding how the Company voted proxies relating to portfolio securities during the most recent 12-month period ended June 30 is available, without charge, upon request, by calling the Company toll-free at 833-293-1769 and on the SEC's website at http://www.sec.gov.
Portfolio Holdings
The Company files its complete schedule of portfolio holdings with the SEC for the first and third quarters of each fiscal year on Form N-PORT. The Company's Forms N-PORT are available on the SEC's website at http://www.sec.gov and may be reviewed and copied at the SEC's Public Reference Room in Washington D.C. Information on the operation of the Public Reference Room may be obtained by calling 1-800-SEC-0330.
180 Degree Capital Corp.*
Board of Directors
| | | | | | | | |
Stacy R. Brandom1,2,3,4 | Tonia L. Pankopf1,2,4 | Kevin M. Rendino6 |
Richard P. Shanley1,2,3,4,5 | Parker A. Weil1,2,3,4 | Daniel B. Wolfe |
1. Member of Audit Committee 2. Member of Valuation Committee 3. Member of Compensation Committee
4. Member of Nominating Committee 5. Lead Independent Director 6. Chairman of the Board
* The Statement of Additional Information includes additional information about the Directors and is available, without charge, upon request, by calling 973-746-4500 or email ir@180degreecapital.com.
Officers
| | | | | |
| Kevin M. Rendino | Chairman, Chief Executive Officer and Portfolio Manager |
| Daniel B. Wolfe | President, Chief Financial Officer, Chief Compliance Officer and Portfolio Manager |
| Alicia M. Gift | Senior Controller, Secretary and Treasurer |
| Robert E. Bigelow III | Vice President, Head of Fund Development |
7 N. Willow Street, Suite 4B
Montclair, New Jersey 07042
Phone: 973-746-4500 Fax: 973-746-4508
Website: www.180degreecapital.com Email: ir@180degreecapital.com
Counsel: Schulte Roth & Zabel LLP
Independent Registered Public Accounting Firm: PricewaterhouseCoopers LLP
Custodian of Securities: US Bank, N.A.
Transfer Agent & Registrar: American Stock Transfer & Trust Company, LLC
Stockholder Relations Department
6201 15th Avenue
Brooklyn, New York 11219
877-260-8188
Website: www.astfinancial.com Email: info@astfinancial.com
HOUSEHOLDING OPT-OUT NOTICE
To reduce expenses, we may only mail one copy of the 180 Degree Capital Corp.'s shareholder updates, such as prospectus, annual report, semi-annual report, to those addresses shared by two or more accounts. If you are not a direct shareholder (i.e., you hold your shares of us in a brokerage account), please contact your financial institution to opt out of householding. If you are a direct shareholder (i.e., you hold your shares of us at our transfer agent) and wish to receive individual copies of these documents, please call us toll-free at 833-293-1769. We will begin sending you individual copies thirty days after receiving your request.
Item 2. Code of Ethics.
Not applicable to this semi-annual report.
Item 3. Audit Committee Financial Expert.
Not applicable to this semi-annual report.
Item 4. Principal Accountant Fees and Services.
Not applicable to this semi-annual report.
Item 5. Audit Committee List of Registrants.
Not applicable to this semi-annual report.
Item 6. Investments.
(a) The schedule of investments in securities of unaffiliated issuers is included as part of the report to stockholders filed under Item 1 of this form.
(b) Not applicable.
Item 7. Disclosure of Proxy Voting Policies and Procedures for Closed-End Management Investment Companies.
Not applicable to this semi-annual report.
Item 8. Portfolio Managers of Closed-End Management Investment Companies.
Not applicable to this semi-annual report.
Item 9. Purchases of Equity Securities by Closed-End Management Investment Company and Affiliated Purchasers.
| | | | | | | | | | | | | | |
| Year 2022 | (a) Total Number of Shares Purchased | (b) Average Price Paid Per Share | (c) Total Number of Shares Purchased as Part of Publicly Announced Plans or Programs | (d) Approximate Dollar Value of Shares that May Yet Be Purchased Under the Plans or Programs |
| 01/01 - 01/31 | 0 | | 0 | | 0 | | $ | 2,500,000 | |
| 02/01 - 02/28 | 0 | | 0 | | 0 | | 2,500,000 | |
| 03/01 - 03/31 | 0 | | 0 | | 0 | | 2,500,000 | |
| 04/01 - 04/30 | 0 | | 0 | | 0 | | 2,500,000 | |
| 05/01 - 05/31 | 0 | | 0 | | 0 | | 2,500,000 | |
| 06/01 - 06/30 | 0 | | 0 | | 0 | | 2,500,000 | |
| | | | |
| | | | |
| | | | |
| | | | |
| | | | |
| | | | |
| Total for Year | 0 | | | 0 | | |
On February 22, 2022, our Board reauthorized the repurchase of up to $2.5 million of the Company's common stock within a six-month period from the date of notice to investors, which notice was mailed on or about February 28, 2022. As of June 30, 2022, no repurchase had occurred.
On August 5, 2022, our Board reauthorized the repurchase of up to $2.5 million of the Company's common stock within a six-month period from the date of notice to investors, which notice will be mailed on or about August 12, 2022.
Item 10. Submission of Matters to a Vote of Shareholders.
There have been no material changes to the procedures by which shareholders may recommend nominees to the registrant's Board of Directors as set forth in the registrant's Proxy Statement, dated March 2, 2022.
Item 11. Controls and Procedures.
(a) Based on an evaluation of the Registrant's Disclosure Controls and Procedures (as defined in Rule 30a-3(c) under the Investment Company Act of 1940, the “Disclosure Controls”) as of a date within 90 days prior to the filing date (the “Filing Date”) of this Form N-CSR (the “Report”), the Chief Executive Officer (its principal executive officer) and Chief Financial Officer (its principal financial officer) have concluded that the Disclosure Controls are reasonably designed to ensure that information required to be disclosed by the Registrant in the Report is recorded, processed, summarized and reported by the Filing Date, including ensuring that information required to be disclosed in the Report is accumulated and communicated to the Registrant's management, including the Registrant's principal executive officer and principal financial officer, as appropriate to allow timely decisions regarding required disclosure.
(b) There were no changes in the Registrant’s internal control over financial reporting (as defined in Rule 30a-3(d) under the Investment Company Act of 1940) that occurred during period covered by this report that have materially affected or are reasonably likely to materially affect the Registrant’s internal control over financial reporting.
Item 12. Disclosure of Securities Lending Activities for Closed-End Management Investment Companies.
(a) Not applicable.
(b) Not applicable.
Item 13. Exhibits.
(a)(1) The Code of Conduct is available on the Company's website at https://ir.180degreecapital.com/governance-docs.
(a)(3) Not applicable.
(a)(4) Not applicable.
SIGNATURES
Pursuant to the requirements of the Securities Exchange Act of 1934 and the Investment Company Act of 1940, the Registrant has duly caused this report to be signed on its behalf by the undersigned, thereunto duly authorized.
180 DEGREE CAPITAL CORP.
| | | | | |
| By: | /s/ Daniel B. Wolfe |
| | Name: Daniel B. Wolfe |
| | Title: President and Chief Financial Officer |
| | |
| | Date: August 8, 2022 |
Pursuant to the requirements of the Securities Exchange Act of 1934 and the Investment Company Act of 1940, this report has been signed below by the following persons on behalf of the Registrant and in the capacities and on the dates indicated.
| | | | | | | | | | | | | | |
| By: | /s/ Kevin M. Rendino | | By: | /s/ Daniel B. Wolfe |
| | Name: Kevin M. Rendino | | | Name: Daniel B. Wolfe |
| | Title: Chief Executive Officer | | | Title: President and Chief Financial Officer |
| | (Principal Executive Officer) | | | (Principal Financial Officer) |
| | | | | |
| | Date: August 8, 2022 | | | Date: August 8, 2022 |