UNITED STATES
SECURITIES AND EXCHANGE COMMISSION
Washington, D.C. 20549
FORM N-CSR
CERTIFIED SHAREHOLDER REPORT OF REGISTERED
MANAGEMENT INVESTMENT COMPANY
Investment Company Act file number 811-07074
| | |
| 180 DEGREE CAPITAL CORP. |
| (Exact Name of Registrant as Specified in Its Charter) |
| | | | | | | | |
| 7 N. Willow Street, Suite 4B, Montclair NJ | | 07042 |
| (Address of Principal Executive Offices) | | (Zip Code) |
| | |
Daniel B. Wolfe
President and Chief Financial Officer
180 Degree Capital Corp.
7 N. Willow Street, Suite 4B
Montclair, NJ 07042 |
| (Name and address of agent for service) |
|
Copy to:
John J. Mahon, Esq.
Schulte Roth & Zabel, LLP
1152 Fifteenth Street, NW
Suite 850
Washington, DC 20005
(202) 729-7477 |
Registrant's telephone number, including area code: (973) 746-4500
Date of fiscal year end: December 31
Date of reporting period: December 31, 2022
Item 1. Report to Shareholders.
Fellow Shareholders,
"There are decades where nothing happens; and there are weeks where decades happen."
-- Vladimir Ilyich Lenin
It feels wrong somehow to be quoting Lenin given the destruction Putin’s Russia has caused in Ukraine, but destruction seems to be an appropriate word to sum up 2022. December of 2022 felt like a decade. The full year of 2022 felt like a century.
I thought it would be useful for me to sum up 180's year right at the beginning of this letter, rather than making you read seven pages (although I believe they will be an interesting read for you) before getting to the conclusion. After five years of exceptional performance, 2022 was anything but exceptional; put simply, we have a job to do, and we didn’t do it. While 2022 was a historically bad market, our performance during 2022 was disappointing, and we own that. The Russell Microcap Index was down 22%, and we were down more. Add it to the write-downs we took in the historical Harris & Harris Group portfolio, and 2022 couldn't end soon enough. We own a significant stake in TURN. Between Daniel and I, we own over 800,000 shares, or over 8% of TURN. When you include the other employees of TURN, who have all also purchased stock with after-tax dollars, this ownership percentage increases to almost 10% of TURN. We have had economic alignment with every shareholder of TURN from the day we arrived and that will never change for as long as I am in this seat. At the end of the day, the most important thing for us to achieve is a higher share price.
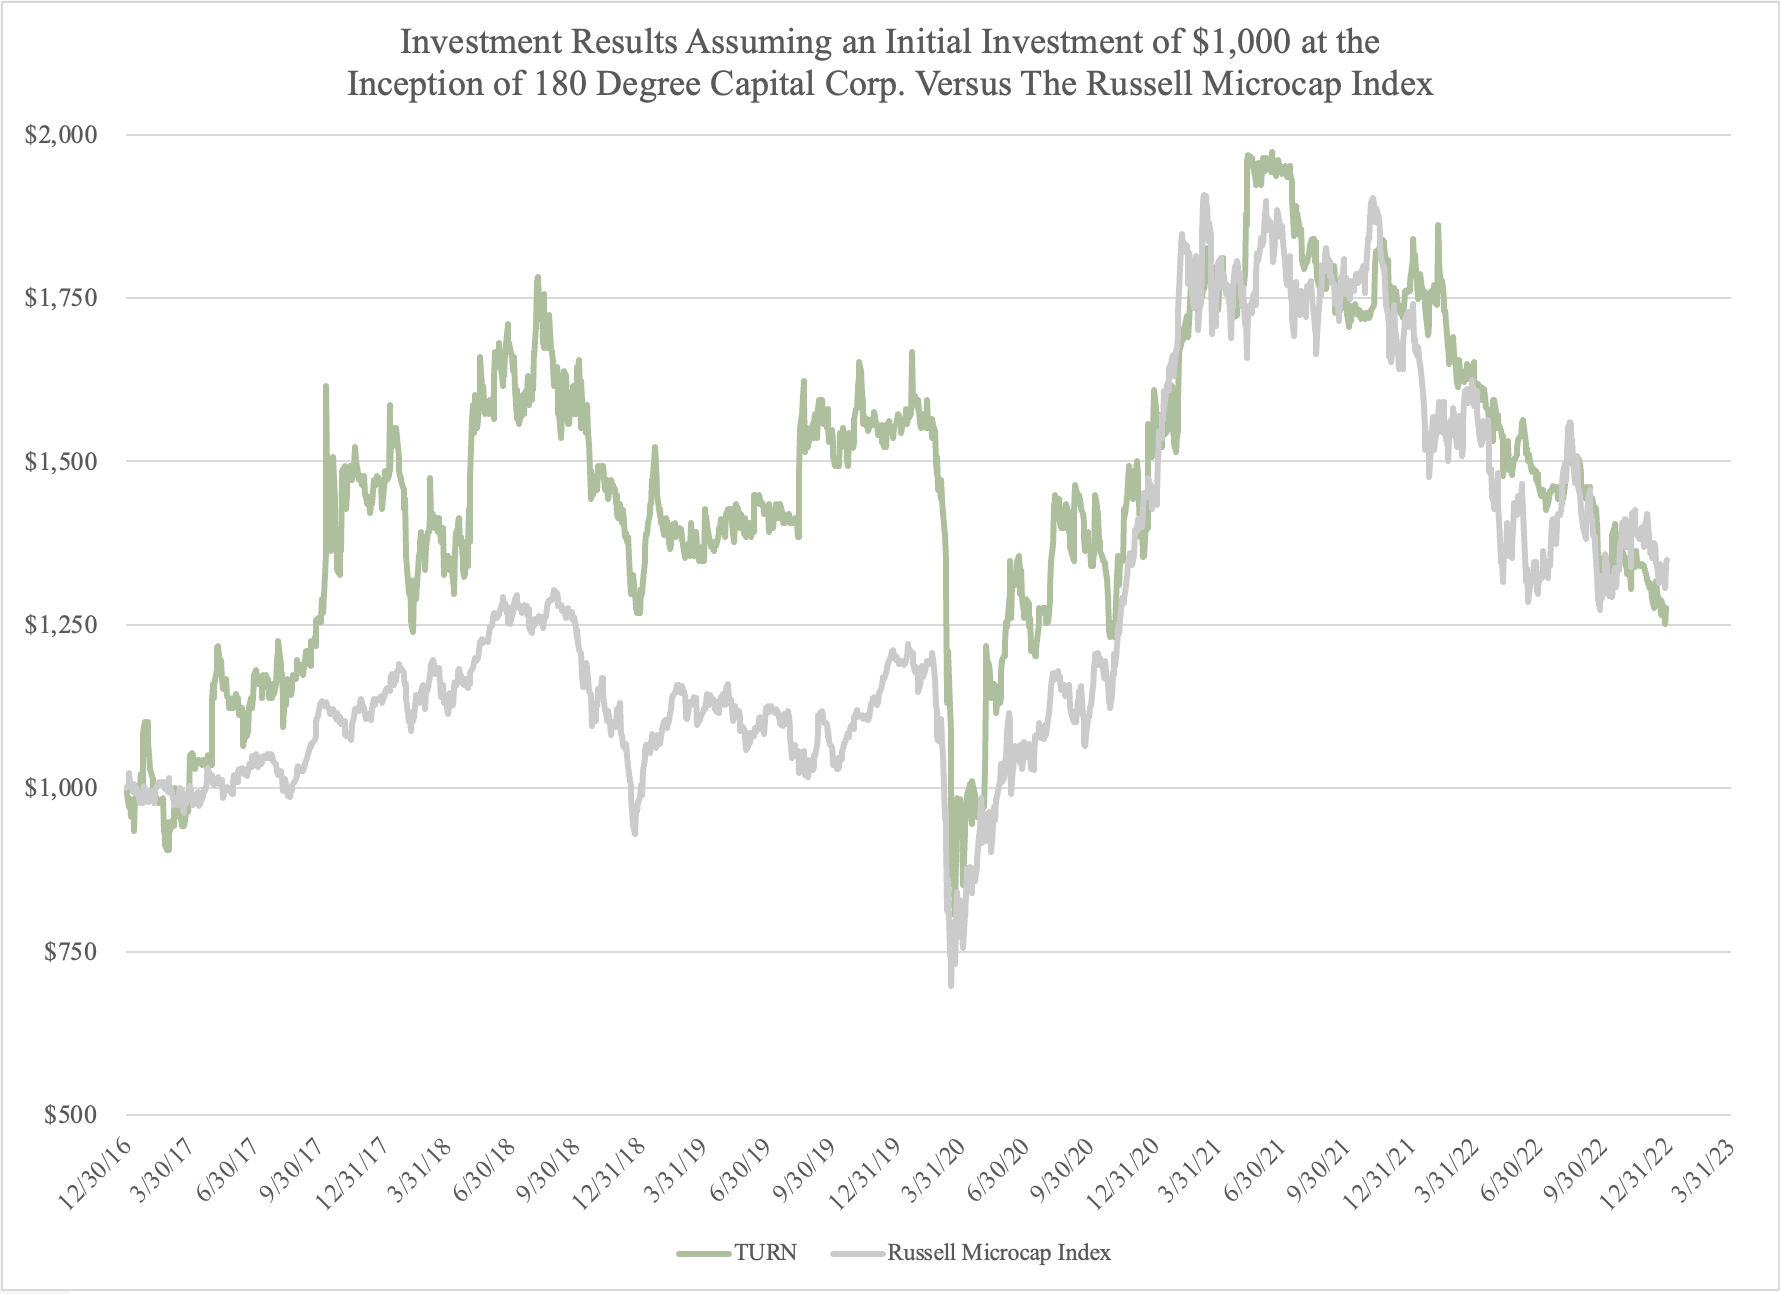
For the five years ending in 2021, our gross total return for our strategy in the public stock market including carried interest generated on our separately managed accounts (SMAs) was 405.5% versus 73.8% for the Russell Microcap Index. During that time and in many shareholder reports, I talked about the volatility that can occur when you run a concentrated portfolio of seven-to-ten names. Up until last year, we only experienced the “good” volatility. While losing money is never enjoyable, it should not be surprising that from time to time we are going to have periods where we come up well short of our expectations; 2022 was that year.
From the moment I arrived, I promised 100% transparency, both in good times and bad. In the down periods, the last thing I am ever going to do is sugar coat or make excuses. The reason for that is I have always believed that portfolio managers should be allowed to lose, though not every year and not often. If you have been in this business for a while and have never underperformed, then you have never managed money. I remember in one of my previous down years at a previous employer, I was out of town and my boss (a new one) was going to present our performance for a particular quarter to the mutual fund's Board; these presentations were fairly common and normal. Following the performance review with the Board, my boss called me during my travels, and instead of being direct with me, he was shifting his criticism of me on to the Board. I was miserable enough to begin with, so the last thing I needed was a non-supportive boss, especially considering the fact that my fund had rarely underperformed in the prior 11 years of managing money. I remember exactly where I was standing in Cincinnati, Ohio, while on my cell phone seething at the notion that after all these years, I wasn’t getting supported by my boss. To make matters worse, he had the audacity to make up fake criticism from the Board; as if that was meant to be some motivating or scare tactic. Trust me, I am no wallflower. I don’t need anyone telling me things will be fine when they aren't. I have a thick skin, and I don’t need validation from others. But I certainly had no time or patience for someone who was ready to pile on and use the Board as fake criticism. I knew damn well the Board, while not thrilled, would have completely understood that every PM struggles from time to time. So, after listening to my boss’s passive aggressive garbage for about ten minutes, I offered him the following response, “Do me a favor, either tell me to fly back to the office so you can fire me, or else I expect you to lend your full support of me and my team to the Board (who wasn’t even all that bothered to begin with). I am not going to listen to this. I feel badly enough not meeting the high expectations to which I hold myself accountable." Of course, the bully backed down.
After that conversation, I lost whatever respect I had for him. At the very next chance I could get, I made sure that the only way I would stay in the organization was if I didn’t have to report to him ever again. The point is, we take managing other people's money to heart, and when we fail, we suffer alongside every shareholder. By the way, you know how that story with my boss ends? Following that poor year, we had two of the best years we ever had. 2022 was a failing year. No way around that. We will give you the facts and offer commentary; but nary an excuse. In this letter, we will talk about our performance for what it was, and then move on to 2023. By the way, it’s worth noting that as of the close of business on February 23, 2023, our quarter-to-date gross total return for our public and public-related portfolio is up 14.8% vs 7.0% for the Russell Microcap Index.
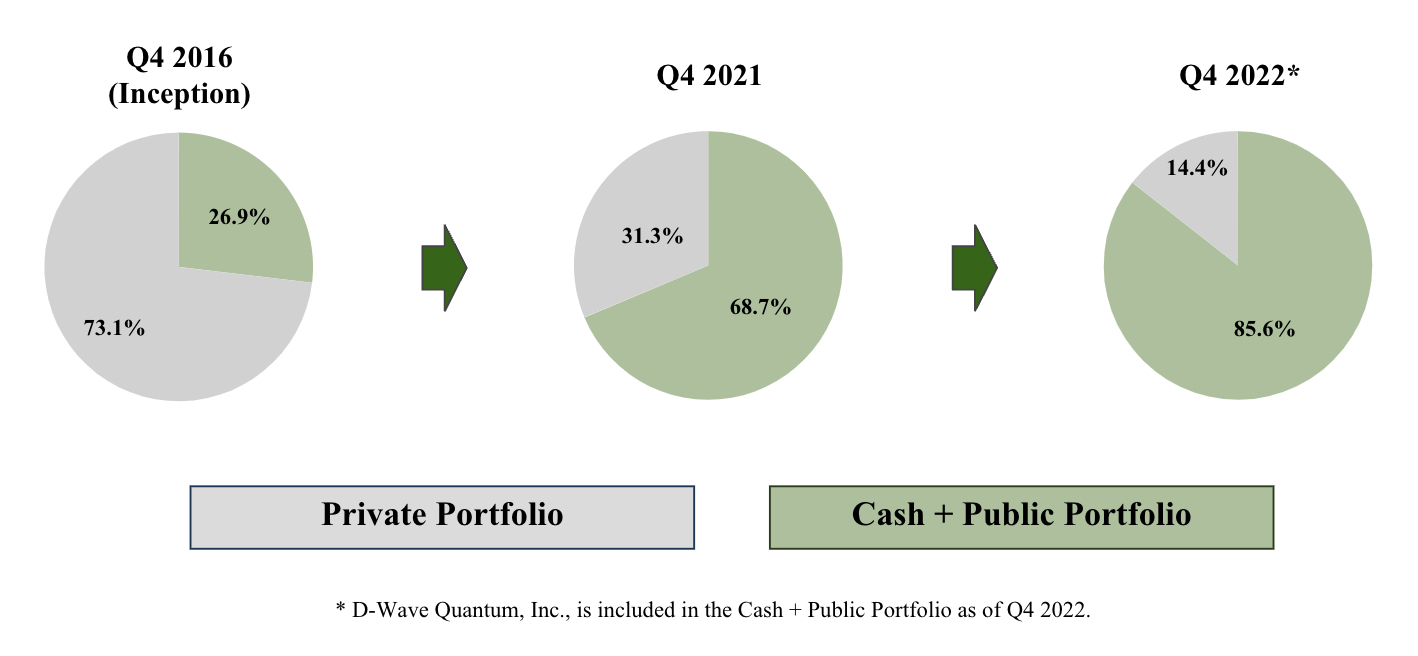
When we took over this business back in 2017, we inherited a balance sheet that had 73% of its invested assets and cash in illiquid securities of privately held companies, a completely failing business model because of bloated expenses, and a questionable track record for selecting VC investments. We have fought through the mistakes of the prior management team by achieving extraordinary performance in our public strategy from 2017-2021. Because of this strong performance in the public markets, the terrible performance of the legacy private portfolio was largely mitigated. In a bull market and for the five
years ended 2021, our legacy private portfolio generated net losses of approximately $7.4 million, or $0.71 per share.1 That’s quite the achievement, isn’t it? And, to make matters worse, in this past quarter we wrote down the value of several of our private holdings due to a number of factors including business-specific inputs and decreases in public market comparable companies, as applicable to each holding. Harris & Harris Group is truly the gift that keeps on giving as 65% of our Q4 2022 decline in net asset value per share (NAV) was generated from write downs in the value of AgBiome, LLC and D-Wave Quantum, Inc. The legacy Harris & Harris Group portfolio as a whole accounted for 71% of the decline in NAV.
Managing money is difficult and we take ownership of the things we can control; we will never ever hide from that. 2022 was made even more challenging due to the sins of Harris & Harris Group’s past; things over which we simply had little to no control. While that is infuriating to us, it is what it is and it's over. In this quarter alone, D-Wave cost us $5.5 million, or $0.53 per share, and AgBiome cost us $6.5 million, or $0.63 per share. Fortunately, the remaking of our company is for the most part over. As of December 31, 2022, we had over 86% of our total investment assets in our public markets-focused strategy and cash. The good news is our legacy private portfolio is now valued at less than 14% of our total NAV. Good riddance to 2022.
Many bubbles were popped in 2022, as the days of tripling your money in a matter of days or weeks in meme stocks evaporated once the Fed began raising rates, Russia waged war with Ukraine, and inflation began to rear its ugly head due to the unbalanced effect of COVID-19 impacting global supply chains. The Russell Microcap Index collapsed over 30% from its
November 2021 high, and the “don’t fight the Fed” folks forecasted a rather dire economic climate including the following scenarios that they and the markets were convinced with 100% certainty would occur:
1.This will be the worst recession we will have had in years.
2.Inflation will be with us forever.
3.This bear market will be with us for a very long time.
With 2022 in the rear view, and our sights on 2023, being Pollyannish isn’t part of our thinking as we acknowledge that rates are materially higher than where they were just 12 months ago, and this increase will no doubt have a dampening effect on global growth rates as well as equity valuations. Here is a nutshell of our views which will be supported by a number of charts and research we have come across in the last several months.
1.Our overall view is inflation peaked and the multitude of fed rate hikes have already had a significant effect in lowering inflation.
2.We believe we are already in some sort of a recession given real GDP has declined for more than 2 quarters in a row.
3.We do not believe we are headed for financial Armageddon like 2008 when we had $1.3 trillion of sub‑prime mortgage assets on the balance sheets of banks and insurance companies. The financial leverage simply doesn’t exist like it has in the past.
4.We believe stock price valuations have significantly discounted dire economic outlooks that are not occurring currently and may never occur.
5.We believe we are headed to a “normal” environment where the market can no longer rely on free money and the intravenous elixir of quantitative easing and 0% interest rates. Stocks will have competition from the bond market and we expect multiples as a whole to contract. Bubbles will continue to be popped, and slower growth rates will inevitably occur.
6.For the time being, and we believe rightly so, gone are the gold rush days where talking heads, financial thieves, and children pontificate endlessly on how “things have changed” and we are in “a new world order,” with these individuals arguing for an entirely new investment landscape.
In medieval Italy, people roamed throughout the land selling fake remedies and making false claims about their healing abilities. Many of these pretenders reputedly came from a village called Cerreto, and as a result, Cerretano (meaning “inhabitant of Cerreto”) became an epithet for a quack physician. In addition, these frauds used a practiced patter to attract customers, like the chatter of a circus barker. The Italian word for “to chatter” is ciarlare, and chattering was very much associated with the Cerretano, that the spelling of the word shifted to Ciarlatano. By the early 17th century, English speakers had anglicized the Italian word to charlatan and adopted it as their own.
Meet Sam Bankman-Fried, a modern day charlatan, and a first ballot hall of fame snake in the ground who is emblematic of the free money, valuations-don’t-matter bubble that was popped in 2022. I read the below quotes from a piece written by James Ferguson at MacroStrategy Partners:
---------------------------------
1. Net losses of the legacy private portfolio include the change in value of Mersana Therapeutics, Inc., (MRSN) from December 31, 2016, through the expiration of the lockup on December 26, 2017. Prior calculations of change in value of MRSN were included from December 31, 2016, through the date of MRSN’s IPO on June 27, 2017. The difference between these two measurement periods is +$0.07 per share.
“I don’t want to say no book is ever worth reading, but I actually do believe something pretty close to that.”
- Sam Bankman-Fried
Imagine that… nothing is worth reading! On the other side is Charlie Munger:
“In my whole life, I have known no wise people who didn’t read all the time. None. Zero.”
- Charlie Munger
No book is ever worth reading, Sam? I don’t think there has ever been a less intelligent statement said aloud. To think you have nothing to learn from reading is about as arrogant as it gets. Ok Sam, thanks for the insight. I wouldn't be surprised if you were in a jail cell for the next couple of decades. I'll take Charlie over Sam all day and every day.
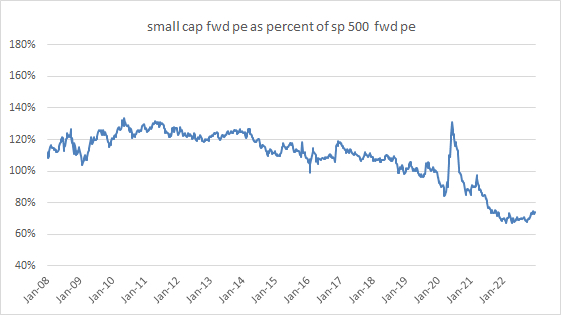
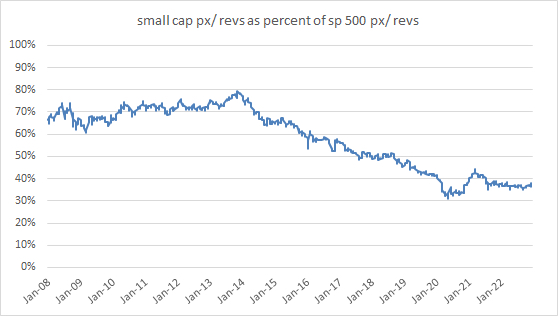
So again, before I’m accused of having my head in the sand, I acknowledge risks exist in the market and the overall economy, but have chosen to balance those risks with the avalanche of selling that has already occurred in advance of what may or may not happen. I have always believed, and continue to believe, that stocks are a discounting mechanism and rise and fall well in advance of what happens down the road. Our Graham and Dodd value approach has always argued that the price you pay for the business you buy is the most important factor in determining investment success. One of the smartest people I have met in the small cap space recently sent me charts depicting just how inexpensive our investment universe is relative to other asset classes. Most of this value discrepancy came following years of investor obsession with FAANG stocks at the expense of everything else, and then followed up with significant underperformance of small caps in 2022. That environment has led to a collection of companies trading as cheaply as they have in a very long time.
A Case for Small Caps in 2023
As a small/microcap manager, we spend a considerable amount of time examining where that market currently sits in comparison to the rest of the market. While small caps began the 2022 year undervalued relative to large caps, they actually managed to decline further in both relative and absolute value. As the charts below illustrate, small caps began 2023 at multi-decade lows in terms of relative valuations versus large caps.
Source: Bloomberg
Source: Bloomberg
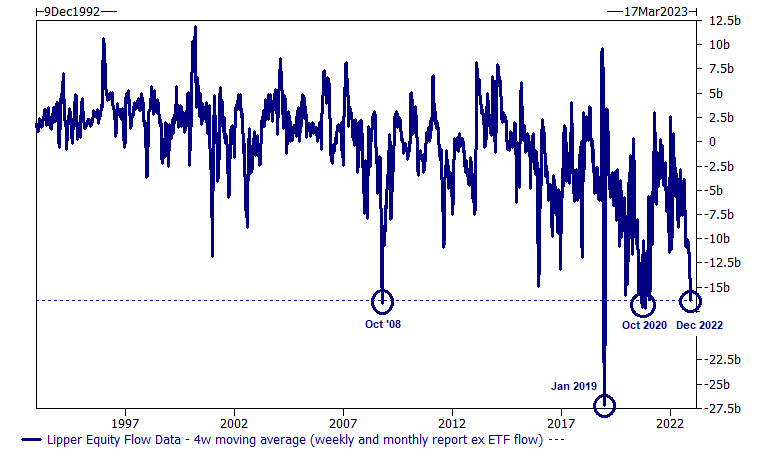
So, let’s talk about just how bearish the investing landscape became as we moved through 2022 and why we are constructive for the year 2023. Here is some data from Goldman Sachs from December 9, 2022:
1.Equity mutual funds have realized outflows for 26 consecutive weeks (-$254bn outflow) and 39 out of the last 40 weeks (-$333bn outflow) - Lipper Data excluding ETFs.
2.The pace of outflows has increased into year-end, with the current 4 week moving average at levels seen only a handful of times in the last 30 years (chart below).
3.On average, -$16.5bn of equity outflows every week for the last month (-$65bn in total) … this pace is rivaled only by Oct 2008 (financial crisis), Dec 2018 (trade wars + fed hike into slowing economy leading to worst December since 1931), and Oct 2020 (Trump/Biden election).
4.Historically, stocks have traded higher in the months following outflows of this magnitude.
4 week rolling average // Equity Mutual fund flows (weekly and monthly, ex ETFs)
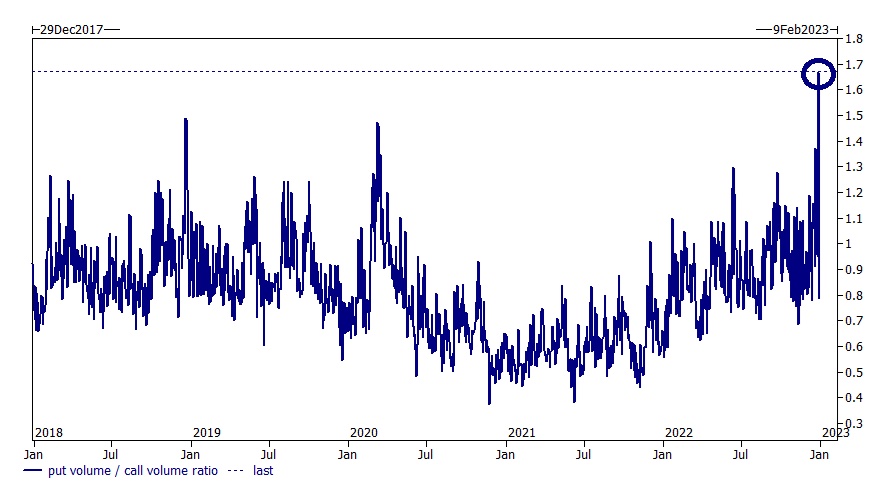
How about the next chart, also from Goldman Sachs on December 29, 2022, depicting recent put/call volume. If the world is ending as everyone says it is, we are all on the same side of that trade betting the end is near. For those who have been investors for some time like me, we know that the trend of everyone being on one side of a trade, for the most part, is almost always the greatest contrary indicator.
1.43 million listed options traded during yesterday’s session // this is slightly above the 1y rolling average of 39mm contracts.
2.16 million of these were call options // this is a 22% decrease vs the ytd avg of 20.8mm contracts.
3.27 million of these were put options // this is a 46% increase vs the ytd avg of 18.4mm contracts.
4.The ratio of puts to calls, yesterday, hit a 5y high at almost 1.7x to 1.
Daily Total Put / Call Volume Ratio – All US Listed Options
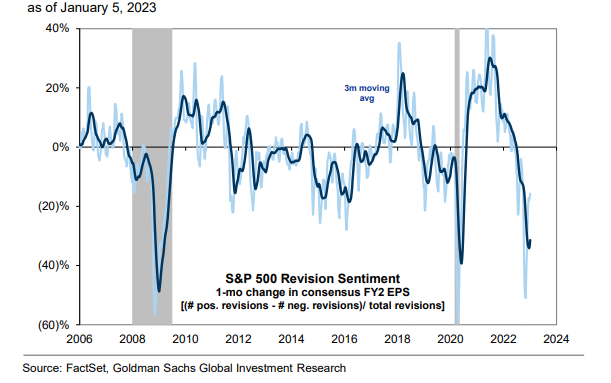
For those worried about corporate earnings given the backdrop we now face, so are we. The good news is based on information from Goldman Sachs, “More than 20% of S&P 500 market cap has pre-announced in 4Q 2022, the highest share since 1Q 2020. Similarly, the 3-month trend of S&P 500 FY2 EPS revision sentiment stands at -31%, the most negative reading outside of the 2008 and 2020 recessions...” The revisions have resulted in incredibly weak sentiment, usually representing a market bottom rather than a top.
S&P 500 EPS Revisions Sentiment is the Most Negative Since 2020 (as of January 5, 2023)
Clearly investors are worried that rising rates fueled by inflation will dampen corporate growth and earnings which leads to depressed stock prices. For TURN, while we are interested in the direction of the broader markets and global macroeconomic factors, we do so with a focus on how those factors impact the small/microcap markets where we invest.
Interestingly, using history as a guide, we see the current sell-off as an opportunity as it relates to the small/microcap market. The following information is from an interview with Chuck Royce and Francis Gannon of Royce Investment Partners that I recently read and can be found at https://www.franklintempleton.com/articles/royce-investment-partners/why-better-days-for-small-cap-may-be-ahead.
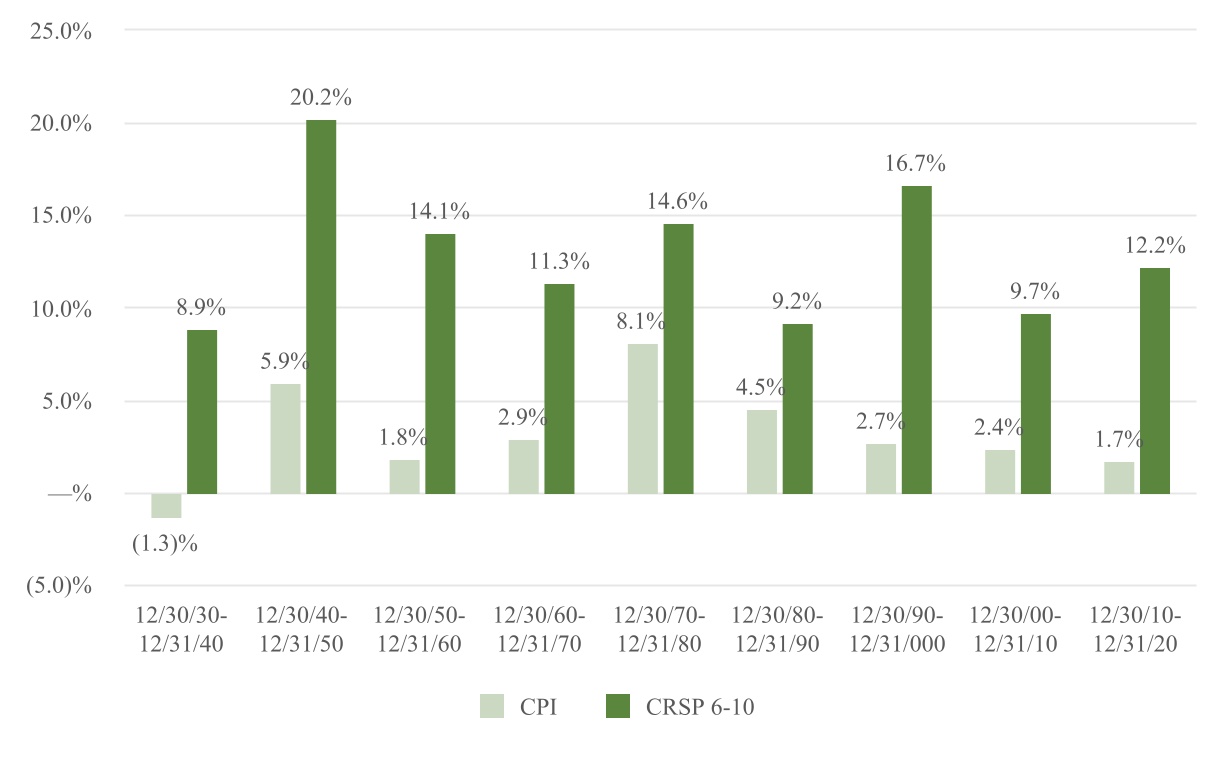
“Small-cap has beaten inflation in every decade going back to the 1930s—and is the only equity class to have done so. We learned this by comparing the average annual U.S. consumer price index (CPI) to returns for the Center for Research in Security Prices (CRSP) 6-10 Index—which is a proxy that we use for small caps when we want to reach farther back in history than the Russell 2000 goes. Moreover, the CRSP 6-10 has posted positive annualized three-year returns 88% of the time on a rolling monthly basis since 1945, with an average return in the low double digits.”
Average Annual Consumer Price Index (CPI) vs.
Average Annual CRSP 6-10 Index Performance from 12/31/30- 12/31/20
Source: Russell Investments.
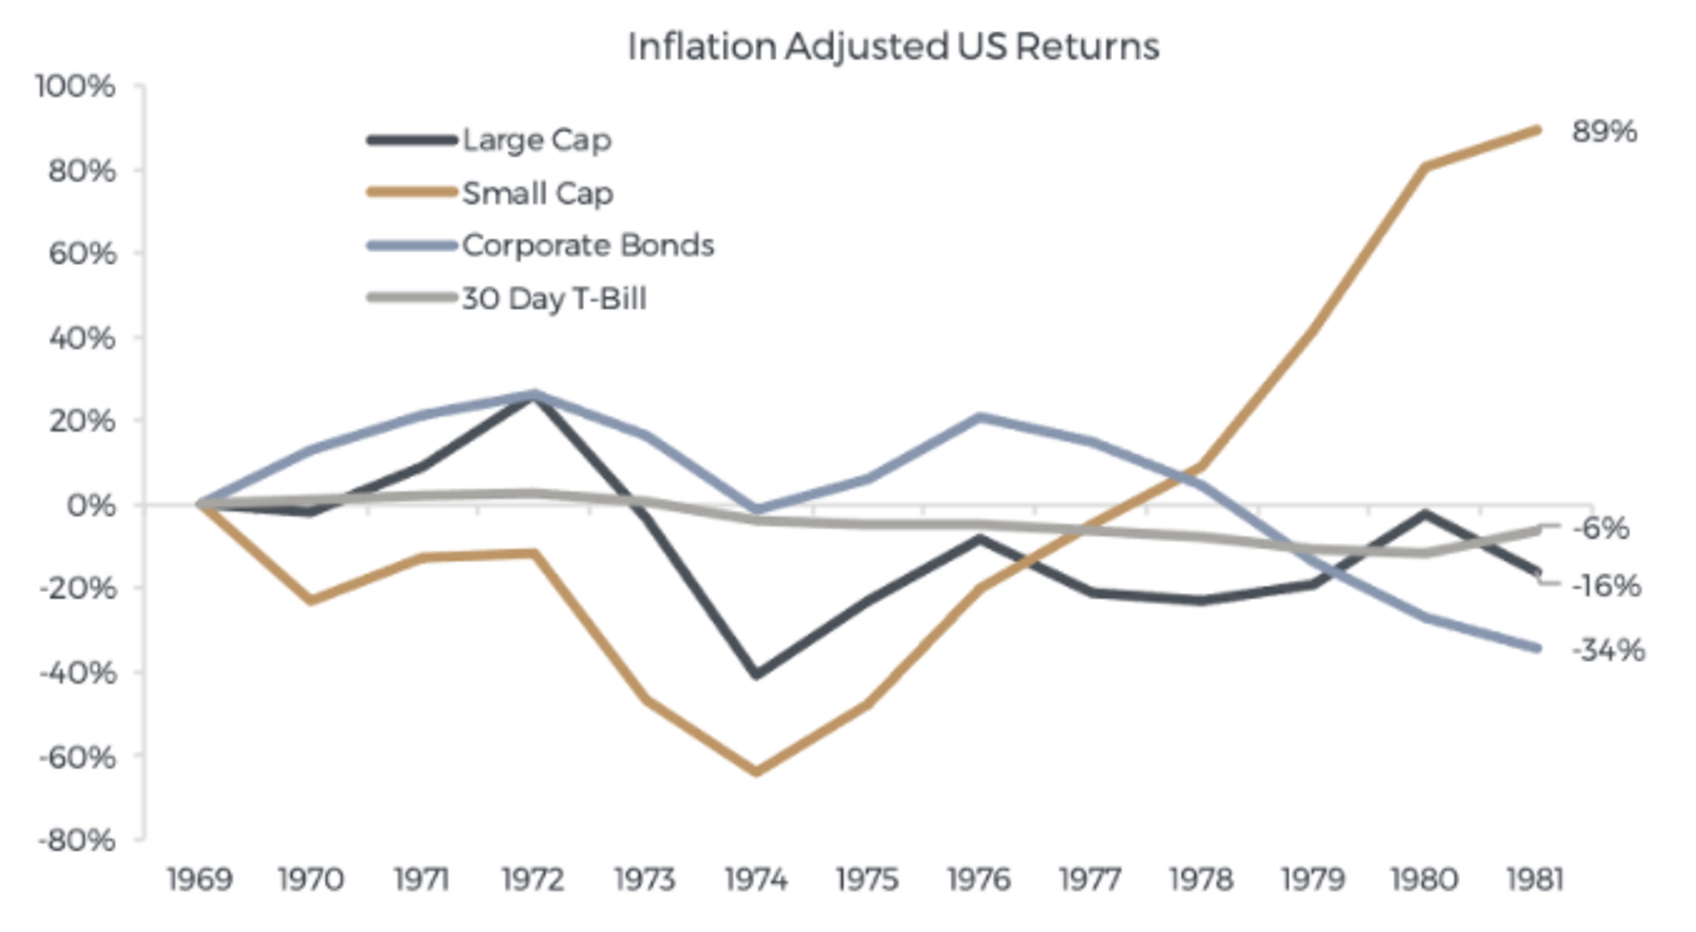
Here is some additional data from Ibboston that compares inflation adjusted returns amongst asset classes over time.
Source: Ibboston @ Harrington, SBBI (2020)
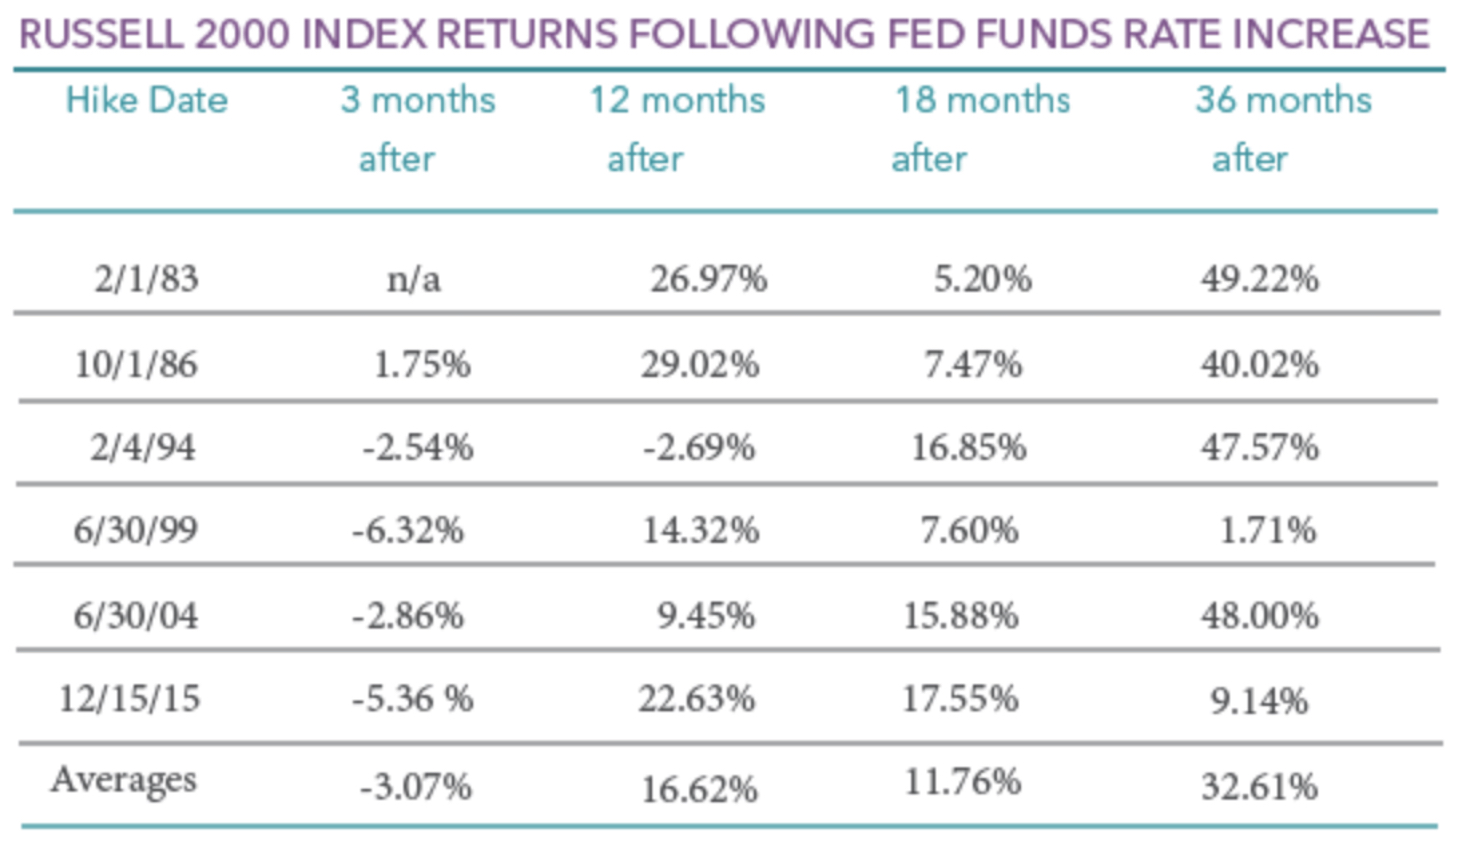
If we drill down further and examine the six most recent cycles of fed funds rate hikes, we see that following an initial selloff, the small cap market consistently produced attractive rates of return for the 12-36 month period following an initial rate increase.
Source: Perritt Capital Management
So, our conclusion is not that the investing landscape hasn’t changed, it has changed. It’s just that with companies like Synchronoss, having already been cut in half, and then cut in half again in the last two months of the year; we believe equities like SNCR have overshot to the downside. Stocks are trading at all time low valuations and are discounting a lot of the weakening economies that potentially will be here. And no, this isn’t 2008. It almost bastardizes just how bad 2008 was by weakly comparing this period to that period. 2008 was truly "the end of the world," or as Warren Buffet said, "Economic Pearl Harbor." This is just a return to more normal markets; albeit ones that will not necessarily be easy to navigate; and will indeed have their pitfalls. With this backdrop, let’s dive into the specifics related to the results from Q4 2022.
NET ASSET VALUE PER SHARE
Our NAV decreased this quarter from $8.10 to $6.32, or a decline of 22.0%. Our Fund has three principal components to the variance in our NAV: our public and public-related portfolio, our legacy private portfolio, and our expenses. For the quarter, our public and public related portfolio companies excluding D-Wave Quantum, Inc., which is a legacy portfolio company, decreased our NAV by $0.44. As stated above, the decrease in the value of the legacy Harris & Harris Group portfolio which existed before 180, reduced NAV by $1.27. AgBiome and D-Wave Quantum accounted for $0.63 and $0.53 of that decline, respectively. The rest of the legacy private portfolio decreased NAV by $0.11. Operating expenses decreased NAV by $0.07.
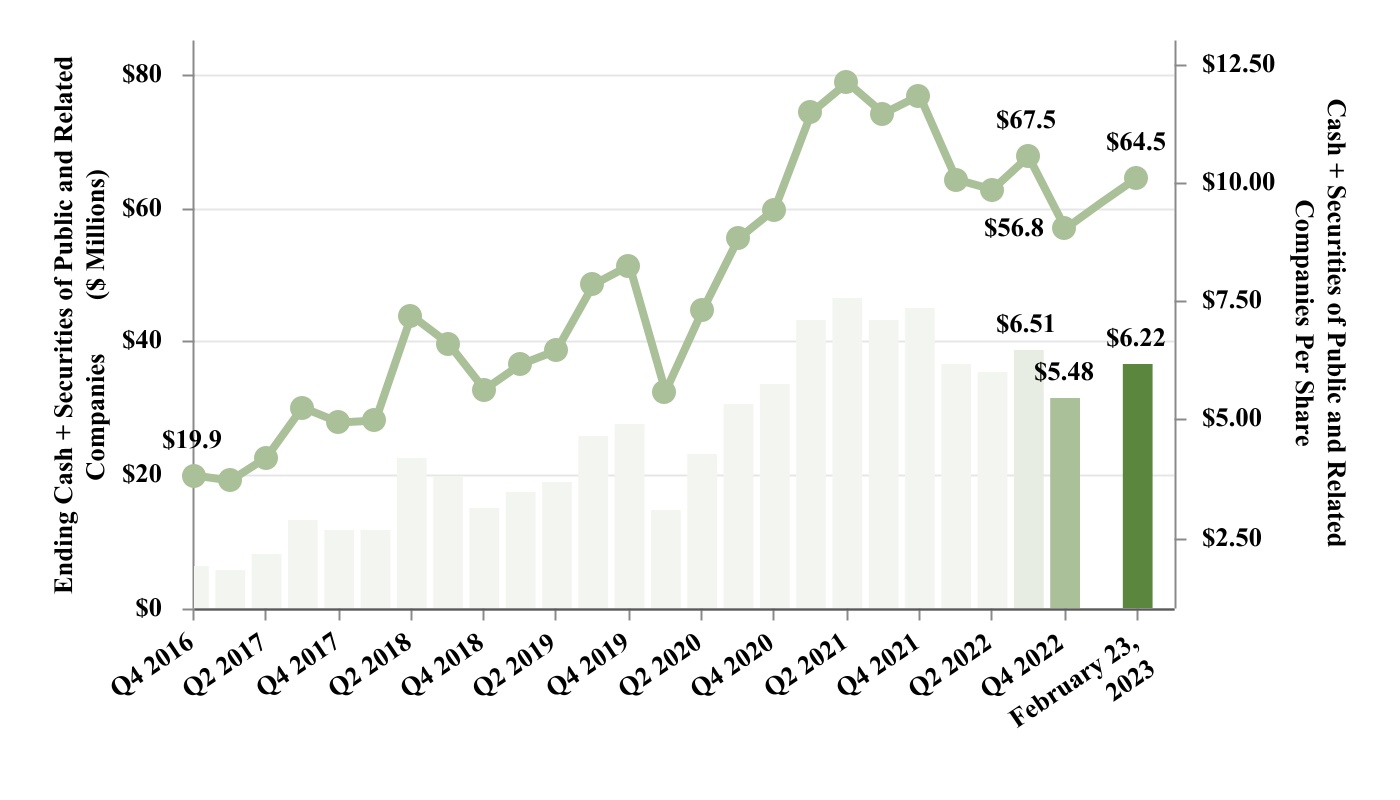
The only good news regarding the latest write-offs and write-downs we have had to take on the legacy Harris & Harris Group portfolio is that it’s basically over. As of December 31, 2022, approximately 86% of our invested assets and cash are now in
public or public-related investments, while approximately 14%, or just $9.5 million is in our legacy portfolio. To understand the magnitude of the headwinds we have faced since our arrival at the beginning of 2017, our public and public-related market strategy has increased our NAV by $3.52 per share by while at the same time, the private holdings have decreased our NAV by a $1.80 per share.
| | | | | | | | | | | | | | | | | | |
| Quarter | | 1 Year | 3 Year | 5 Year | Inception to Date |
| Q4 2022 | | Q4 2021- Q4 2022 | Q4 2019- Q4 2022 | Q4 2017- Q4 2022 | Q4 2016- Q4 2022 |
| | | | | | |
| | | | | | |
| | | | | | |
| Change in NAV | (22.0%) | | (40.7%) | (31.2%) | (19.0%) | (10.0%) |
| | | | | | |
| Change in Stock Price | (3.8%) | | (28.2%) | (18.1%) | (10.7%) | 27.5% |
| | | | | | |
| Russell Microcap Index | 4.7% | | (22.0%) | 12.6% | 19.9% | 35.6% |
| Russell Microcap Value Index | 6.0% | | (13.9%) | 24.4% | 32.3% | 48.1% |
| Russell 2000 | 6.2% | | (20.5%) | 9.5% | 22.3% | 40.1% |
| | | | | | |
| | | | | | |
| | | | | | |
That said, you are fully aware that our primary goal since we started was to ensure that the bulk of our balance sheet be comprised of cash and public and public related securities, which would allow our shareholders to value TURN’s holdings more easily. It also will allow for a discussion of opportunities to return capital back to shareholders at some point. As a whole, this past quarter and 2022 were disappointing. That said, I would offer the following chart to provide some perspective on our performance over a longer period of time. I would also encourage you to focus your attention on our book value for where we already are in 2023 rather than on the year end numbers. You can see a strong increase in the value of our cash and securities of public and related companies since TURN began. And after a dismal 2022, we have bounced back to start the year.
On a relative basis, TURN's stock price total return of +27.5% trailed the Russell Microcap Index total return of +35.6% since our inception as is shown in the chart below:
PUBLIC AND RELATED PORTFOLIO
In the chart below, you see our one-year, three-year, and inception-to-date performance. It wasn’t a good year either from an absolute or relative return basis.
| | | | | | | | | | | | | | | | | | |
| Quarter | | 1 Year | 3 Year | 5 Year | Inception to Date |
| Q4 2022 | | Q4 2021- Q4 2022 | Q4 2019- Q4 2022 | Q4 2017- Q4 2022 | Q4 2016- Q4 2022 |
TURN Public Portfolio
Gross Total Return (Excluding SMA Carried Interest) | (7.6%) | | (37.6%) | (4.8%) | 92.3% | 205.0% |
TURN Public Portfolio
Gross Total Return (Including SMA Carried Interest) | (7.6%) | | (37.6%) | 1.6% | 104.9% | 225.0% |
| | | | | | |
| | | | | | |
| | | | | | |
| Change in Stock Price | (3.8%) | | (28.2%) | (18.1%) | (10.7%) | 27.5% |
| | | | | | |
| Russell Microcap Index | 4.7% | | (22.0%) | 12.6% | 19.9% | 35.6% |
| Russell Microcap Value Index | 6.0% | | (13.9%) | 24.4% | 32.3% | 48.1% |
| Russell 2000 | 6.2% | | (20.5%) | 9.5% | 22.3% | 40.1% |
| | | | | | |
| | | | | | |
| | | | | | |
I have repeatedly said, when you run a concentrated portfolio with seven to ten names, there are going to be periods where we look like we have never managed money a day in our lives. If you have done this long enough, you will have developed scar tissue from years like 2022; but as Babe Ruth said, “Never let the fear of striking out keep you from playing the game.” We have achieved a 225% gross total return since the inception of 180 versus 35% total return for the Russell Microcap Index because we stepped up to the batter’s box and had conviction about investing in particular companies. Investors miss 100 percent of the shots they never take.
For Q4 2022, we generated a gross total return for our public and public related portfolio of -7.6%, versus a total return for the Russell Microcap Index of 4.7 % and a gross total return for the Russell Microcap Value Index of 6.0%. For 2022 as a whole, our -37.6% gross total return compares negatively to the -22.0 % return for the Russell Microcap Index. Despite this year’s performance, as seen in the chart above, our five-year, and inception-to-date numbers including the carried interest from our SMAs show significant outperformance versus these benchmarks. While we have certainly hit a rough patch in performance in 2022, we are excited that we are potentially starting the next bull cycle with a bear market NAV of $6.32, the vast majority of which are in assets that we actually control both from when we made the investment and, as importantly, when we want to sell the position. We had neither control or the capability to act with regard to the legacy holdings we inherited that have negatively impacted our NAV for 6 years, including 180’s position in D-Wave Quantum, that was unable to be sold due to lockup provisions associated with its de-SPAC. If you wanted to understand the history of what we inherited, the strategy of the past has left 180 with approximately $80.6 million in operating loss carryforwards and $16 million in capital losses; these losses were created, by the way, in a bull market! Not an exceptional track record. We have finally cleansed ourselves of the drag the legacy private portfolio has had on 180's NAV. We believe many of our public investments have the ability to at least double from where they ended in 2022, and, if that occurs, we believe that should propel our NAV and share price higher.
Let’s dig into the significant sources of the changes in value in our public portfolio in Q4 2022. What you will see a lot of is the following story: Company A reported better than expected results and the stock was down anyway, and because the stock was down YTD, it was subject to extreme tax loss selling, particularly in December 2022.
Largest Decreases in Value
•D-Wave Quantum, Inc. (QBTS) – In early October 2022, QBTS share price began to freefall from approximately $8.00 per share to $2.50 per share in less than one month. While there was no specific news that could be traced to this collapse, it was well known that QBTS needed to use its equity line of credit to raise capital for operations since the de-SPAC process left the company with less than $15 million on its balance sheet. This equity line could be tapped once the registration statement was deemed effective by the SEC in October 2022. While the Q3 2022 report was in-line with expectations, the management of QBTS did not provide any clarity on how it planned to fund the operations of the company beyond using the equity line facility and the stock continued to decline into the end of the year. For the quarter, QBTS reduced our NAV by $0.53 per share, or $5.5 million.
180's shares of QBTS were subject to a lockup agreement as of the end of 2022, so we were not able to trade or hedge this position. Because of our inability to be anything other than a bystander, while included in this section as a public company, the performance was calculated as if it was a private company. Our shares are now registered, and as of February 5, 2023, the lockup has expired and we are free to trade our holdings of QBTS. Going forward, the performance of QBTS will therefore be included in our calculations of gross total return for our public and public-related holdings.
•Synchronoss Technologies, Inc. (SNCR) – SNCR reported better than expected results for Q3 2022, but was not able to make progress cleaning up its balance sheet with regard to paying off its preferred stock. Investors continue to be concerned with the ability of the company to reach the point where it will begin to generate positive unadjusted free cash flow even though SNCR's management communicated its expectation that such point will be reached in 2023. That said, we are trying to rationalize SNCR’s 41% plunge in the quarter and are left making up reasons. We believe the truth is instead that the stock was cut in half this quarter because of tax loss selling. Full stop. This is a business that is mostly cloud based recurring revenue and worth multiples of the share price that existed at the end of the year. It is incumbent upon management and the Board of SNCR to realize that value in 2023 and beyond. For the quarter, SNCR reduced our NAV by $0.24 per share, or $2.5 million.
•Arena Group Holdings, Inc. (AREN) – AREN reported strong results for Q3 2022, and the stock responded positively through most of the quarter. On December 13, 2022, AREN announced the acquisition of Men's Journal using a new debt facility from B. Riley to fund the acquisition. This facility was meant as a bridge to more permanent financing as it includes terms that call for increases in the interest rate quarterly starting in March 2023. AREN's stock subsequently collapsed from approximately $16.00 per share to $10.61 as of the end of the quarter. We like the transaction, believe AREN is performing quite well, and it is a standout in what has become a challenging advertising environment. We believe what is holding the stock back is its capital structure and management simply needs to address and solve for it in the first few months of 2023. For the quarter, AREN reduced our NAV by $0.18 per share, or $1.9 million.
•Comscore, Inc. (SCOR) – SCOR reported continued improving financial results for Q3 2022, and announced the renegotiation of its data deal with Charter to provide lower costs, increased data access and a longer term of exclusivity to certain data sets. That said, SCOR's stock was unable to recover from the collapse that started in early September 2022, due primarily to continued ambiguity around the potential for the special dividend to be called by the Preferred Stockholders and certain corporate governance matters. Cerberus continued purchasing SCOR's common stock in open-market purchases, with its largest purchase of 1.5 million shares at approximately $1.10 per share. Simply put, the performance of the business would justify a meaningfully higher share price. We believe SCOR is woefully undervalued due to investors’ obsession with the special dividend and conspiracy theories for what the three preferred holder’s intentions are with regards to oversight of the business. It is patently clear to us that SCOR’s Board has its head in the sand with regards to why the stock is here and we will ramp up our activism to shine a light on the egregious board compensation and the lack of transparency with regards to the special dividend. The board’s purpose is to represent common shareholders, not just serve the interests of the preferred holders. For the quarter, SCOR reduced our NAV by $0.15 per share, or $1.5 million.
Largest Increase in Value
•Potbelly Corporation (PBPB) – PBPB reported continued strong results for Q3 2022, across all financial and shop-level metrics. PBPB also provided a strong guide for Q4 2022 that included continued increases in shop-level margins. In December 2022, PBPB announced the signing of four additional shop development agreements with existing franchisees. Under the agreements, 25 new shops will be developed in their respective territories over the next six years. For the quarter, PBPB increased our NAV by $0.16 per share, or $1.7 million.
•Commercial Vehicle Group, Inc. (CVGI) – CVGI reported results that continued to show the improvements made by management through renegotiation of contracts and streamlining of the business. CVGI reported new business wins and continued strong free cash flow that allowed the company to pay down debt near the top end of its guidance. CVGI also noted that it has begun to renegotiate the remaining low-margin contracts in Q4 2022, with the goal to complete these renegotiations by the end of the year which would enable the company to realize the benefits of such improvements much earlier than originally communicated to investors. For the quarter, CVGI increased our NAV by $0.12 per share, or $1.3 million.
•Alta Equipment Group, Inc. (ALTG) – ALTG reported results that exceeded all analyst expectations and guidance with continued strong performance across all of its businesses. ALTG also noted that it continues to be capacity constrained on its rental fleet and has not seen any weakness in demand. For the quarter, ALTG increased our NAV by $0.10 per share, or $1.1 million.
Other Notes
The valuation committee of our Board of Directors fair valued our holdings of Parabellum Acquisition Partners, LLC., the entity that sponsored the SPAC, Parabellum Acquisition Corp. (PRBM) at approximately $2.7 million, a decrease of $3.2 million, or $0.30/share. Given we hold a seat on the board of PRBM, we are limited in what we can say publicly regarding the inputs used by our Valuation Committee to set the valuation of these holdings as of the end of the quarter beyond a reduction in the probability of completing a transaction from 75% as of the end of Q3 2022 to 33% as of the end of Q4 2022. We can note that a transaction with EnOcean GmbH was announced during the quarter, but the deal contains a provision that PRBM needs to secure $30 million of capital under terms acceptable to EnOcean by the end of February 2023 or EnOcean has the ability to terminate the transaction. We will provide updates on this effort as they become available and are able to be shared publicly.
It is our view that many names in our universe have been overly discounted (based on their valuations) as a result of the very bearish environment we are in. Our permanent capital allows us to make rational decisions on our investments, and we believe this is a distinct advantage in regard to our ability to generate returns greater than the indices over an investment cycle. We are never forced to sell unless we believe we should for analytical and investment process reasons. We have seen the benefits of having permanent capital during other periods of market dislocation during our six-year history, and we expect this period will be no different. Like the other weak periods of performance during the last six years, we hope to look back at this one and reflect that while it was painful wading through it, we were presented with some interesting investment opportunities that we believe have at least 100% upside. I have seen a number of washouts over the last 35 years, and 2022, Q4 and December in particular, were amongst the most vicious I have ever seen. We have intentionally created a concentrated portfolio that has very low correlation to the broad indices. We are aware of the potential for episodic returns for our holdings, i.e., we believe we will get paid for most of our investments, we just can't say when. But I can say 2023 is off to a great start with our year-to-date gross total return through February 23, 2023, of 14.8% more than doubling the Russell Microcap Index total return of 7.0%.
LEGACY PRIVATE PORTFOLIO
We have already transformed our business over the last five years away from the historical venture capital model and towards public and public related securities and this past quarter. While beyond painful, this past quarter got us closer to the ultimate goal of having 100 percent of our assets in public companies. We have already discussed why QBTS hurt us this quarter. This quarter we also wrote down the value of our holdings in AgBiome due primarily to declines in the value of comparable public companies. HALE.life has been written down to zero following its management's continued and endless failure to raise capital. Following these write-downs, 180’s remaining private portfolio has only one material position, AgBiome. The total assets of our remaining legacy private portfolio is approximately $9.5 million, and of that amount, $2.4 million are payments that we expect to receive from the sale of TARA Biosystems, Inc., to Valo Health, LLC, with $1.1 million to be paid in April 2023, and $1.3 million in April 2024.
Our transformation started in June 2016, when I first joined the Board of Directors. At that time, our predecessor company’s balance sheet was comprised of 73% private assets and 27% net cash and public and related securities. Today, following the events in Q4 2022, those percentages have flipped. Because of the greater transparency in the value of our holdings, it would make sense to us that our stock should narrow the discount it trades to our NAV. When we first took over the management of 180, we were very clear about what we hoped to accomplish with regard to the mix of assets on our balance sheet, and I am pleased to report we have executed that strategy. I would have liked the last increase in terms of the mix of public versus private assets to have come from strength in the public holdings rather than write-downs in our private holdings, but as I have said, we simply have had no control over the legacy holdings we inherited from the Harris & Harris Group. We have cleared our decks as we head toward the future, and finally have the balance sheet mix we can utilize to create real value for our shareholders.
EXPENSES
As noted in previous letters, we have dramatically reduced our cost structure under our new strategy. In 2016, before our Fund’s change in investment focus and management team, our operating expenses, excluding stock-based compensation and interest on outstanding debt, averaged approximately $1.3 million per quarter. For Q4 2022 our regular operating expenses equaled approximately $800,000 versus approximately $750,000 in Q4 2021. We will maintain a lean cost structure (outside of fixed expenses for being a public company) focusing our expenses on activities solely designed to enhance our investment performance or to increase our revenues from managing outside capital. As has been the case since my arrival, we have been consistent in saying that the management team will only participate in a bonus pool if our performance warrants it. Needless to say, our performance for 2022 didn’t warrant a bonus pool, and thus no performance based bonuses are accrued as of the end of Q4 2022. In addition, no new bonus pools will be accrued until we overcome the high-water mark set by our public holdings and payment of the historically deferred portion of prior bonus pools with require the same with respect to each year they were established. Our management team and Board are acutely aware that we are in business to serve our shareholders.
TURN/NAV: SUM OF THE PARTS
As of the end of Q4 2022, TURN traded at 84% of NAV. Our securities of publicly traded and related companies, cash, and other assets net of liabilities were $5.41 per share. Our stock price was $5.28. If we receive 100% credit for the value of these assets net of liabilities, the market is ascribing a negative value of approximately $0.13 per share, or -$1.35 million, to our legacy private portfolio.
We thought it appropriate to provide an update on this analysis through February 23, 2023, given the discussion earlier in this letter. As of that date, using solely changes in value of Level 1, or publicly traded holdings, TURN traded at 75% of estimated NAV. Our securities of publicly traded and related companies, cash, and other assets net of liabilities were $6.16 per share. Our stock price was $5.2756. If we receive 100% credit for the value of these assets net of liabilities, the market is ascribing a value of approximately -$0.89 per share, or -$9.2, million to our legacy private portfolio. I'll remind you that approximately $2.3 million of the legacy private portfolio are payments from the sale of TARA to Valo Health, and that we expect to receive $1.1 million in April 2023 and the remaining $1.3 million in April 2024.
Given how painful the market has been in 2022, we think the current construct of our balance sheet has provided a true floor for our share price. While none of 2022 has been fun, had 2017-2021 not occurred our share price would be nowhere near where it is trading today.
CONCLUSION
A return to a normal environment of higher interest rates is here. It is our view, the market adjustment to that environment has been vicious, indiscriminating, and, in some cases, overdone. I think the mistake we made last year was thinking, to some extent, because of their own execution of our portfolio company’s businesses, and because valuations were modest to begin with, the performance of the stocks would supersede the downdraft of the macro economy and the market as a whole. We were dead wrong. Microcap companies were amongst the worst performing asset class last year, and much of that underperformance was due to a lack of liquidity and end of the year tax loss selling. Selling begets selling in a risk off market and that’s what fed on itself as we ended the year. This trend reversed itself thus far in 2023 as the overzealous tax loss selling and doomsday predictions abate.
180 suffered through as poor a year as I had running the Basic Value Fund at BlackRock in 2008; that was a period that was actually the economic equivalent of Pearl Harbor. This isn’t that. An unemployment rate of 3.4% is not an end of the world scenario, and as the COVID-19 pandemic becomes a thing of the past, especially with China exiting its COVID-zero policy, inflation and supply chain inefficiencies should moderate. Will demand slow? Yes. Are bonds more competition for stocks? Yes. Will multiples contract as a reflection of higher rates? Yes. But that doesn’t mean SNCR deserved to be cut in half in December 2022 after being cut in half in one month prior. Markets, always overshoot in both directions and we have seen both ends in the last two years. Do you remember the period when Bitcoin was $60,000, the movie theater chain meme stock AMC went from $2 to $60 per share in a month, and every cannabis stock went to valuations that reflected an investment community that was truly “high” from smoking their investments? That was a bubble. 2022 ended with the seemingly unanimous view that we are headed for a nasty recession, stocks have no place in client portfolios given the attractiveness of bonds, so sell everything I own at any price. That is peak pessimism.
We own a number of companies that we believe are mis-valued. We believe that these mis-valuations are our opportunity as we look out a number of years. When we started, we told you we were going to construct a concentrated group of companies and use a Graham and Dodd process for selecting those companies, supplemented with an activist approach. In doing so, we knew that we would have less correlation with the indices (intentional) and have a portfolio that had a higher risk/reward profile than the average diversified small cap fund. For the first five years, we showed the benefit of our strategy, both in terms of our absolute and relative performance. And then last year happened. Every time I hear someone say, “It’s different this time,” I want to scratch my eyes out. You know why “we haven’t seen this before?” It’s because many market participants have only known a Fed that kept rates at zero (for far too long but that’s a different story), 14 years of quantitative easing, free money for all, and next to nothing inflation. THAT’S NOT NORMAL! I truly don’t want to come across as some old stodgy value guy preaching to the world, but the truth is there are so many market participants who haven’t lived through a normal Fed cycle of rate increases, or who haven’t experienced not making AMC like returns in short time frames. So, as one would expect (although way worse than we thought), the market began to adjust to the new world, but in our estimation, overcorrected and overly punished equities as the year ended.
We intentionally run a concentrated portfolio of small cap companies. Way more often than not, our shareholders have seen the benefit of that strategy by benefiting when we get our stock picking right. Of course, with the upside potential comes periods like we are in where you see the risk of managing a concentrated portfolio.
The market for microcaps is filled with inefficiencies and asymmetric risk/reward characteristics. If you get your stock picking right, you can achieve outsized returns. Based on our research, we believe many of the individual companies we own have
upside of 100% over a three-year period. We have permanent capital and the opportunity to take advantage of the current dislocation is easier for us because we don’t have to sell to service redemptions.
It was breathtaking (and not in a good way) to watch the destruction of many of our holdings in Q4 2022. We have seen periods of indiscriminate selling before, but last year and specifically the fourth quarter was at another level. In last quarter’s shareholder letter, I wrote the following: “We have always subscribed to the “you reap what you sow” school of hard work. Well, at TURN, we are sowing. That’s what we do each and every day. Sow. Sow. Sow. I anticipate looking back three years from now and laughing at the investor who sold PBPB stock to us at $4.60.”
PBPB is now $7.39, some 60% higher, but at the moment it was $4.60, with the market telling me just how dumb I was, I wasn’t feeling too good. We insist on knowing what we own and why we own it, and we hold a deeply-held belief that intelligent contrarianism works over time. The PBPB selloff had the potential to cause us to not only second guess our views, but perhaps, ultimately, alter our investment thesis. We thought we knew how absurd the selloff was given the fundamentals, but it's often hard to retain conviction when the rest of the world seemingly has a totally different view. Fortunately, we stayed with PBPB and the gains year-to-date are reflected in our interim estimated NAV. In recent weeks, SNCR traded to $0.51, AREN to $7.43, SCOR to $1.00, CVGI to $4.03, ACNT to $8.12, LTRX to $3.79, and QMCO to $1.00. Are those really the right prices for these businesses over the next couple of years? I doubt it. And just like with PBPB, we really hope we can look back with laughter at the “gifts” we were offered in what was an avalanche of risk-off selling. If we are more right than wrong on the above holdings and new positions we establish, our NAV will be meaningfully higher and so should our stock price.
The only reason I agreed to become CEO of TURN was to see if we could stop Harris & Harris from ending at $0, and see if we could build a different business that would reward shareholders, not destroy them as had been the case through 2016. The only thing we truly care about is the return of TURN stock. And while last year was disappointing, it’s over and we are seeing the benefit of our permanent capital in the meaningful appreciation in the value of our holdings thus far in 2023. We believe our strategy will once again reward shareholders as it did from 2016-2021, and as we start 2023 we have a balance sheet that resides predominantly in the positions we can control. We think many of our holdings are discounting for an environment that is not going to exist. We are bullish on our ability to use this environment to create significant value over the next few years. There won’t be any free lunches and it will take a lot of good stock picking, but I’m convinced we have the opportunities in front of us that can lead to a much higher stock price than the one we have today.
Thank you for your continued support.
Kevin Rendino
Chairman and Chief Executive Officer
Forward-Looking Statements and Disclaimers
This shareholder letter may contain statements of a forward-looking nature relating to future events. These forward-looking statements are subject to the inherent uncertainties in predicting future results and conditions. These statements reflect the Company's current beliefs, and a number of important factors could cause actual results to differ materially from those expressed in this press release. Please see the Company's securities filings filed with the Securities and Exchange Commission for a more detailed discussion of the risks and uncertainties associated with the Company's business and other significant factors that could affect the Company's actual results. Except as otherwise required by Federal securities laws, the Company undertakes no obligation to update or revise these forward-looking statements to reflect new events or uncertainties. The reference and link to any websites have been provided as a convenience, and the information contained on such website is not incorporated by reference into this shareholder letter. 180 Degree Capital Corp. is not responsible for the contents of third-party websites. The information discussed above is solely the opinion of 180 Degree Capital Corp. Any discussion of past performance is not an indication of future results. Investing in financial markets involves a substantial degree of risk. Investors must be able to withstand a total loss of their investment. The information herein is believed to be reliable and has been obtained from sources believed to be reliable, but no representation or warranty is made, expressed or implied, with respect to the fairness, correctness, accuracy, reasonableness or completeness of the information and opinions.
| | |
180 DEGREE CAPITAL CORP.
CONSOLIDATED STATEMENT OF ASSETS AND LIABILITIES |
| | | | | |
| | December 31, 2022 |
| ASSETS | |
| Investments in securities and other financial instruments, at value: | |
| Unaffiliated publicly traded equity and equity-related securities (cost: $31,887,534) | $ | 28,348,665 | |
| Unaffiliated legacy privately held equity and equity-related securities (cost: $9,108,961) | 6,511,987 | |
| Non-controlled affiliated publicly traded equity and equity-related securities (cost: $37,012,880) | 24,905,157 | |
| Non-controlled affiliated legacy privately held equity and equity-related securities (cost: $6,496,930) | 158,886 | |
| Controlled affiliated equity and equity-related securities (cost: $2,923,003) | 2,706,572 | |
| Unaffiliated derivative securities (cost: $113,639) | 0 | |
| Non-controlled affiliated derivative securities (cost: $224,849) | 215,631 | |
| Unaffiliated rights to payments (cost: $3,320,538) | 2,842,814 | |
| Cash | 655,459 | |
| Prepaid expenses | 250,439 | |
| Receivable from managed funds | 152,151 | |
| Receivable from securities sold | 108,512 | |
| Lease asset | 72,634 | |
| Other assets | 21,423 | |
| Other receivables | 2,278 | |
| Total assets | $ | 66,952,608 | |
| LIABILITIES & NET ASSETS | |
| |
| Post-retirement plan liabilities | $ | 645,637 | |
| Accounts payable and accrued liabilities | 508,217 | |
| Payable for securities purchased | 180,971 | |
| Lease obligation | 72,634 | |
| Total liabilities | $ | 1,407,459 | |
| Commitments and contingencies (Note 10) | |
| Net assets | $ | 65,545,149 | |
| Net assets are comprised of: | |
| Preferred stock, $0.10 par value, 2,000,000 shares authorized; none issued | $ | 0 | |
| Common stock, $0.03 par value, 15,000,000 shares authorized; 11,541,079 issued | 334,594 | |
| Additional paid in capital | 115,687,138 | |
| Total accumulated distributable loss | (45,871,058) | |
| Treasury stock, at cost 1,167,259 shares | (4,605,525) | |
| Net assets | $ | 65,545,149 | |
| Shares outstanding | 10,373,820 | |
| Net asset value per outstanding share | $ | 6.32 | |
The accompanying notes are an integral part of these consolidated financial statements.
16
| | |
180 DEGREE CAPITAL CORP.
CONSOLIDATED STATEMENT OF OPERATIONS |
| | | | | |
| Year Ended
December 31, 2022 |
| Income: | |
| Dividend | $ | 83,942 | |
| Other (Note 2) | 202,077 | |
| Total income | 286,019 | |
| Operating fees and expenses: | |
| Salaries, bonus and benefits | 1,019,877 | |
| Professional | 696,620 | |
| Administration and operations | 454,649 | |
| Insurance | 336,845 | |
| Directors | 288,750 | |
| Custody | 32,204 | |
| Rent | 29,744 | |
| Other | 9,659 | |
| Total operating expenses | 2,868,348 | |
| Net investment loss before income tax expense | (2,582,329) | |
| Income tax expense | 874 | |
| Net investment loss | (2,583,203) | |
| Net realized gain (loss) from investments: | |
| Unaffiliated publicly traded equity and equity-related securities | 2,007,977 | |
| Unaffiliated legacy privately held equity and equity-related securities | (2,453,941) | |
| Non-controlled affiliated publicly traded equity and equity-related securities | (694,257) | |
| Non-controlled affiliated legacy privately held equity and equity-related securities | (2,365,432) | |
| Controlled affiliated equity and equity-related securities | (143,490) | |
| Unaffiliated rights to payments | 6,014,178 | |
| Call options | 35,909 | |
| Net realized gain from investments | 2,400,944 | |
| Transferred shares-value (Note 2) | (196,290) | |
| Net realized gain | 2,204,654 | |
| Change in unrealized (depreciation) appreciation on investments: | |
| Unaffiliated publicly traded equity and equity-related securities | (19,114,100) | |
| Unaffiliated legacy privately held equity and equity-related securities | (5,270,680) | |
| Non-controlled affiliated publicly traded equity and equity-related securities | (14,757,068) | |
| Non-controlled affiliated legacy privately held equity and equity-related securities | 329,127 | |
| Controlled affiliated equity and equity-related securities | (4,218,485) | |
| Unaffiliated rights to payments | (1,621,048) | |
| Net change in unrealized depreciation on investments | (44,652,254) | |
| Net realized gain and change in unrealized depreciation on investments | (42,447,600) | |
| Net decrease in net assets resulting from operations | $ | (45,030,803) | |
The accompanying notes are an integral part of these consolidated financial statements.
17
| | |
180 DEGREE CAPITAL CORP.
CONSOLIDATED STATEMENT OF CASH FLOWS |
| | | | | |
| Year Ended
December 31, 2022 |
| Cash flows used in operating activities: | |
| Net decrease in net assets resulting from operations | $ | (45,030,803) | |
| Adjustments to reconcile net decrease in net assets resulting from operations to net cash used in operating activities: |
| Net realized gain from investments | (2,400,944) | |
| Net change in unrealized depreciation on investments | 44,652,254 | |
| Depreciation of fixed assets | 9,547 | |
| Call options purchased | (174,765) | |
| Call options written | 210,674 | |
| Purchase of unaffiliated publicly traded equity and equity-related securities | (23,783,007) | |
| Purchase of non-controlled affiliated publicly traded equity and equity-related securities | (2,817,196) | |
| Purchase of controlled affiliated equity and equity-related securities | (255,357) | |
| Proceeds from sale of unaffiliated publicly traded equity and equity-related securities | 13,274,916 | |
| Proceeds from sale of unaffiliated legacy privately held equity and equity-related securities | 120,802 | |
| Proceeds from sale of non-controlled affiliated publicly traded and equity-related securities | 1,172,773 | |
| Proceeds from sale of non-controlled affiliated legacy privately held equity and equity-related securities | 67,641 | |
| Proceeds from controlled affiliated equity and equity-related securities | 19,510 | |
| Distribution from sale of unaffiliated rights to payments | 12,575,536 | |
| Changes in assets and liabilities: | |
| Decrease in receivable from managed funds | 2,167,107 | |
| Decrease in prepaid expenses | 102,226 | |
| Increase in receivable from sales of securities | (35,353) | |
| Decrease in other receivables | 7,849 | |
| Decrease in other assets | 109 | |
| Decrease in bonus payable | (3,256,875) | |
| Decrease in post-retirement plan liabilities | (154,253) | |
| Decrease in accounts payable and accrued liabilities | (42,359) | |
| Decrease in accrued severance | (34,024) | |
| Increase in payable for securities purchased | 106,001 | |
| Net cash used in operating activities | (3,497,991) | |
| Cash flows from investing activities | |
| Purchase of fixed assets | (4,226) | |
| Net cash used in investing activities | (4,226) | |
| Net decrease in cash | (3,502,217) | |
| Cash at beginning of the year | 4,157,676 | |
| Cash at end of the year | $ | 655,459 | |
| Supplemental disclosures of cash flow information: | |
| Income taxes paid | $ | 874 | |
| |
The accompanying notes are an integral part of these consolidated financial statements.
18
| | |
180 DEGREE CAPITAL CORP.
CONSOLIDATED STATEMENTS OF CHANGES IN NET ASSETS |
| | | | | | | | | | | |
| Year Ended
December 31, 2022 | | Year Ended December 31, 2021 |
| | | |
| Changes in net assets from operations: | | | |
| Net investment loss | $ | (2,583,203) | | | $ | (3,486,628) | |
| Net realized gain | 2,204,654 | | | 2,091,597 | |
| Net change in unrealized (depreciation) appreciation on investments | (44,652,254) | | | 15,653,189 | |
| Net (decrease) increase in net assets resulting from operations | (45,030,803) | | | 14,258,158 | |
| Net (decrease) increase in net assets | (45,030,803) | | | 14,258,158 | |
| Net Assets: | | | |
| Beginning of the year | 110,575,952 | | | 96,317,794 | |
| End of the year | $ | 65,545,149 | | | $ | 110,575,952 | |
| | | |
The accompanying notes are an integral part of these consolidated financial statements.
19
| | |
180 DEGREE CAPITAL CORP.
CONSOLIDATED FINANCIAL HIGHLIGHTS |
| | | | | | | | | | | | | | | | | | | | | | | | | | | | | | | | | | | |
| Year Ended Dec. 31, 2022 | | Year Ended Dec. 31, 2021 | | Year Ended Dec. 31 2020# | | Year Ended Dec. 31 2019# | | Year Ended Dec. 31, 2018# | | | | |
| | | | | | | | | | | | | |
| Per Share Operating Performance: | | | | | | | | | | | | | |
| Net asset value per share, beginning of the year | $ | 10.66 | | | $ | 9.28 | | | $ | 9.18 | | | $ | 7.92 | | | $ | 7.80 | | | | | |
Net investment loss* | (0.25) | | | (0.33) | | | (0.05) | | | (0.48) | | | (0.21) | | | | | |
Net realized gain (loss) from investments* | 0.21 | | | 0.20 | | | (0.11) | | | 0.93 | | | (0.75) | | | | | |
Net change in unrealized (depreciation) appreciation on investments and options*1 | (4.30) | | | 1.51 | | | 0.26 | | | 0.81 | | | 1.08 | | | | | |
| Total* | (4.34) | | | 1.38 | | | 0.10 | | | 1.26 | | | 0.12 | | | | | |
| Net (decrease) increase in net asset value | (4.34) | | | 1.38 | | | 0.10 | | | 1.26 | | | 0.12 | | | | | |
| Net asset value per share, end of the year | $ | 6.32 | | | $ | 10.66 | | | $ | 9.28 | | | $ | 9.18 | | | $ | 7.92 | | | | | |
| | | | | | | | | | | | | |
| Stock price per share, end of the year | $ | 5.28 | | | $ | 7.35 | | | $ | 6.66 | | | $ | 6.45 | | | $ | 5.25 | | | | | |
| Total return based on stock price | (28.16) | % | | 10.36 | % | | 3.26 | % | | 22.86 | % | | (11.17) | % | | | | |
| Supplemental Data: | | | | | | | | | | | | | |
| Net assets, end of the year | $ | 65,545,149 | | | $ | 110,575,952 | | | $ | 96,317,794 | | | $ | 95,213,639 | | | $ | 82,034,768 | | | | | |
| Ratio of expenses to average net assets | 3.20 | % | ^ | 5.87 | % | ^ | 4.61 | % | ^ | 6.42 | % | ^ | 3.63 | % | ^ | | | |
| Ratio of net investment loss to average net assets | (2.88) | % | | (3.26) | % | | (0.59) | % | | (5.42) | % | | (2.82) | % | | | | |
| Portfolio turnover | 30.95 | % | | 44.46 | % | | 35.16 | % | | 30.17 | % | | 20.43 | % | | | | |
| Number of shares outstanding, end of the year | 10,373,820 | | | 10,373,820 | | | 10,373,820 | | | 10,373,820 | | | 10,373,820 | | | | | |
# Reflect a 1-for-3 reverse stock split that became effective on January 4, 2021.
* Based on average shares outstanding.
^ The Company has entered into an expense offsetting arrangement with one of its unaffiliated brokers relating to broker fees paid. The total broker fee charged to the Company was applied as a credit to fees charged by an affiliate of the unaffiliated broker who the Company subscribes to for data services billed during the year. The Company received an offset to expense totaling approximately $20,600, $84,800, $31,900, $15,700, and $17,500 with that broker for the years ended December 31, 2022-2018, respectively.
1 Net unrealized losses include rounding adjustments to reconcile change in net asset value per share.
The accompanying notes are an integral part of these consolidated financial statements.
20
| | | | | | | | | | | | | | | | | | | | | | | | | | | | | |
| 180 DEGREE CAPITAL CORP. CONSOLIDATED SCHEDULE OF INVESTMENTS AS OF DECEMBER 31, 2022 |
| | | | | | | | | |
| Method of
Valuation (1) | | Industry | | Shares/Units | | Cost | | Value |
| | | | | | | | | | | | | | | | | | | | | | | | | | | | | |
| Investments in Unaffiliated Equity and Equity-Related Securities (2) - | | | | | | | | | |
| 53.3% of net assets at value | | | | | | | | | |
| | | | | | | | | |
| Unaffiliated Publicly Traded Equity and Equity-Related Securities - | | | | | | | | | |
| 43.3% of net assets at value | | | | | | | | | |
| | | | | | | | | |
| Alta Equipment Group, Inc. | | | Trading Companies & Distributors | | | | | | |
| Operates as an industrial and construction equipment company | | | | | | | | | |
| Common Stock | (M) (L1) | | | | 445,064 | | $ | 3,714,065 | | | $ | 5,870,394 | |
| | | | | | | | | |
| Ascent Industries Co. (3) | | | Steel | | | | | | |
| Manufactures metals and chemicals | | | | | | | | | |
| Common Stock | (M) (L1) | | | | 278,057 | | 2,990,139 | | | 2,410,754 | |
| | | | | | | | | |
| Commercial Vehicle Group, Inc. (3) | | | Construction Machinery & Heavy Trucks | | | | | | |
| Supplier of vehicle components | | | | | | | | | |
| Common Stock | (M) (L1) | | | | 553,629 | | 3,520,855 | | | 3,770,213 | |
| | | | | | | | | |
| D-Wave Quantum, Inc. (3)(4)(5) | | | Technology Hardware, Storage & Peripherals | | | | | | |
| Develops high-performance quantum computing systems | | | | | | | | | |
| Common Stock | (M) (L1) | | | | 911,938 | | 1,238,050 | | | 1,313,191 | |
| | | | | | | | | |
| Intevac, Inc. (3) | | | Technology Hardware, Storage & Peripherals | | | | | | |
| Develops solutions for the application and engineering of thin-films | | | | | | | | | |
| Common Stock | (M) (L1) | | | | 1,100,572 | | 5,484,766 | | | 7,120,701 | |
| | | | | | | | | |
| Jerash Holdings US, Inc. | | | Apparel, Accessories & Luxury Goods | | | | | | |
| Manufactures ready-made sport and outerwear in Jordan | | | | | | | | | |
| Common Stock | (M) (L1) | | | | 135,617 | | 862,705 | | | 527,550 | |
| | | | | | | | | |
| Lantronix, Inc. (3) | | | Communications Equipment | | | | | | |
| Provides secure data access and management solutions | | | | | | | | | |
| Common Stock | (M) (L1) | | | | 514,132 | | 2,896,688 | | | 2,221,050 | |
| | | | | | | | | |
The accompanying notes are an integral part of these consolidated financial statements.
21
| | | | | | | | | | | | | | | | | | | | | | | | | | | | | |
| 180 DEGREE CAPITAL CORP. CONSOLIDATED SCHEDULE OF INVESTMENTS AS OF DECEMBER 31, 2022 |
| | | | | | | | | |
| Method of
Valuation (1) | | Industry | | Shares/Units | | Cost | | Value |
| | | | | | | | | | | | | | | | | | | | | | | | | | | | | |
| Investments in Unaffiliated Equity and Equity-Related Securities (2) - | | | | | | | | | |
| 53.3% of net assets at value (cont.) | | | | | | | | | |
| | | | | | | | | |
| Unaffiliated Publicly Traded Equity and Equity-Related Securities - | | | | | | | | | |
| 43.3% of net assets at value (cont.) | | | | | | | | | |
| | | | | | | | | |
| Quantum Corporation (3) | | | Technology Hardware, Storage & Peripherals | | | | | | |
| Provides high-density data storage and high-speed data processing solutions | | | | | | | | | |
| Common Stock | (M) (L1) | | | | 3,102,812 | | $ | 8,843,263 | | | $ | 3,382,065 | |
| | | | | | | | | |
| RF Industries, Ltd. (3) | | | Electronic Manufacturing Services | | | | | | |
| Provides products that enable wired and wireless communications | | | | | | | | | |
| Common Stock | (M) (L1) | | | | 336,470 | | 2,333,739 | | | 1,729,456 | |
| | | | | | | | | |
| Miscellaneous Common Stock (6) | (M) (L1) | | | | | | 3,264 | | | 3,291 | |
| | | | | | | | | |
| Total Unaffiliated Publicly Traded Equity and Equity-Related Securities (cost: $31,887,534) | | | | | | | | | $ | 28,348,665 | |
| | | | | | | | | |
| Unaffiliated Legacy Privately Held Equity and Equity-Related Securities - | | | | | | | | | |
| 10.0% of net assets at value | | | | | | | | | |
| | | | | | | | | |
| AgBiome, LLC (3)(7) | | | Fertilizers & Agricultural Chemicals | | | | | | |
| Develops agricultural products that reduce risk and improve yield | | | | | | | | | |
| Series A-1 Convertible Preferred Units (acquired 1/30/13) | (H) (L3) | | | | 2,000,000 | | $ | 2,000,000 | | | $ | 4,372,191 | |
| Series A-2 Convertible Preferred Units (acquired 4/9/13-10/15/13) | (H) (L3) | | | | 417,392 | | 521,740 | | | 913,762 | |
| Series B Convertible Preferred Units (acquired 8/7/15) | (H) (L3) | | | | 160,526 | | 500,006 | | | 364,581 | |
| | | | | | | | 3,021,746 | | | 5,650,534 | |
| | | | | | | | | |
| AutoTech Ventures Management I, LLC (7)(8) | | | Asset Management & Custody Banks | | | | | | |
| Venture capital investing in automotive-related companies | | | | | | | | | |
| LLC Interests (acquired 12/1/17) | (M) (L3) | | | | 0 | | 0 | | | 218,534 | |
| | | | | | | | | |
The accompanying notes are an integral part of these consolidated financial statements.
22
| | | | | | | | | | | | | | | | | | | | | | | | | | | | | |
| 180 DEGREE CAPITAL CORP. CONSOLIDATED SCHEDULE OF INVESTMENTS AS OF DECEMBER 31, 2022 |
| | | | | | | | | |
| Method of
Valuation (1) | | Industry | | Shares/Units | | Cost | | Value |
| | | | | | | | | | | | | | | | | | | | | | | | | | | | | |
| Investments in Unaffiliated Equity and Equity-Related Securities (2) - | | | | | | | | | |
| 53.3% of net assets at value (cont.) | | | | | | | | | |
| | | | | | | | | |
| Unaffiliated Legacy Privately Held Equity and Equity-Related Securities - | | | | | | | | | |
| 10.0% of net assets at value (cont.) | | | | | | | | | |
| | | | | | | | | |
| Magnolia Neurosciences Corporation (5)(7)(9) | | | Pharmaceuticals | | | | | | |
| Develops novel therapeutics for treatment of neurodegeneration | | | | | | | | | |
| Series A Convertible Preferred Stock (acquired 8/3/18) | (I) (L3) | | | | 862,872 | | $ | 748,536 | | | $ | 121,576 | |
| | | | | | | | | |
| Nanosys, Inc. (3)(5)(7)(10) | | | Specialty Chemicals | | | | | | |
| Develops inorganic nanowires and quantum dots for use in LED-backlit devices | | | | | | | | | |
| Series A-1 Convertible Preferred Stock (acquired 5/22/21) | (I) (L3) | | | | 496,572 | | 496,573 | | | 110,708 | |
| Series A-2 Convertible Preferred Stock (acquired 5/22/21) | (I) (L3) | | | | 2,232,001 | | 4,500,003 | | | 394,221 | |
| | | | | | | | 4,996,576 | | | 504,929 | |
| | | | | | | | | |
| Phylagen, Inc. (3)(5)(7)(9) | | | Research & Consulting Services | | | | | | |
| Develops technology to improve human health and business productivity | | | | | | | | | |
| Series A Convertible Preferred Stock (acquired 11/14/18) | (I) (L3) | | | | 548,031 | | 233,845 | | | 0 | |
| | | | | | | | | |
| Ravenna Pharmaceuticals, Inc. (3)(5)(9)(11) | | | Pharmaceuticals | | | | | | |
| Holding company for intellectual property in oncology therapeutics | | | | | | | | | |
| Common Stock (acquired 5/14/20-8/26/21) | (M) (L3) | | | | 2,785,274 | | 108,258 | | | 16,414 | |
| Total Unaffiliated Legacy Privately Held Equity and Equity-Related Securities (cost: $9,108,961) | | | | | | | | | $ | 6,511,987 | |
| | | | | | | | | |
| Total Investments in Unaffiliated Equity and Equity-Related Securities (cost: $40,996,495) | | | | | | | | | $ | 34,860,652 | |
| | | | | | | | | |
The accompanying notes are an integral part of these consolidated financial statements.
23
| | | | | | | | | | | | | | | | | | | | | | | | | | | | | |
| 180 DEGREE CAPITAL CORP. CONSOLIDATED SCHEDULE OF INVESTMENTS AS OF DECEMBER 31, 2022 |
| | | | | | | | | |
| Method of
Valuation (1) | | Industry | | Shares/Units | | Cost | | Value |
| | | | | | | | | | | | | | | | | | | | | | | | | | | | | |
| Investments in Non-Controlled Affiliated Equity and Equity-Related Securities (2) - | | | | | | | | | |
| 38.2% of net assets at value | | | | | | | | | |
| | | | | | | | | |
| Non-Controlled Affiliated Publicly Traded Equity and Equity-Related Securities - | | | | | | | | | |
| 38.0% of net assets at value | | | | | | | | | |
| | | | | | | | | |
| Arena Group Holdings, Inc. (3)(12) | | | Interactive Media & Services | | | | | | |
| Provides a shared digital publishing, advertising and distribution platform | | | | | | | | | |
| Common Stock | (M) (L1) | | | | 767,869 | | $ | 8,836,074 | | | $ | 8,147,090 | |
| | | | | | | | | |
| Comscore, Inc. (3)(12) | | | Advertising | | | | | | |
| Provides technology and services that measure audiences, brands and consumer behavior | | | | | | | | | |
| Common Stock | (M) (L1) | | | | 3,909,475 | | 9,577,898 | | | 4,534,991 | |
| | | | | | | | | |
| Potbelly Corporation (3)(12) | | | Restaurants | | | | | | |
| Operates a chain of sandwich shops | | | | | | | | | |
| Common Stock | (M) (L1) | | | | 1,587,769 | | 7,070,549 | | | 8,843,873 | |
| | | | | | | | | |
| Synchronoss Technologies, Inc. (3)(12) | | | Application Software | | | | | | |
| Provides white-label cloud storage, messaging and other digital analytic services | | | | | | | | | |
| Common Stock | (M) (L1) | | | | 5,467,081 | | 11,528,359 | | | 3,379,203 | |
| | | | | | | | | |
| Total Non-Controlled Affiliated Publicly Traded Equity and Equity-Related Securities (cost: $37,012,880) | | | | | | | | | $ | 24,905,157 | |
| | | | | | | | | |
The accompanying notes are an integral part of these consolidated financial statements.
24
| | | | | | | | | | | | | | | | | | | | | | | | | | | | | |
| 180 DEGREE CAPITAL CORP. CONSOLIDATED SCHEDULE OF INVESTMENTS AS OF DECEMBER 31, 2022 |
| | | | | | | | | |
| Method of
Valuation (1) | | Industry | | Shares/Units | | Cost | | Value |
| | | | | | | | | | | | | | | | | | | | | | | | | | | | | |
| Investments in Non-Controlled Affiliated Equity and Equity-Related Securities (2) - | | | | | | | | | |
| 38.2% of net assets at value (cont.) | | | | | | | | | |
| | | | | | | | | |
| Non-Controlled Affiliated Legacy Privately Held Equity and Equity-Related Securities - | | | | | | | | | |
| 0.2% of net assets at value | | | | | | | | | |
| | | | | | | | | |
| EchoPixel, Inc. (3)(5)(7) | | | Health Care Equipment | | | | | | |
| Develops virtual reality 3-D visualization software for life sciences and health care applications | | | | | | | | | |
| Series Seed Convertible Preferred Stock (acquired 6/21/13-6/30/14) | (I) (L3) | | | | 4,194,630 | | $ | 1,250,000 | | | $ | 78,993 | |
| Series Seed-2 Convertible Preferred Stock (acquired 1/22/16) | (I) (L3) | | | | 1,476,668 | | 500,000 | | | 28,553 | |
| Series A-2 Convertible Preferred Stock (acquired 3/23/17) | (I) (L3) | | | | 1,471,577 | | 350,000 | | | 51,340 | |
| | | | | | | | 2,100,000 | | | 158,886 | |
| | | | | | | | | |
| HALE.life Corporation (3)(5)(7) | | | Health Care Technology | | | | | | |
| Develops a platform to facilitate precision health and medicine | | | | | | | | | |
| Common Stock (acquired 3/1/16) | (I) (L3) | | | | 1,000,000 | | 10 | | | 0 | |
| Series Seed-1 Convertible Preferred Stock (acquired 3/28/17) | (I) (L3) | | | | 11,000,000 | | 1,896,920 | | | 0 | |
| Series Seed-2 Convertible Preferred Stock (acquired 12/28/18) | (I) (L3) | | | | 12,083,132 | | 2,500,000 | | | 0 | |
| | | | | | | | 4,396,930 | | | 0 | |
| | | | | | | | | |
| Total Non-Controlled Affiliated Legacy Privately Held Equity and Equity-Related Securities (cost: $6,496,930) | | | | | | | | | $ | 158,886 | |
| | | | | | | | | |
| Total Investments in Non-Controlled Affiliated Equity and Equity-Related Securities (cost: $43,509,810) | | | | | | | | | $ | 25,064,043 | |
| | | | | | | | | |
The accompanying notes are an integral part of these consolidated financial statements.
25
| | | | | | | | | | | | | | | | | | | | | | | | | | | | | |
| 180 DEGREE CAPITAL CORP. CONSOLIDATED SCHEDULE OF INVESTMENTS AS OF DECEMBER 31, 2022 |
| | | | | | | | | |
| Method of
Valuation (1) | | Industry | | Shares/Units | | Cost | | Value |
| | | | | | | | | | | | | | | | | | | | | | | | | | | | | |
| Controlled Affiliated Equity and Equity-Related Securities (2) - | | | | | | | | | |
| 4.1% of net assets at value | | | | | | | | | |
| | | | | | | | | |
| Parabellum Acquisition Partners, LLC (3)(7) | | | Specialized Finance | | | | | | |
| Holding company for Special Purpose Acquisition Company (SPAC) interests | | | | | | | | | |
| Membership Units (acquired 4/22/21) | (M) (L3) | | | | 693,151 | | $ | 2,923,003 | | | $ | 2,706,572 | |
| | | | | | | | | |
| Total Controlled Affiliated Equity and Equity-Related Securities (cost: $2,923,003) | | | | | | | | | $ | 2,706,572 | |
| | | | | | | | | |
| Total Investments in Publicly Traded Equity and Equity-Related Securities and Legacy Privately Held Equity and Equity-Related Securities (cost: $87,429,308) | | | | | | | | | $ | 62,631,267 | |
| | | | | | | | | |
| Derivative Securities - | | | | | | | | | |
| 0.3% of net assets at value | | | | | | | | | |
| | | | | | | | | |
| Unaffiliated Derivative Securities (2) - | | | | | | | | | |
| 0.0% of net assets at value | | | | | | | | | |
| | | | | | | | | |
| Magnolia Neurosciences Corporation (5)(7)(9) | | | Pharmaceuticals | | | | | | |
| Developed neurodegeration therapeutics | | | | | | | | | |
| Warrants for the Purchase of Common Stock expiring 8/3/28 (acquired 8/26/21) | (I) (L3) | | | | 138,059 | | | $ | 112,854 | | | $ | 0 | |
| | | | | | | | | |
| OpGen, Inc. (3) | | | Biotechnology | | | | | | |
| Developing genomic analysis tools | | | | | | | | | |
| Warrants for the Purchase of Common Stock expiring 2/17/25 | (I) (L3) | | | | 62 | | 785 | | | 0 | |
| | | | | | | | | |
| Total Unaffiliated Derivative Securities (cost: $113,639) | | | | | | | | | $ | 0 | |
| | | | | | | | | |
| Non-Controlled Affiliated Derivative Securities (2) - | | | | | | | | | |
| 0.3% of net assets at value | | | | | | | | | |
| | | | | | | | | |
| Potbelly Corporation (3)(12) | | | Restaurants | | | | | | |
| Operates a chain of sandwich shops | | | | | | | | | |
| Warrants for the Purchase of Common Stock expiring 2/12/26 | (I) (L3) | | | | 80,605 | | $ | 224,849 | | | $ | 215,631 | |
| | | | | | | | | |
| Total Non-Controlled Affiliated Derivative Securities (cost: $224,849) | | | | | | | | | $ | 215,631 | |
| | | | | | | | | |
| Total Derivative Securities (cost: $338,488) | | | | | | | | | $ | 215,631 | |
| | | | | | | | | |
| Total Investments (cost: $87,767,796) | | | | | | | | | $ | 62,846,898 | |
| | | | | | | | | |
The accompanying notes are an integral part of these consolidated financial statements.
26
| | | | | | | | | | | | | | | | | | | | | | | | | | | | | |
| 180 DEGREE CAPITAL CORP. CONSOLIDATED SCHEDULE OF INVESTMENTS AS OF DECEMBER 31, 2022 |
| | | | | | | | | |
| Method of
Valuation (1) | | Industry | | Shares/Units | | Cost | | Value |
| | | | | | | | | | | | | | | | | | | | | | | | | | | | | |
| Other Financial Instruments (13) - | | | | | | | | | |
| | | | | | | | | |
| Unaffiliated Rights to Payments (Illiquid) (2) - | | | | | | | | | |
| 4.3% of net assets at value | | | | | | | | | |
| | | | | | | | | |
| Rights to Milestone Payments from Acquisition of BioVex Group, Inc. (acquired 3/4/11) (3)(5)(7)(14) | (I) (L3) | | Biotechnology | | $ | 548,998 | | | $ | 548,998 | | | $ | 0 | |
| | | | | | | | | |
| Rights to Milestone Payments from Acquisition of TARA Biosystems, Inc. (acquired 4/1/22) (3)(5)(7)(15) | (I) (L3) | | Pharmaceuticals | | $ | 2,771,540 | | | 2,771,540 | | | 2,842,814 | |
| | | | | | | | | |
| Total Unaffiliated Rights to Payments (cost: $3,320,538) | | | | | | | | | $ | 2,842,814 | |
| | | | | | | | | |
| Total Investments in Publicly Traded and Privately Held Equity and Equity-Related Securities, Derivative Securities and Other Financial Instruments (cost: $91,088,334) | | | | | | | | | $ | 65,689,712 | |
The accompanying notes are an integral part of these consolidated financial statements.
27
180 DEGREE CAPITAL CORP.
NOTES TO CONSOLIDATED SCHEDULE OF INVESTMENTS AS OF DECEMBER 31, 2022
Notes to Consolidated Schedule of Investments
(1)See Note 2. Summary of Significant Accounting Policies: Portfolio Investment Valuation.
(2)Investments in unaffiliated securities consist of investments in which the Company owns less than five percent of the voting shares of the portfolio company. Investments in non-controlled affiliated securities consist of investments in which the Company owns five percent or more, but less than 25 percent, of the voting shares of the portfolio company, or where the Company controls one or more seats on the portfolio company’s board of directors but do not control the company. Investments in controlled affiliated securities consist of investments in which the Company owns 25 percent or more of the outstanding voting rights of the portfolio company or otherwise control the company, including control of a majority of the seats on the board of directors, or more than 25 percent of the seats on the board of directors, with no other entity or person in control of more director seats than us.
(3)Represents a non-income producing investment. Investments that have not paid dividends or interest within the last 12 months or are on non-accrual status for at least 12 consecutive months are considered to be non-income producing.
(4)D-Wave Quantum Inc., ("QBTS") was formed through the merger of D-Wave Systems, Inc., and DPCM Capital, Inc., a special purpose acquisition company (SPAC). D-Wave Systems, Inc. was a legacy private portfolio holding of the Company. The Company initially invested in D-Wave Systems, Inc. starting in 2008 and through 2014, acquiring various classes of preferred stock. While the shares of QBTS owned by the Company are registered, the Company entered into a lockup agreement with QBTS that prevents the Company from trading or hedging these shares until February 5, 2023.
(5)These securities are held by the Company's wholly owned subsidiary, 180 Degree Private Holdings, LLC ("180PH"), which were transferred from the Company to 180PH in the fourth quarter of 2020. The acquisition dates of the securities reflect the dates such securities were obtained by the Company rather than the transfer date.
(6)The identities of these securities have been concealed while the Company completes a purchase or selling program for these securities.
(7)The Company is subject to legal restrictions on the sale of all or a portion of our investment(s) in this company. The total amount of restricted securities held is $12,220,259, or 18.6 percent of net assets.
(8)The Company received LLC Interests of 1.25 percent in AutoTech Ventures Management I, LLC ("AutoTech") pursuant to an Administrative Services Agreement between us and AutoTech and due to us following the termination of a former employee of the Company. These LLC Interests were separate from the compensation received for providing the administrative services under the agreement that were paid in cash. The LLC interests have a capital percentage of 0 percent.
(9)Represents a non-operating entity that exists to collect future payments from licenses or other engagements, monetize assets for future distributions to investors and debt holders, or is in the process of shutting down and distributing remaining assets according to a liquidation waterfall.
(10)The Company invested in Nanosys, Inc. in rounds of financing that occurred in 2003, 2004 and 2005. In May 2021, Nanosys completed a restructuring of its capitalization table that resulted in shares of Series C and Series D Preferred Stock being converted into shares of Series A-2 Preferred Stock and Series E Preferred Stock being converted into shares of Series A-1 Preferred Stock. The date of acquisition listed reflects the date of this conversion rather than the date of our investment in the company.
(11)The Company received shares of Ravenna Pharmaceuticals, Inc., as part of the consideration of the acquisition of Petra Pharma Corporation.
(12)The Company is the Investment Manager of a separately managed account ("SMA") that owns shares of these portfolio companies. Under our investment management agreement for this SMA, the Company has the right to control the votes of the securities held by the SMA. The Company has voting ownership between 5 percent and 25 percent in these companies when the shares held by us and our SMA are aggregated.
The accompanying notes are an integral part of these consolidated financial statements.
28
180 DEGREE CAPITAL CORP.
NOTES TO CONSOLIDATED SCHEDULE OF INVESTMENTS AS OF DECEMBER 31, 2022
(13)Other financial instruments are holdings of the Company that do not meet the definition of a security or a derivative.
(14)If all the remaining milestones are met, the Company would receive approximately $4.1 million. There can be no assurance as to how much of these amounts the Company will ultimately realize or when they will be realized, if at all.
(15)If all the remaining milestones are met and the time-based payments are completed, the Company would receive approximately $5.7 million. Of this amount, approximately $2.4 million are solely based on time between this statement date and April 2024. There can be no assurance as to how much of the milestone-based payments will ultimately be realized or when they will be realized, if at all.
The accompanying notes are an integral part of these consolidated financial statements.
29
180 DEGREE CAPITAL CORP.
NOTES TO CONSOLIDATED FINANCIAL STATEMENTS
NOTE 1. THE COMPANY
180 Degree Capital Corp. (including its wholly owned subsidiaries the "Company," "us," "our" and "we"), withdrew its election to be treated as a business development company on March 30, 2017, and subsequently returned to its prior status as a registered non-diversified closed-end management investment company ("Closed-End Fund" or "CEF") under the Investment Company Act of 1940 (the "1940 Act"). We operate as an internally managed investment company whereby our officers and employees, under the general supervision of our Board of Directors, conduct our operations. As of May 22, 2020, we are also registered with the Securities and Exchange Commission as a Registered Investment Adviser under the Investment Advisers Act of 1940 (the "Advisers Act").
180 Degree Private Holdings, LLC ("180PH"), is a wholly owned limited liability company that was created in October 2020 to hold certain of the Company's securities of privately held companies. 180PH is consolidated for financial reporting purposes and is a disregarded entity for tax purposes under the Code.
180 Degree Capital BD, LLC ("180BD") is a 100 percent owned subsidiary of the Company. 180BD was formed to provide services to the Company related to fundraising for co-investment funds and not for investment returns. 180BD is a registered broker-dealer with the Financial Industry Regulatory Authority ("FINRA"). The Company consolidates 180BD for financial reporting purposes. 180BD is currently a disregarded entity for tax purposes under the Code.
The Company is the Managing Member of 180 Degree Capital Management, LLC ("180CM"), a limited liability company formed to facilitate the opportunity for interested investors to co-invest alongside the Company in individual publicly traded portfolio companies. As of December 31, 2022, the Company has no capital under management in 180CM.
The Company is the General Partner of 180 Phoenix Fund, L.P. ("180 Phoenix"), a limited partnership formed to facilitate management of a fund that was formed to co-invest alongside the Company in its publicly traded companies on an on-going basis. As of December 31, 2022, 180 Phoenix did not have any capital under management.
As of December 31, 2022, the Company manages approximately $18.7 million in net assets in two separately managed accounts ("SMA").
The Company may, in certain cases, receive management fees and carried interest on profits generated on invested capital from any capital under management if and when capital is raised and if and when profits are realized, respectively. The Company does not consolidate the operations of any capital managed in separate series of 180CM, or in the separately managed accounts, and it does not expect to consolidate the operations of any capital managed in 180 Phoenix if and when the entity has capital under management.
NOTE 2. SUMMARY OF SIGNIFICANT ACCOUNTING POLICIES
The following is a summary of significant accounting policies followed in the preparation of the consolidated financial statements:
Principles of Consolidation. The consolidated financial statements have been prepared in accordance with accounting principles generally accepted in the US ("GAAP") and Articles 6 and 12 of Regulation S-X of the Securities Exchange Commission ("SEC") and include the accounts of the Company and its wholly owned subsidiaries. The Company is an investment company following accounting and reporting guidance in Accounting Standards Codification 946. In accordance with GAAP and Regulation S-X under 17 C.F.R. Part 210, the Company may only consolidate its interests in investment company subsidiaries and controlled operating companies whose business consists of providing services to the Company. Our wholly owned subsidiary, 180BD, is a controlled operating company that provide services to us and is, therefore, consolidated. All significant intercompany accounts and transactions have been eliminated in the consolidation.
Use of Estimates. The preparation of the consolidated financial statements in conformity with GAAP requires management to make estimates and assumptions that affect the reported amounts of assets and liabilities and contingent assets and liabilities and the reported amounts of revenues and expenses. Actual results could differ from these estimates, and the differences could be material. The most significant estimates relate to the fair valuations of our investments.
Portfolio Investment Valuations. Investments are stated at "value" as defined in the 1940 Act and in the applicable regulations of the SEC and in accordance with GAAP. Value, as defined in Section 2(a)(41) of the 1940 Act, is (i) the market price for those securities for which a market quotation is readily available and (ii) the fair value as determined in good faith by, or under the direction of, the Board of Directors for all other assets. The Valuation Committee, comprised of all of the independent Board members, is responsible for determining the valuation of the Company’s assets within the guidelines established by the Board of Directors, pursuant with SEC Rule 2a-5. The Valuation Committee receives information and recommendations from management. An independent valuation firm also reviews select portfolio company valuations. The independent valuation firm does not provide independent valuations. The fair values assigned to these investments are based on available information and do not necessarily represent amounts that might ultimately be realized when that investment is sold, as such amounts depend on future circumstances and cannot reasonably be determined until the individual investments are actually liquidated or become readily marketable. The Valuation Committee values the Company's investment assets as of the end of each calendar quarter and as of any other time requested by the Board of Directors.
Accounting Standards Codification Topic 820, "Fair Value Measurements," ("ASC 820") defines fair value as the price that would be received to sell an asset or paid to transfer a liability in an orderly transaction between market participants at the measurement date (exit price). It applies fair value terminology to all valuations whereas the 1940 Act applies market value terminology to readily marketable assets and fair value terminology to other assets.
The main approaches to measuring fair value utilized are the market approach, the income approach and the hybrid approach.
•Market Approach (M): The market approach focuses on inputs and not techniques. The market approach may use quantitative inputs such as prices and other relevant information generated by market transactions involving identical or comparable assets or liabilities and the values of market multiples derived from a set of comparable companies. The market approach may also use qualitative inputs such as progress toward milestones, the long-term potential of the business, current and future financing requirements and the rights and preferences of certain securities versus those of other securities. The selection of the relevant inputs used to derive value under the market approach requires judgment considering factors specific to the significance and relevance of each input to deriving value.
•Income Approach (I): The income approach focuses on techniques and not inputs. The income approach uses valuation techniques to convert future amounts (for example, revenue, cash flows or earnings) to a single present value amount (discounted). The measurement is based on the value indicated by current market expectations about those future amounts. Those valuation techniques include present value techniques; option-pricing models, such as the Black-Scholes-Merton formula (a closed-form model) and a binomial model (a lattice model), which incorporate present value techniques; and the multi-period excess earnings method, which is used to measure the fair value of certain assets.
•Hybrid Approach (H): The hybrid approach uses elements of both the market approach and the income approach. The hybrid approach calculates values using the market and income approach, individually. The resulting values are then distributed among the share classes based on probability of exit outcomes.
ASC Topic 820 classifies the inputs used to measure fair value by these approaches into the following hierarchy:
•Level 1 (L1): Unadjusted quoted prices in active markets for identical assets or liabilities;
•Level 2 (L2): Inputs other than quoted prices included within Level 1 that are observable for the asset or liability, either directly or indirectly. These include quoted prices in active markets for similar assets or liabilities, or quoted prices for identical or similar assets or liabilities in markets that are not active, or inputs other than quoted prices that are observable for the asset or liability, either directly or indirectly, for substantially the full term of the financial instrument. Level 2 inputs are in those markets for which there are few transactions, the prices are not current, little public information exists or instances where prices vary substantially over time or among brokered market makers; and
•Level 3 (L3): Inputs to the valuation methodology are unobservable and significant to the fair value measurement. Unobservable inputs are those inputs that reflect our own assumptions that market participants would use to price the asset or liability based upon the best available information.
Financial assets and liabilities are classified in their entirety based on the lowest level of input that is significant to the fair value measurement and are not necessarily an indication of risks associated with the investment.
As of December 31, 2022, our financial statements include investments fair valued by the Board of Directors of $12,435,890. The fair values were determined in good faith by, or under the direction of, the Board of Directors. The fair value amount includes the values of our investments in legacy privately held companies and rights to future milestone payments, as well as our membership units of Parabellum Acquisition Holdings, LLC, an entity through which we own shares and warrants of Parabellum Acquisition Corp., and our warrants of OpGen, Inc. and Potbelly Corporation, which are securities of publicly traded companies.
Cash. Cash includes demand deposits. Cash is carried at cost, which approximates fair value.
Unaffiliated Rights to Payments. At December 31, 2022, the outstanding potential milestone payments from Amgen, Inc.’s acquisition of BioVex Group, Inc., were valued at $0. At December 31, 2022, the outstanding potential milestone and time-based payments from the acquisition of TARA Biosystems, Inc., by Valo Health, LLC were valued at $2,842,814. The milestone payments are valued using the probability-adjusted, present value of proceeds from future payments that would be due upon successful completion of certain regulatory milestones. There can be no assurance as to how much of the amounts related to milestone payments that we will ultimately realize or when they will be realized, if at all. The time-based payments are valued using a discount for time-value of money that includes estimated default risk of the acquirer.
Prepaid Expenses. We include prepaid insurance premiums in "Prepaid expenses." Prepaid insurance premiums are recognized over the term of the insurance contract and are included in "Insurance" in the Company's Consolidated Statement of Operations.
Property and Equipment. Property and equipment are included in "Other assets" and are carried at $15,157 at December 31, 2022, representing cost of $226,094, less accumulated depreciation of $210,937. Depreciation is provided using the straight-line method over the estimated useful lives of the property and equipment. We estimate the useful lives to be five to ten years for furniture and fixtures, and three years for computer equipment.
Post-Retirement Plan Liabilities. Until it was terminated on April 27, 2017, the Company provided a Retiree Medical Benefit Plan for employees who met certain eligibility requirements. Until it was terminated on May 5, 2011, the Company also provided an Executive Mandatory Retirement Benefit Plan for certain individuals employed by us in a bona fide executive or high policy-making position. The net periodic post-retirement benefit cost includes service cost and interest cost on the accumulated post-retirement benefit obligation. Unrecognized actuarial gains and losses are recognized as net periodic benefit cost, pursuant to the Company's historical accounting policy in "Salaries, bonus and benefits" in the Company's Consolidated Statement of Operations. The impact of plan amendments was amortized over the employee's average service period as a reduction of net periodic benefit cost. Unamortized prior service cost was fully amortized during 2017 as a result of the termination of the Retiree Medical Benefit Plan.
Interest Income Recognition. Interest income, including amortization of premium and accretion of discount, is recorded on an accrual basis. When accrued interest is determined not to be recoverable, the Company ceases accruing interest and writes off any previously accrued interest. Write-offs are netted in interest income. Securities are deemed to be non-income producing if investments have not paid dividends or interest within the last 12 months or are on non-accrual status for at least 12 consecutive months. When the fair value of a security that includes PIK interest is less than the accrued interest, the Company may place the security on non-accrued status.
Board Fees From Portfolio Companies. The Company recognizes revenues from fee income from board fees as those services are provided.
Management Fees and Performance Fees/Carried Interest from Managed Funds. As a Registered Investment Adviser under the Advisers Act, the Company may be entitled to receive management fees and performance fees from clients including separately managed accounts (SMAs) and special purpose vehicles (SPVs). When applicable, the Company accrues management fees on SPVs that are to be paid upon liquidation of the entity regardless of performance. Performance fees or carried interest, if any, is paid annually by SMAs based on a fixed percentage of the increase in net assets during the year. Performance fees on SPVs, if any, are generally paid based on the amount of increase in net assets at the time of any distribution of capital above the amount of initial invested capital plus accrued expenses. The timing and payment terms of management fees and performance fees for future client accounts may be different than those of our current SMAs.
Expenses that are the responsibility of client accounts are generally paid for by the Company and then reimbursed at a future date by the client accounts. Our SMA generally pays any reimbursable expenses within 30 days of invoice. As of December 31, 2022, $152,151 of expenses reimbursable to us by 180 Phoenix for formation expenses is included in “Receivable from managed funds” in our Consolidated Statement of Assets and Liabilities. If we are unable to raise funds for 180 Phoenix, or if the terms under which we raise capital do not include reimbursement for formation costs, we may not be able to collect on this receivable.
The Company does not include accruals for carried interest in the consolidated financial statements until such carried interest is received and/or the Company concludes that it is probable that a reversal of any accrual will not occur. The Company did not earn or accrue any carried interest in the year ended December 31, 2022.
Other Income. The Company may purchase restricted securities issued by publicly traded companies that include provisions that provide for payment of partial liquidated damages in the event the issuer does not meet obligations specified in the purchase agreement or other ancillary documents associated with the transaction. These obligations most commonly are associated with the filing of registration statements and/or being up to date with the filing of the issuer's financial statements with the SEC. During the year ended December 31, 2022, the Company received shares in lieu of cash valued at $1,094,014, as partial liquidated damages from Arena Group Holdings, Inc, one of its publicly traded portfolio companies. Of that amount, $891,937 settled previously recognized income; therefore during the year ended December 31, 2022, the Company recognized income of $202,077, which is recorded in "Other income" in the Company's Consolidated Statement of Operations. A certain amount of these shares, valued at $196,290, were transferable to an unrelated third party and was recorded as a realized loss on the Company's Consolidated Statement of Operations.
Put and Call Options. The Company may purchase options on publicly traded securities as an investment and/or with the intention of limiting its downside risk. When the Company purchases an option, an amount equal to the premium paid is recorded in the Consolidated Statements of Assets and Liabilities as an investment. The Company may also purchase an option at one price and write/sell an option at another price in a simultaneous transaction referred to as a spread. The amount of these assets is subsequently marked-to-market to reflect the current value of the options. In the event that the options are exercised, the Company would be required to deliver those shares to the counterparty. When the options expire unexercised, the Company realizes a loss on the premium paid, or the difference between the premium paid and the premium received, as applicable. Net realized gain from investments in purchased put options and written put options was $35,909.
Rent Expense. The Company currently leases and runs daily operations in approximately 1,250 square feet of office space in Montclair, New Jersey. Prior to November 17, 2021, the Company leased this space on a month-to-month basis at a base rent of approximately $26 per square foot per year. On November 17, 2021, the Company entered into a three-year lease extension that set the average base rent beginning January 1, 2022, at approximately $30 per square foot over the term of the extension. Either the Company or the landlord may terminate the lease at any time with two months' written notice to either party. As of December 31, 2022, the present value of the future lease payments (lease liability) is recorded as an asset and a liability in the Company's Consolidated Statement of Assets and Liabilities. The amount is calculated using weighted average discount rate of 1.32 percent and weighted based on the terms of the the lease agreement.
Realized Gain or Loss and Unrealized Appreciation or Depreciation of Portfolio Investments. Realized gain or loss is recognized when an investment is disposed of and is computed as the difference between the Company's cost basis in the investment at the disposition date and the net proceeds received from such disposition. Realized gain or loss on investment transactions are determined by specific identification. Unrealized appreciation or depreciation is computed as the difference between the fair value of the investment and the cost basis of such investment.
Income Taxes. As discussed in Note 9. Income Taxes, the Company did not qualify as a Regulated Investment Company (RIC) under Subchapter M of the Code in 2022, and was therefore taxed as a C-Corporation. The Company did not accrue for any income taxes as of December 31, 2022 as it did not generate ordinary income. While the Company did not qualify as a RIC in 2022, it currently intends to qualify as a RIC in future years. The Company has capital loss carryforwards that can be used to offset net realized capital gains. The Company also has operating loss carryforwards that can be used to offset operating income and net realized capital gains in years when it fails to qualify as a RIC. The Company recognizes interest and penalties in income tax expense. See Note 9. Income Taxes for further discussion.
Foreign Currency Translation. The accounting records of the Company are maintained in U.S. dollars. All assets and liabilities denominated in foreign currencies are translated into U.S. dollars based on the rate of exchange of such currencies against U.S. dollars on the date of valuation. If Company has assets denominated in foreign currencies, it does not isolate the portion of the results of operations that arises from changes in foreign currency rates on investments held on its Consolidated Statement of Operations.
Securities Transactions. Securities transactions are accounted for on the date the transaction for the purchase or sale of the securities is entered into by the Company (i.e., trade date). Securities transactions outside conventional channels, such as private transactions, are recorded as of the date the Company obtains the right to demand the securities purchased or to collect the proceeds from a sale and incurs the obligation to pay for the securities purchased or to deliver the securities sold.
Concentration of Credit Risk. The Company places its cash with financial institutions and, at times, cash held in depository accounts may exceed the Federal Deposit Insurance Corporation's insured limit and is subject to the credit risk of such institutions to the extent it exceeds such limit.
Recent Accounting Pronouncements and Adoptions. On June 30, 2022, the FASB issued ASU 2022-03, "'Fair Value Measurement (Topic 820): Fair Value Measurement of Equity Securities Subject to Contractual Sale Restrictions." This ASU clarifies that a contractual restriction on the sale of an equity security is not considered part of the unit of account of the equity security and, therefore, is not considered in measuring fair value. The guidance is effective for fiscal years, including interim periods within those fiscal years, beginning after December 15, 2023, and early adoption is permitted. This ASU is not expected to have a material impact on the Company's financial statements as the Company does not consider contractual restrictions (such as lock-up agreements) in the determination of fair value of its equity securities.
NOTE 3. BUSINESS RISKS AND UNCERTAINTIES
Our business activities contain elements of risk. We consider the principal types of market risk to be valuation risk, diversification risk, interest rate risk and foreign currency risk. Although we are risk-seeking rather than risk-averse in our investments, we consider the management of risk to be essential to our business.
Investment Objective
Our investment objective is to generate capital appreciation and current income from investments and investment-related activities such as managed funds and accounts.
Investment Strategy
Our investment strategy on future new investments is focused on generating capital appreciation and current income from investments in what we believe are deeply undervalued, small publicly traded companies where we believe we can positively impact the business and valuation through constructive activism. Historically, our investment strategy was to achieve long-term capital appreciation investing in venture capital investments. While we continue to provide such resources to our existing legacy portfolio companies, we no longer make venture capital investments. We classify our legacy portfolio companies as Legacy Privately Held Equity and Equity-Related Securities.
We believe we combine new perspectives with the historical knowledge and experience of managing the current portfolio. Our investment approach is comprised of a patient examination of available opportunities through due diligence and close involvement with management of our portfolio companies. We invest our capital directly into portfolio companies or through purchases of securities of publicly traded companies directly and through open-market purchases. We may seek to invest our capital alongside capital from other investors through that we control.
We have discretion in the investment of our capital to achieve our objectives by investing in various types of assets, and we do not currently limit our investments to any security type. Our investments may include, among other asset types: equity, equity-related securities (including warrants and options) and debt with equity features from either private or public issuers; debt obligations of all types having varying terms with respect to security or credit support, subordination, purchase price, interest payments and maturity; foreign securities; and miscellaneous investments.
Investment Policies
Fundamental policies may not be changed without the approval of the holders of a majority of our voting securities, as defined in the 1940 Act. As a matter of fundamental policy, the Company will not:
(1) Issue senior securities, borrow money from banks, brokers or other lenders, or engage in transactions involving the issuance by us of "senior securities" representing indebtedness, except to the extent permitted under the 1940 Act or the rules, regulations or interpretations thereof.
(2) Underwrite securities of other issuers, except insofar as we may be deemed an underwriter under the Securities Act of 1933, as amended (the "Securities Act"), in connection with the disposition of our portfolio securities. We may invest in restricted securities (those that must be registered under the Securities Act before they may be offered or sold to the public) to the extent permitted by the 1940 Act or the rules, regulations or interpretations thereof.
(3) Invest more than 25% of our total assets in the securities of companies or entities engaged in any one industry, or group of industries. This limitation does not apply to investment in the securities of the U.S. Government, its agencies or instrumentalities.
(4) Purchase or sell real estate or interests in real estate (except that we may (a) purchase and sell real estate or interests in real estate in connection with the orderly liquidation of investments, or in connection with foreclosure on collateral, or (b) own the securities of companies that are in the business of buying, selling or developing real estate).
(5) Purchase or sell commodities or commodity contracts, but we may purchase and sell foreign currency and enter into foreign currency forward contracts, and may engage in other transactions in financial instruments, in each case to the extent permitted under the Company's investment policies as in effect from time to time.
(6) Make loans of money or securities to other persons, except through purchasing fixed-income securities or other debt instruments, lending portfolio securities or entering into repurchase agreements in a manner consistent with our investment policies. With respect to these investment restrictions, if a percentage restriction is adhered to at the time of entering into the investment or transaction, a later change in percentage resulting from a change in the values of investments or the value of our total assets, unless otherwise stated or required by law, will not constitute a violation of the restriction or policy.
Valuation Risk
We historically invested in privately held companies, the securities of which are inherently illiquid. We are currently focused on investing in what we believe are deeply undervalued microcapitalization publicly traded companies. Our publicly traded and public company-related securities account for approximately 86 percent of the value of our portfolio of investments. Although these companies are publicly traded, their stock may not trade at high volumes and/or we may own a significant portion of a company's outstanding stock, which may restrict our ability to sell our positions in an orderly fashion and prices at which sales can be made may be volatile and materially different than the closing prices of such positions at each financial statement date. We may also be subject to restrictions on transfer and/or other lock-up provisions after these companies complete public offerings and/or if we invest in unregistered securities of public companies. Many of our legacy privately held and publicly traded companies tend to not have attained profitability, and many of these companies also lack management depth and have limited or no history of operations. Because of the speculative nature of our investments and the lack of a liquid market for and restrictions on transfers of privately held investments, there is greater risk of loss relative to traditional marketable investment securities.
Approximately 19 percent of our portfolio was fair valued and comprised of securities of legacy privately held companies and rights to potential future milestone payments, as well as our warrants of OpGen, Inc. and Potbelly Corporation (Level 3 investments) which are securities of publicly traded companies and our membership units of Parabellum Acquisition Holdings, LLC (Level 3 investments) which is a holding company for special purpose acquisition company (SPAC) interests. Because there is typically no public or readily ascertainable market for our interests in the small privately held companies in which we invest, the valuation of the securities in that portion of our portfolio is determined in good faith by our Valuation Committee, which is comprised of all of the independent members of our Board of Directors. The values are determined in accordance with our Valuation Procedures and are subject to significant estimates and judgments. The fair value of the securities in our portfolio may differ significantly from the values that would be placed on these securities if a ready market for the securities existed. Additionally, inputs may become available after a financial statement date that could result in a material change in value at a future financial statement date from the value reported in the current financial statements. Any changes in valuation are recorded in the Company's Consolidated Statement of Operations as "Change in unrealized appreciation (depreciation) on investments." Changes in valuation of any of our investments in privately held companies from one period to another may be significant.
Diversification Risk
While we are subject to certain diversification requirements regarding the concentration of investments in any one industry or group of industries, we do not choose investments based on a strategy of diversification. We also do not rebalance the portfolio should one of our portfolio companies increase in value substantially relative to the rest of the portfolio. Therefore, the value of our portfolio may be more vulnerable to microeconomic events affecting a single sector, industry or portfolio company and to general macroeconomic events that may be unrelated to our portfolio companies. These factors may subject the value of our portfolio to greater volatility than a company that follows a diversification strategy. As of December 31, 2022 our largest 10 investments by value accounted for approximately 81 percent of the value of our investment portfolio. Our largest three investments, by value, Potbelly Corporation, Arena Group Holdings, Inc., and Intevac, Inc., accounted for approximately 13 percent, 12 percent and 11 percent, respectively, of our investment portfolio at December 31, 2022. Potbelly Corporation, Arena Group Holdings, Inc., and Intevac, Inc. are publicly traded companies.
Interest Rate Risk
Interest rate sensitivity refers to the change in earnings that may result from changes in the level of interest rates. We may invest in both short- and long-term U.S. government and agency securities. To the extent that we invest in short- and long-term U.S. government and agency securities, changes in interest rates result in changes in the value of these obligations that result in an increase or decrease of our net asset value. The level of interest rate risk exposure at any given point in time depends on the market environment, the expectations of future price and market movements, and the quantity and duration of long-term U.S. government and agency securities held by the Company, and it will vary from period to period.
In addition, market interest rates for high-yield corporate debt may be an input in determining value of our investments in debt securities of privately held and publicly traded companies. Significant changes in these market rates could affect the value of our debt securities as of the valuation date of measurement of value. While we do not currently have any investments in debt securities with floating interest rates, investment income in such securities should we acquire them in the future could be adversely affected by changes in interest rates, including any that might result from the anticipated transition away from the London Interbank Offered Rate ("LIBOR"). In March 2021, LIBOR's administrator announced that most LIBOR settings will no longer be published after the end of 2021, and that a majority of U.S. dollar LIBOR settings will no longer be published after June 30, 2023. To the extent we acquire investments with floating interest rates tied to LIBOR, this transition could result in losses for the Company.
Foreign Currency Risk
Our investments are not subject to foreign currency risk as they are all denominated in U.S. dollars. We have one investment in a company based in Canada, D-Wave Quantum, Inc., however the price per share and terms of those shares are denominated in U.S. dollars.
Coronavirus (COVID-19) Pandemic
In March 2020, the World Health Organization declared COVID-19 (a novel coronavirus) to be a pandemic. Global financial markets have experienced and may continue to experience significant volatility resulting from the spread of COVID-19. The outbreak of COVID-19 has resulted in travel and border restrictions, quarantines, supply chain disruptions, lower consumer demand and general market uncertainty. The global economy, the economies of certain nations and individual issuers have been and may continue to be adversely affected by COVID-19, particularly in light of the interconnectivity between economies and financial markets, all of which may negatively impact the Company's performance. In addition, COVID-19 and governmental responses to COVID-19 may negatively impact the capabilities of the Company's service providers and disrupt the Company's operations.
Beginning in the first quarter of 2021, there has been a trend in many parts of the world of increasing availability and administration of vaccines against COVID-19, as well as an easing of restrictions on social, business, travel and government activities and functions. On the other hand, infection rates and regulations continue to fluctuate in various regions and there are ongoing global impacts resulting from the pandemic, including challenges and increases in costs for logistics and supply chains, such as increased port congestion, intermittent supplier delays and a shortfall of microchip supply. Management of the Company will continue to monitor the impact of COVID-19 on its business.
NOTE 4. FAIR VALUE OF INVESTMENTS
At December 31, 2022, our financial assets valued at fair value were categorized as follows in the fair value hierarchy:
| | | | | | | | | | | | | | | | | | | | | | | | | | |
| | | Fair Value Measurement at Reporting Date Using: |
Description | | Unadjusted Quoted Prices in Active Markets for Identical Assets (Level 1) | |
Significant Other Observable Inputs (Level 2) | |
Significant Unobservable Inputs (Level 3) | | December 31, 2022 |
| Legacy Privately Held Equity and Equity-Related Securities: | | | | | | | | |
| Preferred Stock / Units | | $ | 0 | | | $ | 0 | | | $ | 6,435,925 | | | $ | 6,435,925 | |
| | | | | | | | |
| Common Stock / Membership Units | | 0 | | | 0 | | | 16,414 | | | 16,414 | |
| Warrants | | 0 | | | 0 | | | 0 | | | 0 | |
| LLC Interests | | 0 | | | 0 | | | 218,534 | | | 218,534 | |
| | | | | | | | |
| Publicly Traded Equity and Equity-Related Securities: | | | | | | | | |
| | | | | | | | |
| | | | | | | | |
| Common Stock / Membership Units | | $ | 53,253,822 | | | $ | 0 | | | $ | 2,706,572 | | | $ | 55,960,394 | |
| Warrants | | 0 | | | 0 | | | 215,631 | | | 215,631 | |
| Total Investments: | | $ | 53,253,822 | | | $ | 0 | | | $ | 9,593,076 | | | $ | 62,846,898 | |
| | | | | | | | |
| Other Financial Instruments: | | | | | | | | |
| Rights to Milestone Payments | | $ | 0 | | | $ | 0 | | | $ | 2,842,814 | | | $ | 2,842,814 | |
| Total Financial Assets: | | $ | 53,253,822 | | | $ | 0 | | | $ | 12,435,890 | | | $ | 65,689,712 | |
Significant Unobservable Inputs
The table below presents the valuation technique and quantitative information about the significant unobservable inputs utilized by the Company in the fair value measurements of Level 3 assets. Unobservable inputs are those inputs for which little or no market data exists and, therefore, require an entity to develop its own assumptions.
| | | | | | | | | | | | | | | | | | | | | | | |
| Value as of December 31, 2022 | | Valuation Approach(es) | | Unobservable Input(s) | | Range(s) (Weighted Average(a)) |
| | | | | | | |
| | | | | Public Comparable Adjustment (Including Non-Performance Risk) | | -48.1% (-48.1%) |
| | | | | Price Per Share | | $3.07 ($3.07) |
| | | | | Volatility | | 81.2% (81.2%) |
| Preferred Stock / Units | $ | 5,650,534 | | | Hybrid Approach | | Time to Exit / Cash Flows (Years) | | 5.0 (5.0) |
| | | | | | | |
| | | | | Price Per Share | | $0.00 - $0.49 ($0.40) |
| | | | | Public Comparable Adjustment (Including Non-Performance Risk) | | -100.0% - -28.3% (-43.0%) |
| | | | | Volatility | | 88.6% - 101.7% (91.7%) |
| Preferred Stock / Units | 785,391 | | | Income Approach | | Time to Exit / Cash Flows (Years) | | 5.0 (5.0) |
| | | | | | | |
| | | | | | | |
| | | | | | | |
| | | | | | | |
| | | | | | | |
| | | | | | | |
| | | | | | | |
| | | | | | | |
| | | | | | | |
| | | | | | | |
| | | | | | | |
| | | | | | | |
| | | | | | | |
| | | | | | | |
| | | | | | | |
| | | | | | | |
| | | | | | | |
| | | | | | | |
| Common Stock / Membership Units | 0 | | | Income Approach | | Non-Performance Risk | | -100.0% (-100.0%) |
| | | | | Probability of Successful SPAC Merger Transaction | | 33.0% (33.0%) |
| | | | | | | |
| | | | | | | |
| | | | | | | |
| | | | | Volatility | | 78.2% (78.2%) |
| | | | | Time to Exit/Lapse of Restrictions (Years) | | 0.2 (0.2) |
| | | | | Discount for Lack of Marketability | | -9.3% (-9.3%) |
| Common Stock / Membership Units | 2,722,986 | | | Market Approach | | Price Per Share | | $0.01 ($0.01) |
| | | | | Price Per Share | | $0.00 ($0.00) |
| | | | | Volatility | | 0.0% - 117.7% (67.3%) |
| Warrants | 215,631 | | | Income Approach | | Time to Exit (Years) | | 0.0 - 3.1 (3.1) |
| LLC Interests | 218,534 | | | Market Approach | | Bid/Ask | | $150,000-$300,000 ($225,000) |
| | | | | Probability of Achieving Independent Milestones | | 0.0% - 100.0% (93.2%) |
| | | | | Probability of Achieving Dependent Milestones | | 0.0% - 18.3% (15.5%) |
| Rights to Milestone Payments | 2,842,814 | | | Income Approach | | Time to Cash Flows (Years) | | 0.2 - 3.3 (1.0) |
| | | | | | | |
| | | | | | | |
| Total | $ | 12,435,890 | | | | | | | |
(a) Weighted average based on fair value at December 31, 2022.
Valuation Methodologies and Inputs for Level 3 Assets
The following sections describe the valuation techniques and significant unobservable inputs used to measure Level 3 assets.
Preferred Stock, Preferred Units, LLC Interests, Common Stock and Common Units
Preferred stock, preferred units, LLC interests, bridge notes, common stock and common units are valued by either a market, income or hybrid approach using internal models with inputs, most of which are not market observable. Common inputs for valuing Level 3 investments include prices from recently executed private transactions in a company’s securities or unconditional firm offers, revenue multiples of comparable publicly traded companies, merger and acquisition ("M&A") transactions consummated by comparable companies, discounts for lack of marketability, rights and preferences of the class of securities we own as compared with other classes of securities the portfolio company has issued, particularly related to potential liquidity scenarios of an initial public offering ("IPO") or an acquisition transaction, estimated time to exit, volatilities of comparable publicly traded companies and management’s best estimate of risk attributable to non-performance risk. Certain securities are valued using the present value of future cash flows.
We may also consider changes in market values for sets of comparable companies when recent private transaction information is not available and/or in consideration of non-performance risk. We define non-performance risk as the risk that the price per share (or implied valuation of a portfolio company) or the effective yield of a debt security of a portfolio company, as applicable, does not appropriately represent the risk that a portfolio company with negative cash flow will be: (a) unable to raise capital, will need to be shut down and will not return our invested capital; or (b) able to raise capital, but at a valuation significantly lower than the implied post-money valuation of the last round of financing. We assess non-performance risk for each private portfolio company quarterly. Our assessment of non-performance risk typically includes an evaluation of the financial condition and operating results of the company, the company's progress towards milestones, and the long-term potential of the business and technology of the company and how this potential may or may not affect the value of the shares owned by us. An increase to the non-performance risk or a decrease in the private offering price of a future round of financing from that of the most recent round would result in a lower fair value measurement and/or a change in the distribution of value among the classes of securities we own.
Option pricing models place a high weighting on liquidation preferences, which means that small differences in how the preferences are structured can have a material effect on the fair value of our securities at the time of valuation and also on future valuations should additional rounds of financing occur with senior preferences. As such, valuations calculated by option pricing models may not increase if 1) rounds of financing occur at higher prices per share, 2) liquidation preferences include multiples on investment, 3) the amount of invested capital is small and/or 4) liquidation preferences are senior to prior rounds of financing. Additionally, an increase in the volatility assumption generally increases the enterprise value calculated in an option pricing model. An increase in the time to exit assumption also generally increases the enterprise value calculated in an option pricing model. Variations in the expected time to exit or expected volatility assumptions have a significant impact on fair value.
Warrants
We use the Black-Scholes-Merton option-pricing model to determine the fair value of warrants held in our portfolio unless there is a publicly traded active market for such warrants or another indication of value such as a sale of the portfolio company. Option pricing models, including the Black-Scholes-Merton model, require the use of subjective input assumptions, including expected volatility, expected life, expected dividend rate, and expected risk-free rate of return. In the Black-Scholes-Merton model, variations in the expected volatility or expected term assumptions have a significant impact on fair value. Because certain securities underlying the warrants in our portfolio are not publicly traded, many of the required input assumptions are more difficult to estimate than they would be if a public market for the underlying securities existed.
An input to the Black-Scholes-Merton option-pricing model is the value per share of the type of stock for which the warrant is exercisable as of the date of valuation. This input is derived according to the methodologies discussed in "Preferred Stock, Preferred Units, LLC Interests, Bridge Notes, Common Stock and Common Units."
Rights to Milestone Payments
Rights to milestone payments are valued using a probability-weighted discounted cash flow model. As part of Amgen Inc.’s acquisition of our former portfolio company, BioVex Group, Inc., we are entitled to potential future milestone payments based upon the achievement of certain regulatory and sales milestones. We are also entitled to future payments from the acquisition of TARA Biosystems, Inc. by Valo Health, LLC. We assign probabilities to the achievements of the various milestones. Milestones identified as independent milestones can be achieved irrespective of the achievement of other contractual milestones. Dependent milestones are those that can only be achieved after another, or series of other, milestones are achieved. The interest rates used in these models are observable inputs from sources such as the published interest rates for corporate bonds of the acquiring or comparable companies.
Changes in Valuation Approaches
During the year ended December 31, 2022, the following changes in valuation approach occurred:
•We changed the valuation approach of our securities of Nanosys, Inc., from the market to the income to reflect financing and business related inputs.
•We changed the valuation approach of our securities of Phylagen, Inc., from the market to the income to reflect financing and business related inputs.
The following chart shows the components of change in the financial assets categorized as Level 3 for the year ended December 31, 2022.
| | | | | | | | | | | | | | | | | | | | | | | | | | | | | | | | | | | | | | | | | | | | | | | |
| | Beginning
Balance
1/1/2022 | | Total
Realized
Gains (Loss)
Included in
Changes in
Net Assets | | Transfers | | Total
Unrealized
(Depreciation) Appreciation
Included in
Changes in
Net Assets | | Investments in
Portfolio
Companies and
Interest on
Bridge Notes | | Disposals
and
Settlements | | Ending
Balance
12/31/2022 | | Amount of Total
(Depreciation) Appreciation for the
Year included in
Changes in Net
Assets Attributable
to the Change in
Unrealized Gains or
Losses Relating to
Assets Still Held at
the Reporting Date |
| | | | | | | | | | | | | | | |
| Preferred Stock/Units | $ | 26,324,664 | | | $ | (5,076,150) | | 1 | $ | (5,731,450) | | 3 | $ | (6,447,457) | | | $ | 0 | | | $ | (2,633,682) | | 4 | $ | 6,435,925 | | | $ | (11,291,908) | |
| | | | | | | | | | | | | | | |
| Bridge/Promissory Notes | 100,000 | | | (407,391) | | 1 | 0 | | | 275,000 | | | 50,000 | | | (17,609) | | | 0 | | | 0 | |
| | | | | | | | | | | | | | | |
| Common Stock/Membership Units | 7,099,715 | | | 549,616 | | 2 | 0 | | | (4,569,046) | | | 205,357 | | | (562,656) | | 4 | 2,722,986 | | | (4,249,640) | |
| | | | | | | | | | | | | | | |
| Warrants | 259,979 | | | (35,403) | | 1 | 0 | | | (8,945) | | | 0 | | | 0 | | | 215,631 | | | (44,348) | |
| | | | | | | | | | | | | | | |
| LLC Interests | 225,000 | | | 6,466 | | 1 | 0 | | | (6,466) | | | 0 | | | (6,466) | | | 218,534 | | | (6,466) | |
| | | | | | | | | | | | | | | |
| Rights to Milestone Payments | 8,012,759 | | | 6,014,178 | | 1 | 0 | | | (1,621,048) | | | 3,012,461 | | 4 | (12,575,536) | | | 2,842,814 | | | (329,146) | |
| | | | | | | | | | | | | | | |
| Total | $ | 42,022,117 | | | $ | 1,051,316 | | | $ | (5,731,450) | | | $ | (12,377,962) | | | $ | 3,267,818 | | | $ | (15,795,949) | | | $ | 12,435,890 | | | $ | (15,921,508) | |
1 Represents gross realized gains or gross realized losses.
2 Represents gross realized gains of $562,636, net of gross realized losses of $13,020.
3 The transfers out of "Preferred Stock" of D-Wave Systems, Inc. was owing to the merger with DPCM Capital, Inc. and issuance of Common Stock of D-Wave Quantum, Inc. which was no longer being fair valued by the Company's Board.
4 The Company received Right to Milestone Payments from Acquisition of TARA Biosystems, Inc. as consideration for its investment in Preferred Stock and Common Stock.
We elected to use beginning of the year values to recognize transfers in and out of Level 3 investments, when transfers occur.
NOTE 5. INDUSTRY DIVERSIFICATION
The following table shows the percentage of our net assets invested by industry as of December 31, 2022. | | | | | | | | | | | | | | | | | | | | | | | |
| Industry | Value as of December 31, 2022 | | % of Net Assets | | Value as of December 31, 2022 | | % of Net Assets |
| Advertising | | | | | $ | 4,534,991 | | | 6.9% |
| Unaffiliated Portfolio Companies | $ | 0 | | | 0.0% | | | | |
| Non-Controlled Affiliated Portfolio Companies | 4,534,991 | | | 6.9% | | | | |
| Controlled Affiliated Portfolio Companies | 0 | | | 0.0% | | | | |
| Apparel, Accessories & Luxury Goods | | | | | 527,550 | | | 0.8% |
| Unaffiliated Portfolio Companies | 527,550 | | | 0.8% | | | | |
| Non-Controlled Affiliated Portfolio Companies | 0 | | | 0.0% | | | | |
| Controlled Affiliated Portfolio Companies | 0 | | | 0.0% | | | | |
| Application Software | | | | | 3,379,203 | | | 5.2% |
| Unaffiliated Portfolio Companies | 0 | | | 0.0% | | | | |
| Non-Controlled Affiliated Portfolio Companies | 3,379,203 | | | 5.2% | | | | |
| Controlled Affiliated Portfolio Companies | 0 | | 0.0% | | | | |
| Asset Management & Custody Banks | | | | | 218,534 | | | 0.3% |
| Unaffiliated Portfolio Companies | 218,534 | | | 0.3% | | | | |
| Non-Controlled Affiliated Portfolio Companies | 0 | | | 0.0% | | | | |
| Controlled Affiliated Portfolio Companies | 0 | | | 0.0% | | | | |
| Biotechnology | | | | | 0 | | | 0.0% |
| Unaffiliated Portfolio Companies | 0 | | | 0.0% | | | | |
| Non-Controlled Affiliated Portfolio Companies | 0 | | | 0.0% | | | | |
| Controlled Affiliated Portfolio Companies | 0 | | | 0.0% | | | | |
| Communications Equipment | | | | | 2,221,050 | | | 3.4% |
| Unaffiliated Portfolio Companies | 2,221,050 | | | 3.4% | | | | |
| Non-Controlled Affiliated Portfolio Companies | 0 | | 0.0% | | | | |
| Controlled Affiliated Portfolio Companies | 0 | | 0.0% | | | | |
| Construction Machinery & Heavy Trucks | | | | | 3,770,213 | | | 5.8% |
| Unaffiliated Portfolio Companies | 3,770,213 | | | 5.8% | | | | |
| Non-Controlled Affiliated Portfolio Companies | 0 | | | 0.0% | | | | |
| Controlled Affiliated Portfolio Companies | 0 | | | 0.0% | | | | |
| Electronic Manufacturing Services | | | | | 1,729,456 | | | 2.6% |
| Unaffiliated Portfolio Companies | 1,729,456 | | | 2.6% | | | | |
| Non-Controlled Affiliated Portfolio Companies | 0 | | | 0.0% | | | | |
| Controlled Affiliated Portfolio Companies | 0 | | | 0.0% | | | | |
| Fertilizers & Agricultural Chemicals | | | | | 5,650,534 | | | 8.6% |
| Unaffiliated Portfolio Companies | 5,650,534 | | | 8.6% | | | | |
| Non-Controlled Affiliated Portfolio Companies | 0 | | | 0.0% | | | | |
| Controlled Affiliated Portfolio Companies | 0 | | | 0.0% | | | | |
| Health Care Equipment | | | | | 158,886 | | | 0.2% |
| Unaffiliated Portfolio Companies | 0 | | | 0.0% | | | | |
| Non-Controlled Affiliated Portfolio Companies | 158,886 | | | 0.2% | | | | |
| Controlled Affiliated Portfolio Companies | 0 | | | 0.0% | | | | |
| Health Care Technology | | | | | 0 | | | 0.0% |
| Unaffiliated Portfolio Companies | 0 | | | 0.0% | | | | |
| Non-Controlled Affiliated Portfolio Companies | 0 | | | 0.0% | | | | |
| Controlled Affiliated Portfolio Companies | 0 | | | 0.0% | | | | |
| | | | | | | |
| | | | | | | | | | | | | | | | | | | | | | | |
| Industry | Value as of December 31, 2022 | | % of Net Assets | | Value as of December 31, 2022 | | % of Net Assets |
| Interactive Media & Services | | | | | $ | 8,147,090 | | | 12.4% |
| Unaffiliated Portfolio Companies | $ | 0 | | | 0.0% | | | | |
| Non-Controlled Affiliated Portfolio Companies | 8,147,090 | | | 12.4% | | | | |
| Controlled Affiliated Portfolio Companies | 0 | | | 0.0% | | | | |
| | | | | | | |
| | | | | | | |
| | | | | | | |
| | | | | | | |
| Pharmaceuticals | | | | | 2,980,804 | | | 4.5% |
| Unaffiliated Portfolio Companies | 2,980,804 | | | 4.5% | | | | |
| Non-Controlled Affiliated Portfolio Companies | 0 | | | 0.0% | | | | |
| Controlled Affiliated Portfolio Companies | 0 | | | 0.0% | | | | |
| Research & Consulting Services | | | | | 0 | | | 0.0% |
| Unaffiliated Portfolio Companies | 0 | | | 0.0% | | | | |
| Non-Controlled Affiliated Portfolio Companies | 0 | | | 0.0% | | | | |
| Controlled Affiliated Portfolio Companies | 0 | | | 0.0% | | | | |
| Restaurants | | | | | 9,059,504 | | | 13.8% |
| Unaffiliated Portfolio Companies | 0 | | | 0.0% | | | | |
| Non-Controlled Affiliated Portfolio Companies | 9,059,504 | | | 13.8% | | | | |
| Controlled Affiliated Portfolio Companies | 0 | | | 0.0% | | | | |
| Specialized Finance | | | | | 2,706,572 | | | 4.1% |
| Unaffiliated Portfolio Companies | 0 | | | 0.0% | | | | |
| Non-Controlled Affiliated Portfolio Companies | 0 | | | 0.0% | | | | |
| Controlled Affiliated Portfolio Companies | 2,706,572 | | | 4.1% | | | | |
| Specialty Chemicals | | | | | $504,929 | | 0.8% |
| Unaffiliated Portfolio Companies | 504,929 | | | 0.8% | | | | |
| Non-Controlled Affiliated Portfolio Companies | 0 | | | 0.0% | | | | |
| Controlled Affiliated Portfolio Companies | 0 | | | 0.0% | | | | |
| | | | | | | |
| | | | | | | |
| | | | | | | |
| | | | | | | |
| Steel | | | | | 2,410,754 | | | 3.7% |
| Unaffiliated Portfolio Companies | 2,410,754 | | | 3.7% | | | | |
| Non-Controlled Affiliated Portfolio Companies | 0 | | | 0.0% | | | | |
| Controlled Affiliated Portfolio Companies | 0 | | | 0.0% | | | | |
| Technology Hardware, Storage & Peripherals | | | | | 11,815,957 | | | 18.0% |
| Unaffiliated Portfolio Companies | 11,815,957 | | | 18.0% | | | | |
| Non-Controlled Affiliated Portfolio Companies | 0 | | | 0.0% | | | | |
| Controlled Affiliated Portfolio Companies | 0 | | | 0.0% | | | | |
| Trading Companies & Distributors | | | | | 5,870,394 | | | 9.0% |
| Unaffiliated Portfolio Companies | 5,870,394 | | | 9.0% | | | | |
| Non-Controlled Affiliated Portfolio Companies | 0 | | | 0.0% | | | | |
| Controlled Affiliated Portfolio Companies | 0 | | | 0.0% | | | | |
| Miscellaneous Common Stocks Industries | | | | | 3,291 | | | 0.0% |
| Unaffiliated Portfolio Companies | 3,291 | | | 0.0% | | | | |
| Non-Controlled Affiliated Portfolio Companies | 0 | | 0.0% | | | | |
| Controlled Affiliated Portfolio Companies | 0 | | 0.0% | | | | |
| Total | $ | 65,689,712 | | | | | $ | 65,689,712 | | | |
NOTE 6. DERIVATIVES
The following table presents the effect of derivatives held during the year ended December 31, 2022, along with the respective location in the consolidated financial statements.
CONSOLIDATED STATEMENT OF ASSETS AND LIABILITIES:
| | | | | | | | | | | | | | | | | | | | | | | | | | | | | |
| | Assets | | Liabilities | |
| Derivatives | | Location | | Fair Value | | Location | | Fair Value | |
| Warrants for the purchase of Common Stock of Potbelly Corporation expiring 2/12/26 | | Investments | | $ | 215,631 | | | -- | | -- | |
| | | | | | | | | |
| Warrants for the purchase of Common Stock of Magnolia Neurosciences Corporation expiring 8/3/28 | | Investments | | 0 | | | -- | | -- | |
| | | | | | | | | |
| Warrants for the purchase of Common Stock of OpGen, Inc. expiring 2/17/25 | | Investments | | 0 | | | -- | | -- | |
| | | | | | | | | |
CONSOLIDATED STATEMENT OF OPERATIONS:
| | | | | | | | | | | | | | | | | | | | | | | |
| Derivatives | | Location | | Net Realized Gain (Loss) | | Net Change in Unrealized Appreciation (Depreciation) | |
| Warrants for the purchase of Common Stock of Potbelly Corporation expiring 2/12/26 | | Net Realized Gain (Loss) and Unrealized Appreciation (Depreciation) on Investments | | $ | 0 | | | $ | 10,318 | | |
| | | | | | | |
| Warrants for the purchase of Common Stock of Magnolia Neurosciences Corporation expiring 8/3/28 | | Net Realized Gain (Loss) and Unrealized Appreciation (Depreciation) on Investments | | 0 | | | (54,666) | | |
| | | | | | | |
| Warrants for the purchase of Series A-3 Preferred Stock of NanoTerra, Inc. expired 11/15/22 | | Net Realized Gain (Loss) and Unrealized Appreciation (Depreciation) on Investments | | (35,403) | | | 35,403 | | |
| | | | | | | |
| Warrants for the purchase of Common Stock of OpGen, Inc. expiring 2/17/25 | | Net Realized Gain (Loss) and Unrealized Appreciation (Depreciation) on Investments | | 0 | | | 0 | | |
| | | | | | | |
| Exchange Traded Fund Options | | Net Realized Gain (Loss) and Unrealized Appreciation (Depreciation) on Investments | | 35,909 | | | 0 | | |
We also purchased call options during the year. A call option gives its holder the right to buy a specific security at a specific price (known as the exercise strike price) by a certain date.
Transactions in call options during the year ended December 31, 2022, were as follows:
| | | | | | | | | | | | | | |
| | Number of Contracts | | Premium |
| Call options outstanding as of December 31, 2021 | | 0 | | $ | 0 | |
| Call options purchased | | 220 | | (174,765) | |
| Purchased call options expired | | (220) | | | 210,674 | |
| Call options as of December 31, 2022 | | 0 | | $ | 35,909 | |
| | | | |
NOTE 7. OFFICERS' AND BOARD OF DIRECTORS' COMPENSATION
The aggregate compensation (salaries, 401(k) employer match, medical and dental benefits) paid by the Company during the year ended December 31, 2022, to its officers amounted to approximately $1.4 million, including $50,000 in bonuses paid in 2022. The Compensation Committee awarded no deferred bonus in 2022 to certain of the Company's officers. As of December 31, 2022, there is no accrual for deferred bonuses for time-elapsed portion as in prior years. Any accruals for deferred bonuses were reversed during the the year.
The aggregate compensation paid by the Company to the independent members of its Board of Directors during the year ended December 31, 2022 was $288,750.
Certain officers and directors currently and may in the future serve as members of the board of directors of our portfolio companies, including our controlled portfolio companies. These officers and directors do not receive any compensation for serving in such roles directly from the portfolio companies. Any such cash compensation paid by portfolio companies to members of their respective boards of directors is paid directly to the Company. In the case of securities-based compensation (restricted stock or stock options), the officer or director due such compensation assigns all beneficial interest, including but not limited to economic benefit and voting control, to such securities over to the Company.
NOTE 8. EMPLOYEE BENEFITS
401(k) Plan
We adopted a 401(k) Plan covering substantially all of our employees. Matching contributions to the plan are at the discretion of the Compensation Committee. For the year ended December 31, 2022, the Compensation Committee approved a 100 percent match, which amounted to $95,000.
Medical Benefit Retirement Plan
We historically administered a plan to provide medical and dental insurance for retirees and their spouses who, at the time of their retirement, attained certain years of service with us and a certain age (the "Medical Benefit Retirement Plan"). On April 27, 2017, the Board of Directors terminated the plan. The termination does not affect benefits accrued by former employees who are grandfathered under the former terms of the plan, and the termination of the plan does not affect benefits accrued by certain former employees who were grandfathered under the amended terms of the plan. The Medical Benefit Retirement Plan was terminated for all other employees.
The plan is unfunded and has no assets. The following disclosures about changes in the benefit obligation under the plan to provide medical and dental insurance for retirees are as of the measurement date of December 31, 2022:
| | | | | | | | | | |
| | 2022 | | |
| Accumulated post-retirement benefit obligation - December 31, 2021 | | $ | 633,715 | | | |
| Interest cost | | 15,097 | | | |
| Actuarial gain | | (101,046) | | | |
| Benefits paid | | (40,203) | | | |
| Accumulated post-retirement benefit obligation - December 31, 2022 | | $ | 507,563 | | | |
| | | | |
In accounting for the plan, the assumption made for the discount rate was 4.90 percent for the year ended December 31, 2022. The discount rate was calculated using the December 31, 2022 FTSE Pension Liability Index. The assumed health care cost trend rates is assumed to be 6.25 percent in 2023 grading down to 5.20 percent uniformly over 2 years and then following the Getzen model thereafter for medical and 5 percent per year for dental.
The following is the net periodic post-retirement benefit cost for the year ended December 31, 2022:
| | | | | | | | | | |
| | 2022 | | |
| Interest cost on accumulated post-retirement benefit obligation | | $ | 15,097 | | | |
| Amortization of net gain | | (9,728) | | | |
| Net periodic post-retirement benefit cost | | $ | 5,369 | | | |
| | | | |
The Company estimates the following benefits to be paid in each of the following years:
| | | | | | | | | | |
| 2023 | | $ | 44,428 | | | |
| 2024 | | 66,306 | | | |
| 2025 | | 59,008 | | | |
| 2026 | | 55,874 | | | |
| 2027 | | 56,183 | | | |
| 2028 through 2032 | | 147,926 | | | |
For the year ended December 31, 2022, net unrecognized actuarial gain of $91,318 resulted primarily from the increase in the discount rate, which represents $101,046 of actuarial gain arising during the year, and from a reclassification adjustment of $9,728 that decreased the net periodic benefit cost for the year.
Executive Mandatory Retirement Benefit Plan
On May 5, 2011, the Board of Directors terminated the Amended and Restated Executive Mandatory Retirement Benefit Plan. Our former President accrued benefits under this plan prior to his retirement, and the termination of this plan has no impact on his accrued benefits. At December 31, 2022 we had $138,074 accrued for benefits for this former employee under the plan, which is included in "Post-retirement plan liabilities" on the Company's Consolidated Statement of Assets and Liabilities.
NOTE 9. INCOME TAXES
The Company filed for the 1999 tax year to elect treatment as a RIC under Subchapter M of the Code and qualified for the same treatment for the years 2000 through 2015, as well as 2017 and 2019. The Company did not qualify as a RIC under Subchapter M of the Code in 2016, 2018, 2020, 2021 and 2022. The Company did not have net taxable income in any of 2016, 2018, 2020, 2021, or 2022, so the failure to qualify as a RIC did not result in a tax liability for the Company. The failure to qualify as a RIC in 2022 was the third year in a row that such qualification was not attained. Under the Code, if the Company fails to qualify as a RIC three years in a row, it would be subject to taxation as a C Corporation on built-in gains should realization of those gains occur within five years of the date of the last annual failure even if the Company qualified as a RIC in a future year. As of December 31, 2022, the Company did not have any built-in gains that would be subject to taxation as a C Corporation should the company qualify as a RIC in a future year. Additionally, should the Company qualify as a RIC in a future year, it would be required to distribute any accumulated and undistributed ordinary income and/or undistributed long-term capital gains. As of December 31, 2022, the Company did not have any undistributed ordinary income and/or undistributed long-term capital gains. As a C Corporation, the Company is permitted to use historical operating loss carryforwards to offset income and gains for tax purposes. As of December 31, 2022, the Company had approximately $80.6 million in operating loss carryforwards that begin to expire in 2026.
Under certain circumstances, even if we qualified for Subchapter M treatment for a given year, we might act in a subsequent year to ensure that we would be taxed in that subsequent year as a C Corporation, rather than as a RIC. We will fail to qualify for RIC tax treatment for a taxable year if we do not satisfy the 90 percent Income Test, the Diversification Tests or Annual Distribution Requirement for such year. In the event we do not satisfy the 90 percent Income Test, Diversification Tests or the Annual Distribution Requirement for any taxable year, we will be subject to federal tax with respect to all our taxable income, whether or not distributed. In addition to the corporate tax that would be paid by the Company, all our distributions to shareholders in that situation generally will be taxable as ordinary dividends and generally subject to up to a 30 percent withholding tax if received by a non-U.S. shareholder, although such dividends may qualify for long-term capital gain treatment as "qualified dividends" for U.S. shareholders meeting certain holding period requirements. If the aggregate values of our non-qualifying assets remain below 50 percent of total assets and no non-qualifying asset represents more than 25 percent of the total assets, we will continue to pass the Diversification Tests. Rather than selling portfolio companies that are performing well in order to pass our RIC diversification tests, we may opt instead not to qualify as a RIC. We will choose to take such action only if we believe that the result of the action will benefit the Company and our shareholders.
The Company's status as a RIC is irrevocable, but qualification is measured both quarterly and annually. Given the Company's status as a RIC and that the ability or inability to use such operating loss carryforwards depends on qualification metrics measured in each taxable year separate from prior years, the Company does not include a deferred tax asset and valuation allowance on its Consolidated Statement of Assets and Liabilities.
For federal tax purposes, the Company’s 2019 through 2021 tax years remain open for examination by the tax authorities under the normal three-year statute of limitations. Generally, for New Jersey state tax purposes, the Company’s 2018 through 2021 tax years remain open for examination by the tax authorities under a four-year statute of limitations. The Company will file its 2022 federal and state taxes in 2023.
For the year ended December 31, 2022, the Company recorded a consolidated expense of $874 in federal, state and local income taxes.
We paid federal, state and local taxes on behalf of Ventures, which was taxed as a C Corporation.
The Company updated certain components of capital accounts on a tax-basis in 2022, to reflect a return of capital statement of position ("ROCSOP") adjustment. This ROCSOP adjustment includes the reclassification of $3,034,549 of accumulated net operating loss and $275,977 of accumulated net realized loss into additional paid in capital. This reclassification results primarily from certain non-deductible expenses and net operating loss. There is no impact to net asset value per share as a result of this ROCSOP adjustment. This adjustment may change in future years if the Company does not qualify as a RIC in a given tax year.
As of December 31, 2022, the Company's net unrealized depreciation of $25,398,622 was comprised of unrealized depreciation of $34,207,332 and unrealized appreciation is $8,808,710. The book cost of investments is $91,088,334. As of December 31, 2022, the Company's net tax unrealized depreciation of $24,438,236 was comprised of tax unrealized depreciation of $33,246,946 and tax unrealized appreciation is $8,808,710. The tax cost of investments is $90,127,948. As of December 31, 2022, the Company was in a loss position and therefore did not have any undistributed ordinary income and/or undistributed long-term capital gains.
As of December 31, 2022, we had post-enactment loss carryforwards under the provisions of the Regulated Investment Company Modernization Act of 2010 (the "Act") in aggregate of $16,010,594, long term. Capital gains for the year ended December 31, 2022, were $2,204,654 and can be offset again capital losses from prior periods. As of December 31, 2022, we had cumulative capital losses, which were offset against losses during years when the Company failed as a RIC, totaling $12,612,030, which may be carried back 3 years or carried forward 5 years. As of December 31, 2022, we had cumulative capital losses, which were derived during years when the Company qualified as a RIC, totaling $3,398,564. Post-enactment losses have no expiration date in years where we qualify as a RIC.
On December 22, 2017, the Tax Cuts and Jobs Act of 2017 (the "2017 Act") was enacted, which among other changes, lowered the tax rates for corporations and how future loss carryforwards can be used against future gains. The change of the federal corporate tax rate from 35 percent to 21 percent in the 2017 Act may impact future decisions regarding the issuance of deemed dividends should the Company failed to qualify as a RIC under Subchapter M of the Code and be in a net taxable gain position on investments.
NOTE 10. COMMITMENTS AND CONTINGENCIES
Portfolio companies may seek additional capital in the future and any decision by the Company to not participate in the round of financing could result in outcomes that negatively impact the value of the Company's securities of those portfolio companies.
While the Company does not have any specific contractual commitment to provide additional capital to Parabellum Acquisition Partners, LLC ("Parabellum LLC"), it expects to need to do so to fund additional working capital and/or extensions of the period for which its special purpose acquisition company (SPAC), Parabellum Acquisition Corp. ("PRBM"), can complete a merger transaction with EnOcean GmbH ("EnOcean") as was announced on November 14, 2022. The Business Combination Agreement between PRBM and EnOcean permits PRBM to incur up to an additional $1.1 million in funding from its sponsor Parabellum LLC. Should all of this capital be called from investors in Parabellum LLC, the Company would be required to invest approximately $452,000 in Parabellum LLC. If the Company does not invest such capital if called to do so, then its units of Parabellum LLC could be forfeited.
On November 17, 2021, the Company signed a lease extension through December 31, 2024. Upon an event of default, the lease provides that the landlord may terminate the lease and require us to pay all rent that would have been payable during the remainder of the lease or until the date the landlord re-enters the premises.
NOTE 11. PORTFOLIO PURCHASES AND SALES
During the year ended December 31, 2022:
| | | | | | | | | | | | | | |
| Company | | Purchases/Cost | | Sales Proceeds/Distributions |
| Alta Equipment Group, Inc. | | $ | 1,208,398 | | | $ | 1,338,444 | |
Arena Group Holdings, Inc. (1) | | 1,142,551 | | | 340,619 | |
| Armstrong Flooring, Inc. | | 19,992 | | | 1,558,865 | |
| Ascent Industries Co. | | 1,101,416 | | | 0 | |
| Commercial Vehicle Group, Inc. | | 3,366,421 | | | 0 | |
| Comscore, Inc. | | 4,305,337 | | | 102,557 | |
| Intevac, Inc. | | 5,484,766 | | | 0 | |
| Jerash Holdings US, Inc. | | 220,881 | | | 159,649 | |
| Lantronix, Inc. | | 1,347,618 | | | 486,897 | |
| LS180 Acquisition Holdings LLC | | 50,000 | | | 19,510 | |
| Potbelly Corporation | | 368,425 | | | 479 | |
| Parabellum Acquisition Holdings LLC | | 205,357 | | | 0 | |
| PFSweb Inc. | | 0 | | | 1,815,923 | |
| Quantum Corporation | | 3,466,696 | | | 0 | |
| RF Industries, Ltd. | | 824,682 | | | 0 | |
| Synalloy Corp | | 12,117 | | | 3,345,028 | |
| Synchronoss Technologies, Inc. | | 2,198,157 | | | 831,675 | |
Miscellaneous Common Stocks(2) | | 2,424,683 | | | 4,467,552 | |
| Total Publicly Traded Equity and Equity-Related Securities Purchase/Cost and Sales Proceeds/Distributions | | $ | 27,747,497 | | | $ | 14,467,198 | |
| | | | |
| AutoTech Ventures Management I, LLC | | $ | 0 | | | $ | 6,466 | |
| Magnolia Neurosciences Corporation | | 0 | | | 114,336 | |
TARA Biosystems, Inc.(3) | | 0 | | | 3,080,102 | |
| Rights to Milestone Payments from Acquisition of Petra Pharma Corporation | | 0 | | | 12,334,616 | |
Rights to Milestone Payments from Acquisition of TARA Biosystems, Inc.(3) | | 3,012,461 | | | 240,921 | |
| Total Legacy Privately Held Equity and Equity-Related Securities Cost and Distributions | | $ | 3,012,461 | | | $ | 15,776,441 | |
| Total Purchases/Cost and Sales Proceeds/Distributions | | $ | 30,759,958 | | | $ | 30,243,639 | |
Note: The table above does not include transactions in short-term call options whose maturities at the time of acquisition were one year or less during the year ended December 31, 2022.
(1) During the year ended December 31, 2022, the Company received common stock of Arena Group Holdings, Inc. in lieu of cash valued at $897,724.
(2) Miscellaneous Common Stocks are unrestricted common stocks of publicly traded companies that the Company has not disclosed publicly.
(3) During the year ended December 31, 2022, the Company received distributions of cash of $67,641 and rights to milestone payments from the acquisition of TARA Biosystems, Inc., valued at $3,012,461.
NOTE 12. SHARE REPURCHASE PROGRAM
On August 5, 2022, our Board reauthorized the repurchase of up to $2.5 million of the Company's common stock within a six-month period from the date of notice to investors, which notice was mailed on or about February 28, 2022. As of December 31, 2022, no repurchase had occurred.
On February 24, 2023, our Board reauthorized the repurchase of up to $2.5 million of the Company's common stock within a six-month period from the date of notice to investors, which notice will be mailed on or about February 28, 2023.
NOTE 13. SUBSEQUENT EVENTS
The Company has evaluated subsequent events as of December 31, 2022, through the date these financial statements were issued, and include the following:
On February 25, 2022, the Company had entered into a Broker-Dealer Purchase Agreement (the “Agreement”), with an unrelated prospective buyer, whereby the Company had agreed to sell all of its equity in 180BD pursuant to the terms of the Agreement and regulatory approval, for 180BD's continuation of membership with FINRA. On February 8, 2023, the unrelated prospective buyer received regulatory approval and the transaction closed on February 22, 2023.
NOTE 14. INVESTMENTS AND ADVANCES TO AFFILIATES - SCHEDULE 12-14
| | | | | | | | | | | | | | | | | | | | | | | | | | | | | | | | | | | | | | | | | | | | | | | | | | |
| Name of Issuer | | Title of Issue or Nature of Indebtedness (A) | | Amount of Dividends or Interest Credited to Income (B) | | Net Realized Gain (Loss) | | Value as of December 31, 2021 | | Gross Additions (C) | | Gross Reductions (D) | | Net Change in Unrealized Appreciation (Depreciation) | | Value as of December 31, 2022 |
| CONTROLLED AFFILIATED EQUITY & EQUITY-RELATED SECURITIES(E): | | | | | | | | | | | | | | | | |
| LS180 Acquisition Holdings, LLC | | Membership Units | | $ | 0 | | | $ | (13,000) | | | $ | 13,000 | | | $ | 0 | | | $ | (13,000) | | | $ | 0 | | | $ | 0 | |
| | Promissory Note | | 0 | | | (130,490) | | | 100,000 | | | 0 | | | (100,000) | | | 0 | | | 0 | |
| Parabellum Acquisition Partners, LLC | | Membership Units | | $ | 0 | | | $ | 0 | | | $ | 6,719,700 | | | $ | 0 | | | $ | (4,013,128) | | | $ | (4,218,485) | | | $ | 2,706,572 | |
| Total Controlled Affiliated Equity & Equity-Related Securities | | | | $ | 0 | | | $ | (143,490) | | | $ | 6,832,700 | | | $ | 0 | | | $ | (4,126,128) | | | $ | (4,218,485) | | | $ | 2,706,572 | |
| NON-CONTROLLED AFFILIATED LEGACY PRIVATELY HELD EQUITY & EQUITY-RELATED SECURITIES(F): | | | | | | | | | | | | | | | | |
| EchoPixel, Inc. | | Series Seed Convertible Preferred Stock | | $ | 0 | | | $ | 0 | | | $ | 520,097 | | | $ | 0 | | | $ | (441,104) | | | $ | (441,104) | | | $ | 78,993 | |
| | Series Seed-2 Convertible Preferred Stock | | 0 | | | 0 | | | 186,084 | | | 0 | | | (157,531) | | | (157,531) | | | 28,553 | |
| | Series A-2 Convertible Preferred Stock | | 0 | | | 0 | | | 238,390 | | | 0 | | | (187,050) | | | (187,050) | | | 51,340 | |
| Essential Health Solutions, Inc. | | Series A Convertible Preferred Stock | | $ | 0 | | | $ | (2,750,000) | | | $ | 0 | | | $ | 0 | | | $ | 0 | | | $ | 2,750,000 | | | $ | 0 | |
| | Common Stock | | 0 | | | (20) | | | 0 | | | 0 | | | 0 | | | 20 | | | 0 | |
| | Convertible Bridge Note | | 0 | | | (50,000) | | | 0 | | | 0 | | | 0 | | | 50,000 | | | 0 | |
| HALE.life Corporation | | Common Stock | | $ | 0 | | | $ | 0 | | | $ | 31,155 | | | $ | 0 | | | $ | (31,155) | | | $ | (31,155) | | | $ | 0 | |
| | Series Seed-1 Convertible Preferred Stock | | 0 | | | 0 | | | 561,053 | | | 0 | | | (561,053) | | | (561,053) | | | 0 | |
| | Series Seed-2 Convertible Preferred Stock | | 0 | | | 0 | | | 668,023 | | | 0 | | | (668,023) | | | (668,023) | | | 0 | |
| TARA Biosystems, Inc. | | Common Stock | | $ | 0 | | | $ | (20) | | | $ | 319,446 | | | $ | 0 | | | $ | (319,446) | | | $ | (319,426) | | | $ | 0 | |
| | Series A Convertible Preferred Stock | | 0 | | | 418,181 | | | 2,670,081 | | | 0 | | | (2,670,081) | | | (124,588) | | | 0 | |
| | Series A-2 Convertible Preferred Stock | | 0 | | | 16,427 | | | 80,964 | | | 0 | | | (80,964) | | | 19,037 | | | 0 | |
| Total Non-Controlled Affiliated Legacy Privately Held Equity & Equity-Related Securities | | | | $ | 0 | | | $ | (2,365,432) | | | $ | 5,275,293 | | | $ | 0 | | | $ | (5,116,407) | | | $ | 329,127 | | | $ | 158,886 | |
| | | | | | | | | | | | | | | | |
| | | | | | | | | | | | | | | | | | | | | | | | | | | | | | | | | | | | | | | | | | | | | | | | | | |
| Name of Issuer | | Title of Issue or Nature of Indebtedness (A) | | Amount of Dividends or Interest Credited to Income (B) | | Net Realized Gain (Loss) | | Value as of December 31, 2021 | | Gross Additions (C) | | Gross Reductions (D) | | Net Change in Unrealized Appreciation (Depreciation) | | Value as of December 31, 2022 |
| NON-CONTROLLED AFFILIATED PUBLICLY TRADED EQUITY & EQUITY-RELATED SECURITIES(F): | | | | | | | | | | | | | | | | |
| Arena Group Holdings, Inc. | | Common Stock | | $ | 0 | | | $ | 34,142 | | | $ | 9,993,959 | | | $ | 0 | | | $ | (1,846,869) | | | $ | (2,682,943) | | | $ | 8,147,090 | |
| Comscore, Inc. | | Common Stock | | $ | 0 | | | $ | (42,414) | | | $ | 5,217,601 | | | $ | 0 | | | $ | (682,610) | | | $ | (4,842,976) | | | $ | 4,534,991 | |
| Potbelly Corporation | | Common Stock | | $ | 0 | | | $ | 63 | | | $ | 8,454,610 | | | $ | 389,263 | | | $ | 0 | | | $ | 21,254 | | | $ | 8,843,873 | |
| | Warrants for Common Stock | | 0 | | | 0 | | | 205,313 | | | 10,318 | | | 0 | | | 10,318 | | | 215,631 | |
| Synchronoss Technologies, Inc. | | Common Stock | | $ | 0 | | | $ | (686,048) | | | $ | 9,961,490 | | | $ | 0 | | | $ | (6,582,287) | | | $ | (7,262,721) | | | $ | 3,379,203 | |
| Total Non-Controlled Affiliated Publicly Traded Equity & Equity-Related Securities | | | | $ | 0 | | | $ | (694,257) | | | $ | 33,832,973 | | | $ | 399,581 | | | $ | (9,111,766) | | | $ | (14,757,068) | | | $ | 25,120,788 | |
| Total Controlled and Non-Controlled Affiliated Equity & Equity-Related Securities | | | | $ | 0 | | | $ | (3,203,179) | | | $ | 45,940,966 | | | $ | 399,581 | | | $ | (18,354,301) | | | $ | (18,646,426) | | | $ | 27,986,246 | |
(A)Common stock, warrants, membership units and, in some cases, preferred stock are generally non-income producing and restricted. The principal amount of debt and the number of shares of common and preferred stock and number of membership units are shown in the accompanying Consolidated Schedule of Investments as of December 31, 2022.
(B)Represents the total amount of interest or dividends credited/(debited) to income for the portion of the period an investment was a control or affiliate investment, as appropriate. Amounts credited to preferred or common stock represent accrued bridge note interest related to conversions that occurred during the year ended December 31, 2022.
(C)Gross additions include increases in investments resulting from new portfolio investments, paid-in-kind interest or dividends, the amortization of discounts and fees. Gross additions also include net increases in unrealized appreciation or decreases in unrealized depreciation.
(D)Gross reductions include decreases in investments resulting from principal collections related to investment repayments or sales, the amortization of premiums and acquisition costs. Gross reductions also include net increases in unrealized depreciation or decreases in unrealized appreciation.
(E)"Controlled Affiliated" is defined as investments in which we own 25 percent or more of the outstanding voting rights of the portfolio company or otherwise control the company, including control of a majority of the seats on the board of directors, or more than 25 percent of the seats on the board of directors, with no other entity or person in control of more director seats than us.
(F)"Non-Controlled Affiliated" is defined as ownership of five percent or more, but less than 25 percent, of the voting shares of the portfolio company, or where we hold the right to appoint one or more members to the portfolio company’s board of directors, but less than 25 percent of the members of the board of directors.
| | | | | | | | | | | | | | | | | | | | | | | | | | | | | |
| Line for Schedule of Investments | Method / Level | | Primary Industry | | # of Shares Purchased/Principal | | Cost of TURN's Investment | | Valuation |
| Controlled Affiliated Equity and Equity-Related Securities | | | | | | | | | |
| Parabellum Acquisition Partners, LLC | | | Specialized Finance | | | | | | |
| Membership Units (acquired 4/22/21) | (M) (L3) | | | | 693,151 | | $ | 2,923,003 | | | $ | 2,706,572 | |
| Total Controlled Affiliated Equity and Equity-Related Securities (4.1%) | | | | | | | $ | 2,923,003 | | | $ | 2,706,572 | |
| | | | | | | | | |
| Non-Controlled Affiliated Publicly Traded Equity and Equity-Related Securities | | | | | | | | | |
| Arena Group Holdings, Inc. | | | Interactive Media & Services | | | | | | |
| Common Stock | (M) (L1) | | | | 767,869 | | | $ | 8,836,074 | | | $ | 8,147,090 | |
| Comscore, Inc. | | | Advertising | | | | | | |
| Common Stock | (M) (L1) | | | | 3,909,475 | | | $ | 9,577,898 | | | $ | 4,534,991 | |
| Potbelly Corporation | | | Restaurants | | | | | | |
| Common Stock | (M) (L1) | | | | 1,587,769 | | | $ | 7,070,549 | | | $ | 8,843,873 | |
| Synchronoss Technologies, Inc. | | | Application Software | | | | | | |
| Common Stock | (M) (L1) | | | | 5,467,081 | | | $ | 11,528,359 | | | $ | 3,379,203 | |
| Total Non-Controlled Affiliated Publicly Traded Equity and Equity-Related Securities (38.0%) | | | | | | | $ | 37,012,880 | | | $ | 24,905,157 | |
| | | | | | | | | |
| Non-Controlled Affiliated Legacy Privately Held Equity and Equity-Related Securities | | | | | | | | | |
| EchoPixel, Inc. | | | Health Care Equipment | | | | | | |
| Series Seed Convertible Preferred Stock (acquired 6/21/13-6/30/14) | (I) (L3) | | | | 4,194,630 | | | $ | 1,250,000 | | | $ | 78,993 | |
| Series Seed-2 Convertible Preferred Stock (acquired 1/22/16) | (I) (L3) | | | | 1,476,668 | | | 500,000 | | | 28,553 | |
| Series A-2 Convertible Preferred Stock (acquired 3/23/17) | (I) (L3) | | | | 1,471,577 | | | 350,000 | | | 51,340 | |
| | | | | | | $ | 2,100,000 | | | $ | 158,886 | |
| HALE.life Corporation | | | Health Care Technology | | | | | | |
| Common Stock (acquired 3/1/16) | (I) (L3) | | | | 1,000,000 | | | $ | 10 | | | $ | 0 | |
| Series Seed-1 Convertible Preferred Stock (acquired 3/28/17) | (I) (L3) | | | | 11,000,000 | | | 1,896,920 | | | 0 | |
| Series Seed-2 Convertible Preferred Stock (acquired 12/28/18) | (I) (L3) | | | | 12,083,132 | | 2,500,000 | | 0 |
| | | | | | | $ | 4,396,930 | | | $ | 0 | |
| Total Non-Controlled Affiliated Legacy Privately Held Equity and Equity-Related Securities (0.2%) | | | | | | | $ | 6,496,930 | | | $ | 158,886 | |
| | | | | | | | | |
| | | | | | | | | | | | | | | | | | | | | | | | | | | | | |
| Line for Schedule of Investments | Method / Level | | Primary Industry | | # of Shares Purchased/Principal | | Cost of TURN's Investment | | Valuation |
| Non-Controlled Affiliated Derivative Securities | | | | | | | | | |
| Potbelly Corporation | | | Restaurants | | | | | | |
| Warrants for the Purchase of Common Stock expiring 2/12/26 | (I) (L3) | | | | 80,605 | | | $ | 224,849 | | | $ | 215,631 | |
| Total Non-Controlled Affiliated Derivative Securities (0.3%) | | | | | | | $ | 224,849 | | | $ | 215,631 | |
| Total Non-Controlled Affiliated Securities (38.5%) | | | | | | | $ | 43,734,659 | | | $ | 25,279,674 | |
| | | | | | | | | |
| Total Controlled Affiliated and Non-Controlled Affiliated Equity and Equity-Related Securities (42.7%) | | | | | | | $ | 46,657,662 | | | $ | 27,986,246 | |
Report of Independent Registered Public Accounting Firm
To the Board of Directors and Shareholders of 180 Degree Capital Corp.
Opinion on the Financial Statements
We have audited the accompanying consolidated statement of assets and liabilities, including the consolidated schedule of investments, of 180 Degree Capital Corp. and its subsidiaries (the “Company”) as of December 31, 2022, the related consolidated statements of operations and cash flows for the year ended December 31, 2022, the consolidated statements of changes in net assets for each of the two years in the period ended December 31, 2022, including the related notes, and the consolidated financial highlights for each of the five years in the period ended December 31, 2022 (collectively referred to as the “consolidated financial statements”). In our opinion, the consolidated financial statements present fairly, in all material respects, the financial position of the Company as of December 31, 2022, the results of its operations and its cash flows for the year then ended, the changes in its net assets for each of the two years in the period ended December 31, 2022 and the financial highlights for each of the five years in the period ended December 31, 2022 in conformity with accounting principles generally accepted in the United States of America.
Basis for Opinion
These consolidated financial statements are the responsibility of the Company’s management. Our responsibility is to express an opinion on the Company’s consolidated financial statements based on our audits. We are a public accounting firm registered with the Public Company Accounting Oversight Board (United States) (PCAOB) and are required to be independent with respect to the Company in accordance with the U.S. federal securities laws and the applicable rules and regulations of the Securities and Exchange Commission and the PCAOB.
We conducted our audits of these consolidated financial statements in accordance with the standards of the PCAOB. Those standards require that we plan and perform the audit to obtain reasonable assurance about whether the consolidated financial statements are free of material misstatement, whether due to error or fraud.
Our audits included performing procedures to assess the risks of material misstatement of the consolidated financial statements, whether due to error or fraud, and performing procedures that respond to those risks. Such procedures included examining, on a test basis, evidence regarding the amounts and disclosures in the consolidated financial statements. Our audits also included evaluating the accounting principles used and significant estimates made by management, as well as evaluating the overall presentation of the consolidated financial statements. Our procedures included confirmation of securities owned as of December 31, 2022 by correspondence with the custodian, transfer agent and issuers of privately offered securities. We believe that our audits provide a reasonable basis for our opinion.
/s/PricewaterhouseCoopers LLP
New York, New York
February 27, 2023
We have served as the Company's auditor since 2002.
Privacy Policy
We are committed to protecting your privacy. This privacy notice explains the privacy policies of 180 Degree Capital Corp. and its affiliates. This notice supersedes any other privacy notice you may have received from 180 Degree Capital Corp.
Generally, we do not receive any non-public personal information relating to our shareholders, although certain non-public personal information of our shareholders may become available to us. We maintain physical, electronic, and procedural safeguards, according to strict standards of security and confidentiality, all information we receive about you. The only information we collect from you is your name, address, and number of shares you hold. This information is used only so that we can send you annual reports and other information about us, and send you proxy statements or other information required by law. When the Company shares non-public shareholder personal information referred to above, the information is made available for limited business purposes and under controlled circumstances designed to protect our shareholders' privacy. We do not permit use of shareholder information for any non-business or marketing purpose, nor do we permit third parties to rent, sell, trade or otherwise release or disclose information to any other party.
We do not share this information with any non-affiliated third party except as described below.
•180 Degree Capital Corp. and affiliate employees. It is our policy that only our authorized employees who need to know your personal information will have access to it. Our personnel who violate our privacy policy are subject to disciplinary action.
•Service Providers. We may disclose your personal information to companies that provide services on our behalf, such as record keeping and mailing you information. These companies are required to protect your information and use it solely for the purpose for which they received it.
•Courts and Government Officials. If required by law, we may disclose your personal information in accordance with a court order or at the request of government regulators. Only that information required by law, subpoena, or court order will be disclosed.
Proxy Voting
We vote proxies relating to our portfolio securities in the best interest of our shareholders. We review on a case-by-case basis each proposal submitted to a shareholder vote to determine its impact on the portfolio securities held by us. Although we generally vote against proposals that may have a negative impact on our portfolio securities, we may vote for such a proposal if there exists compelling long-term reasons to do so.
Our proxy voting decisions are made by our Portfolio Managers, who are responsible for monitoring each of our investments. To ensure that our vote is not the product of a conflict of interest, we require that: (i) anyone involved in the decision making process disclose to our Chief Compliance Officer any potential conflict that he or she is aware of and any contact that he or she has had with any interested party regarding a proxy vote; and (ii) employees involved in the decision making process or vote administration are prohibited from revealing how we intend to vote on a proposal in order to reduce any attempted influence from interested parties.
Information regarding how the Company voted proxies relating to portfolio securities during the most recent 12-month period ended June 30 is available, without charge, upon request, by calling the Company toll-free at 833-293-1769 and on the SEC's website at http://www.sec.gov.
Portfolio Holdings
The Company files its complete schedule of portfolio holdings with the SEC for the first and third quarters of each fiscal year on Form N-PORT. The Company's Forms N-PORT are available on the SEC's website at http://www.sec.gov and may be reviewed and copied at the SEC's Public Reference Room in Washington D.C. Information on the operation of the Public Reference Room may be obtained by calling 1-800-SEC-0330.
180 Degree Capital Corp.*
Board of Directors
| | | | | | | | |
Stacy R. Brandom1,2,3,4 | Tonia L. Pankopf1,2,4 | Kevin M. Rendino6 |
Richard P. Shanley1,2,3,4,5 | Parker A. Weil1,2,3,4 | Daniel B. Wolfe |
1. Member of Audit Committee 2. Member of Valuation Committee 3. Member of Compensation Committee
4. Member of Nominating Committee 5. Lead Independent Director 6. Chairman of the Board
* The Statement of Additional Information includes additional information about the Directors and is available, without charge, upon request, by calling 973-746-4500 or email ir@180degreecapital.com.
Officers
| | | | | |
| Kevin M. Rendino | Chairman, Chief Executive Officer and Portfolio Manager |
| Daniel B. Wolfe | President, Chief Financial Officer, Chief Compliance Officer and Portfolio Manager |
| Alicia M. Gift | Senior Controller, Secretary and Treasurer |
| Robert E. Bigelow III | Vice President, Head of Fund Development |
7 N. Willow Street, Suite 4B
Montclair, New Jersey 07042
Phone: 973-746-4500 Fax: 973-746-4508
Website: www.180degreecapital.com Email: ir@180degreecapital.com
Counsel: Schulte Roth & Zabel LLP
Independent Registered Public Accounting Firm: PricewaterhouseCoopers LLP
Custodian of Securities: US Bank, N.A.
Transfer Agent & Registrar: American Stock Transfer & Trust Company, LLC
Stockholder Relations Department
6201 15th Avenue
Brooklyn, New York 11219
877-260-8188
Website: www.astfinancial.com Email: info@astfinancial.com
HOUSEHOLDING OPT-OUT NOTICE
To reduce expenses, we may only mail one copy of the 180 Degree Capital Corp.'s shareholder updates, such as prospectus, annual report, semi-annual report, to those addresses shared by two or more accounts. If you are not a direct shareholder (i.e., you hold your shares of us in a brokerage account), please contact your financial institution to opt out of householding. If you are a direct shareholder (i.e., you hold your shares of us at our transfer agent) and wish to receive individual copies of these documents, please call us toll-free at 833-293-1769. We will begin sending you individual copies thirty days after receiving your request.
Item 2. Code of Ethics.
The Board has adopted a code of ethics applicable to our senior executive officers that is designed to promote honest and ethical conduct, including the ethical handling of actual or apparent conflicts of interest between personal and professional relationships (the "Code of Conduct"). Our Code of Conduct is available on the Company's website at https://ir.180degreecapital.com/governance-docs. The Company made amendments to the Code of Conduct to include reference to and items required under the Advisers Act. The Company did not grant any waivers from any provisions of the Code of Conduct during the reporting period.
Item 3. Audit Committee Financial Expert.
The Board has determined that all of the members of the Company's Audit Committee of the Board, Stacy R. Brandom, Tonia L. Pankopf, Richard P. Shanley and Parker A. Weil, meet the definition of "audit committee financial expert" as that term is defined by the SEC and are "independent" pursuant to paragraph (a)(2) of this Item.
Item 4. Principal Accountant Fees and Services.
The information set forth under the captions "Audit Committee's Pre-Approval Policies" and "Fees Paid to PwC for 2022 and 2021" in the Proxy Statement for the 2023 Annual Meeting of Shareholders, to be filed pursuant to Regulation 14A under the Exchange Act (the "2023 Proxy Statement") is herein incorporated by reference.
Item 5. Audit Committee List of Registrants.
The information set forth under the caption "Audit Committee" in our 2023 Proxy Statement is herein incorporated by reference.
Item 6. Investments.
(a) The schedule of investments in securities of unaffiliated issuers is included as part of the report to stockholders filed under Item 1 of this form.
(b) Not applicable.
Item 7. Disclosure of Proxy Voting Policies and Procedures for Closed-End Management Investment Companies.
We vote proxies relating to our portfolio securities in the best interest of our shareholders. We review on a case-by-case basis each proposal submitted to a shareholder vote to determine its impact on the portfolio securities held by us. Although we generally vote against proposals that may have a negative impact on our portfolio securities, we may vote for such a proposal if there exists compelling long-term reasons to do so.
Our proxy voting decisions are made by our Portfolio Managers, who are responsible for monitoring each of our investments. To ensure that our vote is not the product of a conflict of interest, we require that: (i) anyone involved in the decision making process disclose to our Chief Compliance Officer any potential conflict that he or she is aware of and any contact that he or she has had with any interested party regarding a proxy vote; and (ii) employees involved in the decision making process or vote administration are prohibited from revealing how we intend to vote on a proposal in order to reduce any attempted influence from interested parties.
Item 8. Portfolio Managers of Closed-End Management Investment Companies.
(a)(1) As of December 31, 2022, Kevin M. Rendino and Daniel B. Wolfe are primarily responsible for the day-to-day management of the Company's portfolio as Portfolio Managers.
Mr. Rendino has served as Chairman and Chief Executive Officer of the Company since March 2017 and as a member of the Board since June 2016. From 2012 to 2016, Mr. Rendino served as Chairman and Chief Executive Officer of RGJ Capital, where he led a Graham and Dodd approach to value investing. His team focused on a blend of long-only ideas and pair trades when a statistical anomaly and inconsistency between two variables are identified. From November 2017 to August 2019, Mr. Rendino served as a director of TheStreet, Inc., a publicly traded company in which we had an investment. From March 2019 to April 2021, Mr. Rendino served as a director of Synacor, Inc., a publicly traded company in which we had an investment.
Mr. Wolfe has served as President since January 2009, as Chief Financial Officer and Chief Compliance Officer since July 2016, and as Portfolio Manager and a member of the Company's Board since March 2017. He served as Chief Operating Officer and a Managing Director from January 2008 to June 30, 2016. He served as Chief Financial Officer from January 2008 to December 31, 2012, as Treasurer from May 2008 to December 31, 2012, and from July 2016 to April 2017. He has served as a member of the board of directors of privately held and publicly traded companies in which we have had investments. From September 2021 to present, he serves as a director of Parabellum Acquisition Corp., a publicly traded special purpose acquisition company whose sponsor, Parabellum Acquisition Holdings, LLC, is a company in which we have an investment.
(a)(2) Not applicable.
(a)(3) The principal elements of our executive compensation program for 2022 are base salary, bonus, other benefits and perquisites, and severance benefits. The Compensation Committee of the Board believes that each element is essential to achieve the Company’s objectives as set forth above.
Base Salaries. We recognize the need to pay our named executive officers, and other employees, a competitive annual base salary. We review base salaries for our named executive officers annually, often employing data provided from independent compensation consultants. Base salaries have historically been adjusted annually for inflation and also based on changes in the marketplace and an executive’s individual performance, salary position among peers, career growth potential and/or a change in responsibilities.
Cash Bonuses. The Company provides annual bonuses at the discretion of the Committee derived from a number of quantitative and qualitative inputs including, but not limited to:
•Performance against individual and corporate targets and goals;
•Performance as compared to indices and other observable entities that track or invest in microcapitalization publicly traded companies;
•Full year actual versus estimated expenses and expenses as a percentage of assets;
•Changes in the price per share of the Company’s stock, including dividends, if any;
•Changes in the net asset value of the Company, including dividends, if any; and
•The importance of retaining employees.
The weighting of these inputs in the Committee’s determinations of bonuses are adjusted based on a retrospective full analysis of individual and corporate achievements and challenges during the year under consideration.
Severance Benefits. To further incentivize and retain Messrs. Rendino and Wolfe, we entered into an Executive Severance Agreement with each executive.
Each of Messrs. Rendino and Wolfe's Executive Severance Agreement provides that the executive will receive the following severance benefits in the event that an executive’s employment is terminated by us other than for “cause” or an executive resigns for “good reason.”
•Twelve months of base salary to be paid in cash periodically in accordance with the Company’s normal payroll policies;
•a portion of executive’s incentive compensation in cash for the fiscal year in which executive's employment terminates, pro-rated based on time employed during the fiscal year, only to be paid to the extent that performance metrics in the plan are achieved and at the same time as payments to other executives in the applicable incentive compensation plan are paid; and
•Twelve months of COBRA premiums.
Further, under the terms of each Executive Severance Agreement for Messrs. Rendino and Wolfe, in the event an executive’s employment is terminated other than for “cause” or an executive resigns for “good reason” within the period commencing three months prior to a change in control and ending 12 months after a change in control, the severance will consist of:
•Twelve months of base salary to be paid in a single cash lump-sum;
•a portion of an executive’s incentive compensation in cash for the fiscal year in which executive's employment terminates, pro-rated based on time employed during the fiscal year;
•Twelve months of COBRA premiums.
For purposes of the Executive Severance Agreements, "cause" generally means:
•an act of dishonesty made in connection with the executive’s responsibilities as an employee;
•conviction of, or plea of nolo contendere to, a felony or any crime involving fraud or embezzlement;
•gross misconduct;
•unauthorized use or disclosure of any proprietary information or trade secrets;
•willful breach of any obligations under any written agreement or covenant with the Company;
•failure to cooperate in good faith with a governmental or internal investigation; or
•continued failure to perform duties after receiving a written demand of performance.
For purposes of the Executive Severance Agreements, "good reason" generally means a voluntary termination following the occurrence of one or more of the following, without the executive’s consent that is not cured within 30 days of notice to the Company:
•a material reduction of responsibilities;
•a material reduction in base salary; or;
•a material change (at least 50 miles) in the geographic location of Executive’s primary work facility or location.
(a)(4) As of December 31, 2020, Mr. Rendino and Mr. Wolfe beneficially owned equity securities of the Company valued over $1,000,000 and between $500,001 and $1,000,000, respectively.
Item 9. Purchases of Equity Securities by Closed-End Management Investment Company and Affiliated Purchasers.
| | | | | | | | | | | | | | |
| Year 2022 | (a) Total Number of Shares Purchased | (b) Average Price Paid Per Share | (c) Total Number of Shares Purchased as Part of Publicly Announced Plans or Programs | (d) Approximate Dollar Value of Shares that May Yet Be Purchased Under the Plans or Programs |
| 01/01 - 01/31 | 0 | | 0 | | 0 | | $ | 2,500,000 | |
| 02/01 - 02/28 | 0 | | 0 | | 0 | | 2,500,000 | |
| 03/01 - 03/31 | 0 | | 0 | | 0 | | 2,500,000 | |
| 04/01 - 04/30 | 0 | | 0 | | 0 | | 2,500,000 | |
| 05/01 - 05/31 | 0 | | 0 | | 0 | | 2,500,000 | |
| 06/01 - 06/30 | 0 | | 0 | | 0 | | 2,500,000 | |
| 07/01 - 07/31 | 0 | | 0 | | 0 | | 2,500,000 | |
| 08/01 - 08/31 | 0 | | 0 | | 0 | | 2,500,000 | |
| 09/01 - 09/30 | 0 | | 0 | | 0 | | 2,500,000 | |
| 10/01 - 10/31 | 0 | | 0 | | 0 | | 2,500,000 | |
| 11/01 - 11/30 | 0 | | 0 | | 0 | | 2,500,000 | |
| 12/01 - 12/31 | 0 | | 0 | | 0 | | 2,500,000 | |
| Total for Year | 0 | | | 0 | | |
On August 5, 2022, our Board reauthorized the repurchase of up to $2.5 million of the Company's common stock within a six-month period from the date of notice to investors, which notice will be mailed on or about August 12, 2022. As of December 31, 2022, no repurchase had occurred.
On February 24, 2023, our Board reauthorized the repurchase of up to $2.5 million of the Company's common stock within a six-month period from the date of notice to investors, which notice will be mailed on or about March 1, 2023.
Item 10. Submission of Matters to a Vote of Shareholders.
There have been no material changes to the procedures by which shareholders may recommend nominees to the registrant's Board of Directors as set forth in the registrant's Proxy Statement, dated March 2, 2022.
Item 11. Controls and Procedures.
(a) Based on an evaluation of the Registrant's Disclosure Controls and Procedures (as defined in Rule 30a-3(c) under the Investment Company Act of 1940, the “Disclosure Controls”) as of a date within 90 days prior to the filing date (the “Filing Date”) of this Form N-CSR (the “Report”), the Chief Executive Officer (its principal executive officer) and Chief Financial Officer (its principal financial officer) have concluded that the Disclosure Controls are reasonably designed to ensure that information required to be disclosed by the Registrant in the Report is recorded, processed, summarized and reported by the Filing Date, including ensuring that information required to be disclosed in the Report is accumulated and communicated to the Registrant's management, including the Registrant's principal executive officer and principal financial officer, as appropriate to allow timely decisions regarding required disclosure.
(b) There were no changes in the Registrant’s internal control over financial reporting (as defined in Rule 30a-3(d) under the Investment Company Act of 1940) that occurred during period covered by this report that have materially affected or are reasonably likely to materially affect the Registrant’s internal control over financial reporting.
Item 12. Disclosure of Securities Lending Activities for Closed-End Management Investment Companies.
(a) Not applicable.
(b) Not applicable.
Item 13. Exhibits.
(a)(1) The Code of Conduct is available on the Company's website at https://ir.180degreecapital.com/governance-docs.
(a)(3) Not applicable.
(a)(4) Not applicable.
SIGNATURES
Pursuant to the requirements of the Securities Exchange Act of 1934 and the Investment Company Act of 1940, the Registrant has duly caused this report to be signed on its behalf by the undersigned, thereunto duly authorized.
180 DEGREE CAPITAL CORP.
| | | | | |
| By: | /s/ Daniel B. Wolfe |
| | Name: Daniel B. Wolfe |
| | Title: President and Chief Financial Officer |
| | |
| | Date: February 27, 2023 |
Pursuant to the requirements of the Securities Exchange Act of 1934 and the Investment Company Act of 1940, this report has been signed below by the following persons on behalf of the Registrant and in the capacities and on the dates indicated.
| | | | | | | | | | | | | | |
| By: | /s/ Kevin M. Rendino | | By: | /s/ Daniel B. Wolfe |
| | Name: Kevin M. Rendino | | | Name: Daniel B. Wolfe |
| | Title: Chief Executive Officer | | | Title: President and Chief Financial Officer |
| | (Principal Executive Officer) | | | (Principal Financial Officer) |
| | | | | |
| | Date: February 27, 2023 | | | Date: February 27, 2023 |