|
HARRIS
& HARRIS GROUP, INC.®
|
||
|
(Exact
Name of Registrant as Specified in its Charter)
|
||
|
New
York
|
13-3119827
|
|
|
(State
or Other Jurisdiction of
|
(I.R.S.
Employer Identification No.)
|
|
|
Incorporation
or Organization)
|
||
|
111
West 57th
Street, New York, New York
|
10019
|
|
|
(Address
of Principal Executive Offices)
|
(Zip
Code)
|
|
|
Title
of Each Class
|
Name
of Each Exchange on Which Registered
|
|
|
Common
Stock, $.01 par value
|
Nasdaq
Global Market
|
|
Large
accelerated filer ¨
|
Accelerated
filer þ
|
Non-accelerated
Filer ¨
|
|
DOCUMENTS
INCORPORATED BY REFERENCE
|
INCORPORATED
AT
|
|
|
Harris
& Harris Group, Inc. Proxy Statement for the
|
Part
III, Items 10, 11,
|
|
|
2007
Annual Meeting of Shareholders
|
12,
13 and 14
|
|
Page
|
|||
|
PART
I
|
|||
|
Item
1.
|
Business
|
1
|
|
|
Item
1A.
|
Risk
Factors
|
14
|
|
|
Item
1B.
|
Unresolved
Staff Comments
|
26
|
|
|
Item
2.
|
Properties
|
27
|
|
|
Item
3.
|
Legal
Proceedings
|
27
|
|
|
Item
4.
|
Submission
of Matters to a Vote of Security Holders
|
27
|
|
|
PART
II
|
|||
|
Item
5.
|
Market
For Registrant's Common Equity, Related
|
||
|
Stockholder
Matters and Issuer Purchase of
|
|||
|
Equity
Securities
|
28
|
||
|
Item
6.
|
Selected
Financial Data
|
31
|
|
|
Item
7.
|
Management's
Discussion and Analysis of Financial
|
||
|
Condition
and Results of Operations
|
32
|
||
|
Item
7A.
|
Quantitative
and Qualitative Disclosures About Market
|
||
|
|
Risk
|
49
|
|
|
Item
8.
|
Consolidated
Financial Statements
|
||
|
and
Supplementary Data
|
51
|
||
|
Item
9.
|
Changes
in and Disagreements with Accountants on
|
||
|
Accounting
and Financial Disclosure
|
95
|
||
|
Item
9A.
|
Controls
and Procedures
|
95
|
|
|
Item
9B.
|
Other
Information
|
95
|
|
|
PART
III
|
|||
|
Item
10.
|
Directors
and Executive Officers of the Registrant
|
96
|
|
|
Item
11.
|
Executive
Compensation
|
96
|
|
|
Item
12.
|
Security
Ownership of Certain Beneficial Owners
|
||
|
and
Management and Related Stockholder Matters
|
96
|
||
|
Item
13.
|
Certain
Relationships and Related Transactions,
|
||
|
and
Director Independence
|
96
|
||
|
Item
14.
|
Principal
Accountant Fees and Services
|
97
|
|
|
PART
IV
|
|||
|
Item
15.
|
Exhibits
and Financial Statements Schedules
|
98
|
|
|
Signatures
|
100
|
||
|
Exhibit
Index
|
102
|
||
| · |
Equity,
equity-related securities (including warrants) and debt with equity
features from either private or public
issuers.
|
| · |
Venture
capital investments, whether in corporate, partnership or other
form, including development stage or start-up entities.
|
| · |
Intellectual
property or patents or research and development in technology
or product development that may lead to patents or other marketable
technology.
|
| · |
Debt
obligations of all types having varying terms with respect to security
or credit support, subordination, purchase price, interest payments
and maturity.
|
| · |
Foreign
securities.
|
| · |
Miscellaneous
investments.
|
|
·
|
recruiting
management;
|
|
·
|
formulating
operating strategies;
|
|
·
|
formulating
intellectual property strategies;
|
|
·
|
assisting
in financial planning;
|
|
·
|
providing
management in the initial start-up stages; and
|
|
·
|
establishing
corporate goals.
|
|
·
|
funding
research and development in the development of a technology;
|
|
·
|
obtaining
licensing rights to intellectual property or patents;
|
|
·
|
acquiring
intellectual property or patents;
or
|
|
·
|
forming
and funding companies or joint ventures to commercialize further
intellectual property.
|
| • |
stock
market and capital markets
conditions;
|
| • |
internal
developments in our Company with respect to our personnel, financial
condition
and compliance with all applicable
regulations;
|
| • |
announcements
regarding any of our portfolio
companies;
|
| • |
announcements
regarding developments in the nanotechnology field in
general;
|
| • |
environmental
and health concerns regarding nanotechnology, whether real or perceptual;
|
| • |
announcements
regarding government funding and initiatives related to the development
of nanotechnology;
|
| • |
general
economic conditions and trends;
and/or
|
| • |
departures
of key personnel.
|
|
2006
Quarter Ending
|
Low
|
High
|
|||||
|
March
31
|
$
|
12.75
|
$
|
16.10
|
|||
|
June
30
|
$
|
9.57
|
$
|
14.26
|
|||
|
September
30
|
$
|
9.38
|
$
|
12.99
|
|||
|
December
31
|
$
|
11.80
|
$
|
15.16
|
|||
|
2005
Quarter Ending
|
Low
|
High
|
|||||
|
March
31
|
$
|
11.30
|
$
|
16.80
|
|||
|
June
30
|
$
|
10.01
|
$
|
13.38
|
|||
|
September
30
|
$
|
10.70
|
$
|
13.85
|
|||
|
December
31
|
$
|
10.15
|
$
|
14.95
|
|||
|
EQUITY
COMPENSATION PLAN INFORMATION
As
of December 31, 2006
|
|
|
Number
of securities to be issued upon exercise of outstanding options,
warrants
and rights
|
|
Weighted
average exercise price of outstanding options, warrants and
rights
|
|
Number
of securities remaining available for future
issuance
|
|||||
|
Plan
category
|
(a)
|
(b)
|
(c)
|
|||||||
|
Equity
compensation plans approved by security holders
|
3,699,611
|
$
|
10.11
|
192,986
|
||||||
|
Equity
compensation plans not approved by security holders
|
||||||||||
|
TOTAL
|
3,699,611
|
$
|
10.11
|
192,986
|
||||||
|
|
|
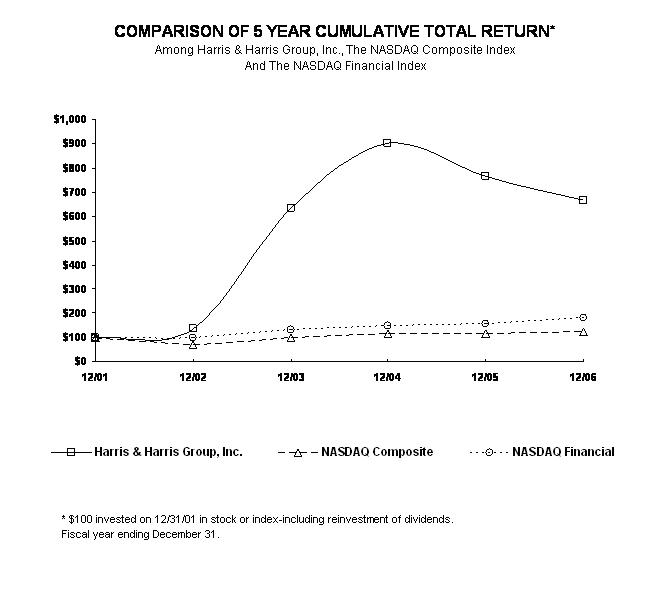
12/01
|
12/02
|
12/03
|
12/04
|
12/05
|
12/06
|
|
Harris
& Harris Group, Inc.
|
100.00
|
135.56
|
635.37
|
902.64
|
765.97
|
666.23
|
|
|
Nasdaq
Composite
|
100.00
|
69.66
|
99.71
|
113.79
|
114.47
|
124.20
|
|
|
Nasdaq
Financial
|
100.00
|
98.84
|
130.51
|
148.01
|
156.43
|
181.94
|
|
|
2006
|
|
2005
|
|
2004
|
|
2003
|
|
2002
|
|||||||
|
Total
assets
|
$
|
118,328,590
|
$
|
132,938,120
|
$
|
79,361,451
|
$
|
44,115,128
|
$
|
35,951,969
|
||||||
|
Total
liabilities
|
$
|
4,398,287
|
$
|
14,950,378
|
$
|
4,616,652
|
$
|
3,432,390
|
$
|
8,695,923
|
||||||
|
Net
assets
|
$
|
113,930,303
|
$
|
117,987,742
|
$
|
74,744,799
|
$
|
40,682,738
|
$
|
27,256,046
|
||||||
|
Net
asset value per outstanding share
|
$
|
5.42
|
$
|
5.68
|
$
|
4.33
|
$
|
2.95
|
$
|
2.37
|
||||||
|
Cash
dividends paid
|
$
|
0.00
|
$
|
0.00
|
$
|
0.00
|
$
|
0.00
|
$
|
0.00
|
||||||
|
Cash
dividends paid per outstanding share
|
$
|
0.00
|
$
|
0.00
|
$
|
0.00
|
$
|
0.00
|
$
|
0.00
|
||||||
|
Shares
outstanding, end of year
|
21,015,017
|
20,756,345
|
17,248,845
|
13,798,845
|
11,498,845
|
|||||||||||
|
|
2006
|
2005
|
2004
|
2003
|
2002
|
|||||||||||
|
Total
investment income
|
$
|
3,028,761
|
$
|
1,540,862
|
$
|
637,562
|
$
|
167,785
|
$
|
253,461
|
||||||
|
|
||||||||||||||||
|
Total
expenses1
|
$
|
10,641,696
|
$
|
7,006,623
|
$
|
4,046,341
|
$
|
2,731,527
|
$
|
2,124,549
|
||||||
|
Net
operating (loss) income
|
$
|
(7,612,935
|
)
|
$
|
(5,465,761
|
)
|
$
|
(3,408,779
|
)
|
$
|
(2,563,742
|
)
|
$
|
(1,871,088
|
)
|
|
|
Total
tax (benefit) expense2
|
$
|
(227,355
|
)
|
$
|
8,288,778
|
$
|
650,617
|
$
|
13,761
|
$
|
199,309
|
|||||
|
Net
realized income (loss) from
|
||||||||||||||||
|
investments
|
$
|
258,693
|
$
|
14,208,789
|
$
|
858,503
|
$
|
(984,925
|
)
|
$
|
2,390,302
|
|||||
|
Net
(increase) decrease in unrealized
|
||||||||||||||||
|
depreciation
on investments
|
$
|
(4,418,870
|
)
|
$
|
(2,026,652
|
)
|
$
|
484,162
|
$
|
343,397
|
$
|
(3,241,408
|
)
|
|||
|
Net
(decrease) increase in net assets
|
||||||||||||||||
|
resulting
from operations
|
$
|
(11,773,112
|
)
|
$
|
6,716,376
|
$
|
(2,066,114
|
)
|
$
|
(3,205,270
|
)
|
$
|
(2,722,194
|
)
|
||
|
(Decrease)
increase in net assets
|
||||||||||||||||
|
resulting
from operations per
|
||||||||||||||||
|
average
outstanding share
|
$
|
(0.57
|
)
|
$
|
0.36
|
$
|
(0.13
|
)
|
$
|
(0.28
|
)
|
$
|
(0.27
|
)
|
||
|
2001
|
2002
|
2003
|
2004
|
2005
|
2006
|
|
|
Total
Incremental Investments
|
$489,999
|
$6,240,118
|
$3,812,600
|
$14,837,846
|
$16,251,339
|
$24,408,187
|
|
No.
of New Investments
|
1
|
7
|
5
|
8
|
4
|
6
|
|
No.
of Follow-On Investment Rounds
|
0
|
1
|
5
|
21
|
13
|
14
|
|
No.
of Rounds Led
|
0
|
1
|
0
|
2
|
0
|
7
|
|
Average
Dollar Amount - Initial
|
$489,999
|
$784,303
|
$437,156
|
$911,625
|
$1,575,000
|
$2,383,424
|
|
Average
Dollar Amount - Follow-On
|
N/A
|
$750,000
|
$325,364
|
$359,278
|
$765,488
|
$721,974
|
|
2001
|
2002
|
2003
|
2004
|
2005
|
2006
|
||||||||||||||
|
Net
Asset Value, Beginning of Year
|
31,833,475
|
24,334,770
|
27,256,046
|
40,682,738
|
74,744,799
|
117,987,742
|
|||||||||||||
|
Gross
Write-Downs During Year
|
(2,532,730
|
)
|
(5,400,005
|
)
|
(1,256,102
|
)
|
(5,711,229
|
)
|
(3,450,236
|
)
|
(4,211,323
|
)
|
|||||||
|
Gross
Write-Downs as a Percentage of Net Asset Value
|
-7.96
|
%
|
-22.19
|
%
|
-4.61
|
%
|
-14.04
|
%
|
-4.62
|
%
|
-3.57
|
%
|
|||||||
|
31-Dec-00
|
31-Mar-01
|
30-June-01
|
30-Sep-01
|
31-Dec-01
|
||||||||||||
|
NAV
per Share
|
3.51
|
3.09
|
3.29
|
2.92
|
2.75
|
|||||||||||
|
$
Change
|
(0.42
|
)
|
0.20
|
(0.37
|
)
|
(0.17
|
)
|
|||||||||
|
%
Change
|
-11.97
|
%
|
6.47
|
%
|
-11.25
|
%
|
-5.82
|
%
|
||||||||
|
|
31-Mar-02
|
30-June-02
|
30-Sep-02(1
|
)
|
31-Dec-02
|
|||||||||||
|
NAV
per Share
|
2.63
|
2.68
|
2.61
|
2.37
|
||||||||||||
|
$
Change
|
(0.12
|
)
|
0.05
|
(0.07
|
)
|
(0.24
|
)
|
|||||||||
|
%
Change
|
-4.36
|
%
|
1.90
|
%
|
-2.61
|
%
|
-9.20
|
%
|
||||||||
|
|
31-Mar-03
|
30-June-03
|
30-Sep-03
|
31-Dec-03(1
|
)
|
|||||||||||
|
NAV
per Share
|
2.26
|
2.22
|
2.11
|
2.95
|
||||||||||||
|
$
Change
|
(0.11
|
)
|
(0.04
|
)
|
(0.11
|
)
|
0.84
|
|||||||||
|
%
Change
|
-4.64
|
%
|
-1.77
|
%
|
-4.95
|
%
|
39.81
|
%
|
||||||||
|
|
31-Mar-04
|
30-June-04
|
30-Sep-04(1
|
)
|
31-Dec-04
|
|||||||||||
|
NAV
per Share
|
3.01
|
2.85
|
4.44
|
4.33
|
||||||||||||
|
$
Change
|
0.06
|
(0.16
|
)
|
1.59
|
(0.11
|
)
|
||||||||||
|
%
Change
|
2.03
|
%
|
-5.32
|
%
|
55.79
|
%
|
-2.48
|
%
|
||||||||
|
|
31-Mar-05
|
30-June-05
|
30-Sep-05(1
|
)
|
31-Dec-05
|
|||||||||||
|
NAV
per Share
|
4.20
|
4.61
|
5.94
|
5.68
|
||||||||||||
|
$
Change
|
(0.13
|
)
|
0.41
|
1.33
|
(0.26
|
)
|
||||||||||
|
%
Change
|
-3.00
|
%
|
9.76
|
%
|
28.85
|
%
|
-4.38
|
%
|
||||||||
|
|
31-Mar-06
|
30-June-06
|
30-Sep-06
|
31-Dec-06
|
||||||||||||
|
NAV
per Share
|
5.6
|
5.54
|
5.54
|
5.42
|
||||||||||||
|
$
Change
|
(0.08
|
)
|
(0.06
|
)
|
0.00
|
(0.12
|
)
|
|||||||||
|
%
Change
|
-1.41
|
%
|
-1.07
|
%
|
0.00
|
%
|
-2.17
|
%
|
||||||||
|
New
Investments
|
Amount
|
|||
|
D-Wave
Systems, Inc.
|
$
|
1,750,547
|
||
|
Evolved
Nanomaterial Sciences, Inc.
|
2,800,000
|
|||
|
Innovalight,
Inc.
|
2,500,000
|
|||
|
Metabolon,
Inc.
|
2,500,000
|
|||
|
SiOnyx,
Inc.
|
750,000
|
|||
|
Xradia,
Inc.
|
4,000,000
|
|||
|
Follow-on
Investments
|
||||
|
Chlorogen,
Inc.
|
$
|
221,438
|
||
|
Crystal
IS, Inc.
|
1,098,240
|
|||
|
CSwitch
Corporation
|
2,850,000
|
|||
|
NanoGram
Corporation
|
1,262,764
|
|||
|
NanoOpto
Corporation
|
433,138
|
|||
|
NeoPhotonics
Corporation
|
2,750,000
|
|||
|
Nextreme
|
500,000
|
|||
|
Polatis,
Inc.
|
89,310
|
|||
|
Questech
Corporation
|
12,750
|
|||
|
SiOnyx,
Inc.
|
890,000
|
|||
|
Total
|
$
|
24,408,187
|
||
|
December
31,
|
|
||||||
|
|
|
2006
|
|
2005
|
|||
|
Venture
capital investments,
|
|||||||
|
at
cost
|
$
|
62,118,800
|
$
|
37,706,342
|
|||
|
Net
unrealized depreciation
|
8,450,969
|
4,519,009
|
|||||
|
Venture
capital investments,
|
|||||||
|
at
fair value
|
$
|
53,667,831
|
$
|
33,187,333
|
|||
|
|
December
31,
|
||||||
|
2006
|
2005
|
||||||
|
U.S.
government and agency
|
|||||||
|
securities,
at cost
|
$
|
59,212,598
|
$
|
96,320,405
|
|||
|
Net
unrealized depreciation
|
556,451
|
69,541
|
|||||
|
U.S.
government and agency
|
|||||||
|
securities,
at fair value
|
$
|
58,656,147
|
$
|
96,250,864
|
|||
|
December
31,
|
|||||||
|
Category
|
2006
|
2005
|
|||||
|
Tiny
Technology
|
99.9
|
%
|
99.9
|
%
|
|||
|
Other
Venture Capital Investments
|
0.1
|
%
|
0.1
|
%
|
|||
|
Total
Venture Capital Investments
|
100.0
|
%
|
100.0
|
%
|
|||
|
New
Investment
|
Amount
|
|||
|
eLite
Optoelectronics, Inc.
|
$
|
1,000,000
|
||
|
Kereos,
Inc.
|
800,000
|
|||
|
Kovio,
Inc.
|
3,000,000
|
|||
|
Zia
Laser, Inc.
|
1,500,000
|
|||
|
Follow-on
Investments
|
||||
|
Cambrios
Technologies Corporation
|
$
|
511,006
|
||
|
Chlorogen,
Inc.
|
364,261
|
|||
|
Kereos,
Inc.
|
160,000
|
|||
|
Molecular
Imprints, Inc.
|
2,500,000
|
|||
|
Nanomix,
Inc.
|
250,000
|
|||
|
NanoOpto
Corporation
|
411,741
|
|||
|
Mersana
Therapeutics, Inc.
|
683,000
|
|||
|
Nanosys,
Inc.
|
3,000,003
|
|||
|
Nantero,
Inc.
|
571,329
|
|||
|
NeoPhotonics
Corporation
|
999,999
|
|||
|
Starfire
Systems, Inc.
|
500,000
|
|||
|
Total
|
$
|
16,251,339
|
||
| Documents |
Page
|
|
|
Management's
Report on Internal Control Over
|
||
|
Financial
Reporting
|
52
|
|
|
Report
of Independent Registered Public Accounting Firm
|
53
|
|
| Consolidated Financial Statements | ||
|
Consolidated
Statements of Assets and Liabilities
|
||
|
as of December 31, 2006, and 2005
|
55
|
|
|
|
||
|
Consolidated
Statements of Operations for the
|
||
|
years ended December 31, 2006, 2005, 2004
|
56
|
|
|
Consolidated
Statements of Cash Flows for the
|
||
|
years
ended December 31, 2006, 2005, and 2004
|
57
|
|
|
Consolidated
Statements of Changes in Net Assets for the
|
||
|
years
ended December 31, 2006, 2005, and 2004
|
58
|
|
|
Consolidated
Schedule of Investments as of December 31, 2006
|
59-66
|
|
|
Consolidated
Schedule of Investments as of December 31, 2005
|
67-72
|
|
|
Footnote
to Consolidated Schedule of Investments
|
73-76
|
|
|
Notes
to Consolidated Financial Statements
|
77-93
|
|
|
Financial
Highlights for the years ended December 31, 2006,
|
||
|
2005 and 2004
|
94
|
|
|
•
|
pertain
to the maintenance of records that in reasonable detail accurately
and
fairly reflect the transactions and dispositions of the assets of
the
Company;
|
|
•
|
provide
reasonable assurance that transactions are recorded as necessary
to permit
preparation of financial statements in accordance with generally
accepted
accounting principles, and that receipts and expenditures of the
company
are being made only in accordance with authorizations of management
and
directors of the Company; and
|
|
•
|
provide
reasonable assurance regarding prevention or timely detection of
unauthorized acquisition, use or disposition of the Company's assets
that
could have a material effect on the financial
statements.
|
|
HARRIS
& HARRIS GROUP, INC.
CONSOLIDATED
STATEMENTS OF ASSETS AND
LIABILITIES
|
|
ASSETS
|
|||||||
|
December
31, 2006
|
|
December
31, 2005
|
|||||
|
Investments,
at value (Cost: $121,331,398 at 12/31/06,
|
|||||||
|
$134,026,747
at 12/31/05
|
$
|
112,323,978
|
$
|
129,438,197
|
|||
|
Cash
and cash equivalents
|
2,071,788
|
1,213,289
|
|||||
|
Restricted
funds (Note 6)
|
2,149,785
|
1,730,434
|
|||||
|
Receivable
from portfolio company
|
0
|
75,000
|
|||||
|
Receivable
from broker (Note 3)
|
819,905
|
0
|
|||||
|
Interest
receivable
|
625,372
|
248,563
|
|||||
|
Prepaid
expenses
|
10,945
|
2,993
|
|||||
|
Other
assets
|
326,817
|
229,644
|
|||||
|
Total
assets
|
$
|
118,328,590
|
$
|
132,938,120
|
|||
|
LIABILITIES
& NET ASSETS
|
|||||||
|
Accounts
payable and accrued liabilities (Note 6)
|
$
|
4,115,300
|
$
|
3,174,183
|
|||
|
Accrued
profit sharing (Note 4)
|
261,661
|
2,107,858
|
|||||
|
Deferred
rent
|
21,326
|
31,003
|
|||||
|
Current
taxes payable
|
0
|
1,514,967
|
|||||
|
Taxes
payable on behalf of shareholders (Note 7)
|
0
|
8,122,367
|
|||||
|
Total
liabilities
|
4,398,287
|
14,950,378
|
|||||
|
Net
assets
|
$
|
113,930,303
|
$
|
117,987,742
|
|||
|
Net
assets are comprised of:
|
|||||||
|
Preferred
stock, $0.10 par value,
|
|||||||
|
2,000,000
shares authorized; none issued
|
$
|
0
|
$ | 0 | |||
|
Common
stock, $0.01 par value, 45,000,000 shares authorized at
|
|||||||
|
12/31/06
and 30,000,000 at 12/31/05; 22,843,757 issued at
|
|||||||
|
12/31/06
and 22,585,085 issued at 12/31/05
|
228,438
|
225,851
|
|||||
|
Additional
paid in capital (Note 9)
|
129,801,201
|
122,149,642
|
|||||
|
Accumulated
net realized income (loss)
|
(3,747,912
|
)
|
3,781,905
|
||||
|
Accumulated
unrealized depreciation of investments
|
(9,007,420
|
)
|
(4,764,125
|
)
|
|||
|
Unrecognized
net gain on retirement benefit plans (Note 6)
|
61,527
|
||||||
|
Treasury
stock, at cost (1,828,740 shares at 12/31/06 and
|
|||||||
|
12/31/05)
|
(3,405,531
|
)
|
(3,405,531
|
)
|
|||
|
Net
assets
|
$
|
113,930,303
|
$
|
117,987,742
|
|||
|
Shares
outstanding
|
21,015,017
|
20,756,345
|
|||||
|
Net
asset value per outstanding share
|
$
|
5.42
|
$
|
5.68
|
|||
|
HARRIS
& HARRIS GROUP, INC.
CONSOLIDATED
STATEMENTS OF OPERATIONS
|
|
|
Year
Ended
|
|
Year
Ended
|
|
Year
Ended
|
|
||||
|
|
|
December
31, 2006
|
|
December
31, 2005
|
|
December
31, 2004
|
||||
|
Investment
income:
|
||||||||||
|
Interest
from:
|
||||||||||
|
Fixed-income
securities
|
$
|
2,991,261
|
$
|
1,409,273
|
$
|
614,728
|
||||
|
Portfolio
companies
|
0
|
65,620
|
22,834
|
|||||||
|
Miscellaneous
income
|
37,500
|
65,969
|
0
|
|||||||
|
Total
investment income
|
3,028,761
|
1,540,862
|
637,562
|
|||||||
|
Expenses:
|
||||||||||
|
Salaries,
benefits and stock-based
|
||||||||||
|
compensation
(Note 3)
|
7,933,276
|
2,459,033
|
1,928,088
|
|||||||
|
Administration
and operations
|
1,250,080
|
1,319,354
|
718,530
|
|||||||
|
Profit-sharing
provision (Note 4)
|
50,875
|
1,796,264
|
311,594
|
|||||||
|
Professional
fees
|
737,828
|
830,062
|
667,311
|
|||||||
|
Rent
|
239,846
|
211,582
|
151,434
|
|||||||
|
Directors'
fees and expenses
|
340,750
|
308,874
|
209,210
|
|||||||
|
Depreciation
|
64,916
|
64,713
|
43,151
|
|||||||
|
Custodian
fees
|
24,125
|
16,741
|
17,023
|
|||||||
|
Total
expenses
|
10,641,696
|
7,006,623
|
4,046,341
|
|||||||
|
Net
operating loss
|
(7,612,935
|
)
|
(5,465,761
|
)
|
(3,408,779
|
)
|
||||
|
Net
realized gain from investments:
|
||||||||||
|
Realized
gain from investments
|
31,338
|
23,862,037
|
813,994
|
|||||||
|
Income
tax (benefit) expense (Note 7)
|
(227,355
|
)
|
9,653,248
|
(44,509
|
)
|
|||||
|
Net
realized gain from investments
|
258,693
|
14,208,789
|
858,503
|
|||||||
|
Net
(increase) decrease in unrealized
|
||||||||||
|
depreciation
on investments:
|
||||||||||
|
Change
as a result of investment sales
|
0
|
|
(23,181,420
|
)
|
915,118
|
|||||
|
Change
on investments held
|
(4,418,870
|
)
|
19,790,298
|
264,170
|
||||||
|
Change
in unrealized depreciation
|
||||||||||
|
on
investments
|
(4,418,870
|
)
|
(3,391,122
|
)
|
1,179,288
|
|||||
|
Income
tax (benefit) expense (Note 7)
|
0
|
(1,364,470
|
)
|
695,126
|
||||||
|
Net
decrease (increase) in unrealized
|
||||||||||
|
depreciation
on investments
|
(4,418,870
|
)
|
(2,026,652
|
)
|
484,162
|
|||||
|
Net
(decrease) increase in net assets
|
||||||||||
|
resulting
from operations:
|
||||||||||
|
Total
|
$
|
(11,773,112
|
)
|
$
|
6,716,376
|
$
|
(2,066,114
|
)
|
||
|
Per
average basic and diluted outstanding share
|
$
|
(0.57
|
)
|
$
|
0.36
|
$
|
(0.
13
|
)
|
||
|
Average
outstanding shares
|
20,759,547
|
18,471,770
|
15,476,714
|
|||||||
|
HARRIS
& HARRIS GROUP, INC.
CONSOLIDATED
STATEMENTS OF CASH FLOWS
|
|
Year
Ended
|
|
Year
Ended
|
|
Year
Ended
|
|
|||||
|
|
|
December
31, 2006
|
|
December
31, 2005
|
|
December
31, 2004
|
||||
|
Cash
flows used in operating activities:
|
||||||||||
|
Net
(decrease) increase in net assets
|
||||||||||
|
resulting
from operations
|
$
|
(11,773,112
|
)
|
$
|
6,716,376
|
$
|
(2,066,114
|
)
|
||
|
Adjustments
to reconcile net increase (decrease) in net assets
|
||||||||||
|
resulting
from operations to net cash used in operating activities:
|
||||||||||
|
Net
realized and unrealized loss (gain) on investments
|
4,420,619
|
(20,470,915
|
)
|
(1,993,282
|
)
|
|||||
|
Deferred
income taxes
|
0
|
(1,364,470
|
)
|
695,126
|
||||||
|
Depreciation
and amortization
|
(426,168
|
)
|
346,019
|
43,151
|
||||||
|
Taxes
payable on behalf of shareholders on deemed dividend
|
0
|
8,122,367
|
0
|
|||||||
|
Stock-based
compensation expense
|
5,038,956
|
0
|
0
|
|||||||
|
Changes
in assets and liabilities:
|
||||||||||
|
Restricted
funds
|
(419,351
|
)
|
(138,463
|
)
|
(379,893
|
)
|
||||
|
Receivable
from portfolio company
|
75,000
|
(65,000
|
)
|
(10,000
|
)
|
|||||
|
Interest
receivable
|
(376,808
|
)
|
(189,603
|
)
|
(58,510
|
)
|
||||
|
Income
tax receivable
|
0
|
(7,023
|
)
|
14,895
|
||||||
|
Prepaid
expenses
|
(7,951
|
)
|
539,496
|
(535,648
|
)
|
|||||
|
Other
receivables
|
(819,905
|
)
|
0
|
0
|
||||||
|
Other
assets
|
(176,325
|
)
|
11,599
|
(8,666
|
)
|
|||||
|
Accounts
payable and accrued liabilities
|
1,002,643
|
268,525
|
182,260
|
|||||||
|
Accrued
profit sharing
|
(1,846,197
|
)
|
1,796,264
|
311,594
|
||||||
|
Deferred
rent
|
(9,677
|
)
|
(3,927
|
)
|
(4,718
|
)
|
||||
|
Current
income tax liability
|
(9,637,026
|
)
|
1,524,470
|
0
|
||||||
|
|
||||||||||
|
Net
cash used
in operating
activities
|
(14,955,302
|
)
|
(2,914,285
|
)
|
(3,809,805
|
)
|
||||
|
Cash
flows from investing activities:
|
||||||||||
|
Net
(purchase) sale of short-term investments
|
||||||||||
|
and
marketable securities
|
37,593,589
|
(52,144,482
|
)
|
(17,823,606
|
)
|
|||||
|
Investment
in private placements and loans
|
(24,408,187
|
)
|
(16,251,339
|
)
|
(16,731,216
|
)
|
||||
|
Proceeds
from sale of investments
|
28,295
|
35,392,200
|
2,530,483
|
|||||||
|
Purchase
of fixed assets
|
(15,086
|
)
|
(45,704
|
)
|
(69,273
|
)
|
||||
|
Net
cash provided by (used in) investing activities
|
13,198,611
|
(33,049,325
|
)
|
(32,093,612
|
)
|
|||||
|
Cash
flows from financing activities:
|
||||||||||
|
Proceeds
from public offering, net (Note 9)
|
0
|
36,526,567
|
36,128,175
|
|||||||
|
Proceeds
from stock option exercises (Note 3)
|
2,615,190
|
0
|
0
|
|||||||
|
Net
cash provided by financing activities
|
2,615,190
|
36,526,567
|
36,128,175
|
|||||||
|
Net
increase in cash and cash equivalents:
|
||||||||||
|
Cash
and cash equivalents at beginning of the year
|
1,213,289
|
650,332
|
425,574
|
|||||||
|
Cash
and cash equivalents at end of the year
|
2,071,788
|
1,213,289
|
650,332
|
|||||||
|
Net
increase in cash and cash equivalents
|
$
|
858,499
|
$
|
562,957
|
$
|
224,758
|
||||
|
Supplemental
disclosures of cash flow information:
|
||||||||||
|
Income
taxes paid
|
$
|
9,425,922
|
$
|
0
|
$
|
0
|
||||
|
HARRIS
& HARRIS GROUP, INC.
CONSOLIDATED
STATEMENTS OF CHANGES IN NET ASSETS
|
|
Year
Ended
|
|
Year
Ended
|
|
Year
Ended
|
|
|||||
|
|
|
December
31, 2006
|
|
December
31, 2005
|
|
December
31, 2004
|
||||
|
Changes
in net assets from operations:
|
||||||||||
|
Net
operating loss
|
$
|
(7,612,935
|
)
|
$
|
(5,465,761
|
)
|
$
|
(3,408,779
|
)
|
|
|
Net
realized income (loss) on investments
|
258,693
|
14,208,789
|
858,503
|
|||||||
|
Net
increase (decrease) in unrealized
|
||||||||||
|
depreciation
on investments as a
|
||||||||||
|
result
of sales
|
0
|
(23,181,420
|
)
|
915,118
|
||||||
|
Net
(increase) decrease in unrealized
|
||||||||||
|
depreciation
on investments held
|
(4,418,870
|
)
|
19,790,298
|
264,170
|
||||||
|
Net
change in deferred taxes
|
0
|
1,364,470
|
(695,126
|
)
|
||||||
|
Net
increase (decrease) in net assets resulting
|
||||||||||
|
from
operations
|
(11,773,112
|
)
|
6,716,376
|
(2,066,114
|
)
|
|||||
|
Changes
in net assets from
|
||||||||||
|
capital
stock transactions:
|
||||||||||
|
Issuance
of common stock upon the
|
||||||||||
|
exercise
of stock options
|
2,587
|
0
|
0
|
|||||||
|
Proceeds
from sale of stock
|
0
|
35,075
|
34,500
|
|||||||
|
Additional
paid in capital on common
|
||||||||||
|
stock
issued
|
2,612,603
|
36,491,492
|
36,093,675
|
|||||||
|
Stock
based compensation expense
|
5,038,956
|
0
|
0
|
|||||||
|
Net
increase in net assets resulting
|
||||||||||
|
from
capital stock
transactions
|
7,654,146
|
36,526,567
|
36,128,175
|
|||||||
|
Changes
in net assets from adoption
|
||||||||||
|
of
SFAS No. 158
|
61,527
|
0
|
0
|
|||||||
|
Net
(decrease) increase in net assets
|
(4,057,439
|
)
|
43,242,943
|
34,062,061
|
||||||
|
Net
Assets:
|
||||||||||
|
Beginning
of the year
|
117,987,742
|
74,744,799
|
40,682,738
|
|||||||
|
End
of the year
|
$
|
113,930,303
|
$
|
117,987,742
|
$
|
74,744,799
|
||||
|
HARRIS
& HARRIS GROUP, INC.
CONSOLIDATED
SCHEDULE OF INVESTMENTS AS OF DECEMBER 31,
2006
|
|
Method
of
|
|
Shares/
|
|
|
|
|||||
|
|
|
Valuation
(3)
|
|
Principal
|
|
Value
|
||||
|
Investments
in Unaffiliated Companies (6)(7) - 15.61% of net
assets
|
||||||||||
|
Private
Placement Portfolio (Illiquid) - 15.61% of net
assets
|
||||||||||
|
AlphaSimplex
Group, LLC (2) -- Investment management company headed by
|
||||||||||
|
Dr.
Andrew W. Lo, holder of the Harris & Harris Group Chair at
MIT
|
||||||||||
|
Limited
Liability Company Interest
|
(B
|
)
|
--
|
$
|
10,521
|
|||||
|
Exponential
Business Development Company (1)(2) --
|
||||||||||
|
Venture
capital partnership focused on early stage companies
|
||||||||||
|
Limited
Partnership Interest
|
(B
|
)
|
--
|
0
|
||||||
|
Molecular
Imprints, Inc. (1)(2) -- Manufacturing nanoimprint lithography
|
||||||||||
|
capital
equipment
|
||||||||||
|
Series
B Convertible Preferred Stock
|
(A
|
)
|
1,333,333
|
2,000,000
|
||||||
|
Series
C Convertible Preferred Stock
|
(A
|
)
|
1,250,000
|
2,500,000
|
||||||
|
Warrants
at $2.00 expiring12/31/11
|
(B
|
)
|
125,000
|
0
|
||||||
|
4,500,000
|
||||||||||
|
Nanosys,
Inc. (1)(2)(5) -- Developing zero and one-dimensional
|
||||||||||
|
inorganic
nanometer-scale materials for use in nanotechnology-
|
||||||||||
|
enabled
systems
|
||||||||||
|
Series
C Convertible Preferred Stock
|
(C
|
)
|
803,428
|
2,370,113
|
||||||
|
Series
D Convertible Preferred Stock
|
(C
|
)
|
1,016,950
|
3,000,003
|
||||||
|
5,370,116
|
||||||||||
|
Nantero,
Inc. (1)(2)(5) -- Developing a high-density, nonvolatile, random
|
||||||||||
|
access
memory chip, enabled by carbon nanotubes
|
||||||||||
|
Series
A Convertible Preferred Stock
|
(C
|
)
|
345,070
|
1,046,908
|
||||||
|
Series
B Convertible Preferred Stock
|
(C
|
)
|
207,051
|
628,172
|
||||||
|
Series
C Convertible Preferred Stock
|
(C
|
)
|
188,315
|
571,329
|
||||||
|
2,246,409
|
||||||||||
|
HARRIS
& HARRIS GROUP, INC.
CONSOLIDATED
SCHEDULE OF INVESTMENTS AS OF DECEMBER
31, 2006
|
|
Method
of
|
Shares/
|
|
||||||||
|
|
Valuation
(3)
|
Principal
|
Value
|
|||||||
|
Investments
in Unaffiliated Companies (6)(7) - 15.61% of net assets
(cont.)
|
||||||||||
|
Private
Placement Portfolio (Illiquid) - 15.61% of net assets
(cont.)
|
||||||||||
|
NeoPhotonics
Corporation (1)(2) -- Developing and manufacturing
|
||||||||||
|
planar
optical devices and components
|
||||||||||
|
Common
Stock
|
(C
|
)
|
716,195
|
$
|
133,141
|
|||||
|
Series
1 Convertible Preferred Stock
|
(C
|
)
|
1,831,256
|
1,831,256
|
||||||
|
Series
2 Convertible Preferred Stock
|
(C
|
)
|
741,898
|
741,898
|
||||||
|
Series
3 Convertible Preferred Stock
|
(C
|
)
|
2,750,000
|
2,750,000
|
||||||
|
Warrants
at $0.15 expiring 01/26/10
|
(C
|
)
|
16,364
|
164
|
||||||
|
Warrants
at $0.15 expiring 12/05/10
|
(C
|
)
|
14,063
|
140
|
||||||
|
5,456,599
|
||||||||||
|
Polatis,
Inc. (1)(2)(5)(10) -- Developing optical networking
components
|
||||||||||
|
by
merging materials, MEMS and electronics technologies
|
||||||||||
|
Series
A-1 Convertible Preferred Stock
|
(B
|
)
|
16,775
|
0
|
||||||
|
Series
A-2 Convertible Preferred Stock
|
(B
|
)
|
71,611
|
141,520
|
||||||
|
Series
A-4 Convertible Preferred Stock
|
(B
|
)
|
4,774
|
9,435
|
||||||
|
Series
A-5 Convertible Preferred Stock
|
(B
|
)
|
5,491
|
45,127
|
||||||
|
196,082
|
||||||||||
|
Total
Unaffiliated Private Placement Portfolio (cost:
$18,107,124)
|
$
|
17,779,727
|
||||||||
|
Total
Investments in Unaffiliated Companies (cost:
$18,107,124)
|
$
|
17,779,727
|
||||||||
|
HARRIS
& HARRIS GROUP, INC.
CONSOLIDATED
SCHEDULE OF INVESTMENTS AS OF DECEMBER
31, 2006
|
|
Method
of
|
Shares/
|
|
||||||||
|
|
Valuation
(3)
|
Principal
|
Value
|
|||||||
|
Investments
in Non-Controlled Affiliated Companies (6)(8) -28.20% of net
assets
|
||||||||||
|
Private
Placement Portfolio (Illiquid)
- 28.20% of net assets
|
||||||||||
|
BridgeLux,
Inc. (1)(2)(11) -- Manufacturing high-power light
|
||||||||||
|
emitting
diodes
|
||||||||||
|
Series
B Convertible Preferred Stock
|
(A
|
)
|
1,861,504
|
$
|
1,000,000
|
|||||
|
Cambrios
Technologies Corporation (1)(2)(5) -- Developing nanowire-
|
||||||||||
|
enabled
electronic materials for the display industry
|
||||||||||
|
Series
B Convertible Preferred Stock
|
(A
|
)
|
1,294,025
|
1,294,025
|
||||||
|
Chlorogen,
Inc. (1)(2)(5) -- Developing patented chloroplast technology
|
||||||||||
|
to
produce plant-made proteins
|
||||||||||
|
Series
A Convertible Preferred Stock
|
(C
|
)
|
4,478,038
|
785,000
|
||||||
|
Series
B Convertible Preferred Stock
|
(C
|
)
|
2,077,930
|
364,261
|
||||||
|
Secured
Convertible Bridge Note (including interest)
|
(A
|
)
|
$
|
221,438
|
225,697
|
|||||
|
1,374,958
|
||||||||||
|
Crystal
IS, Inc. (1)(2)(5) -- Developing single-crystal
|
||||||||||
|
aluminum
nitride substrates for optoelectronic devices
|
||||||||||
|
Series
A Convertible Preferred Stock
|
(C
|
)
|
391,571
|
305,425
|
||||||
|
Series
A-1 Convertible Preferred Stock
|
(C
|
)
|
1,300,376
|
1,014,294
|
||||||
|
Warrants
at $0.78 expiring 05/05/2013
|
(B
|
)
|
15,231
|
0
|
||||||
|
Warrants
at $0.78 expiring 05/12/2013
|
(B
|
)
|
2,350
|
0
|
||||||
|
Warrants
at $0.78 expiring 08/08/2013
|
(B
|
)
|
4,396
|
0
|
||||||
|
1,319,719
|
||||||||||
|
CSwitch,
Inc. (1)(2)(5) -- Developing next-generation,
system-on-a-chip
|
||||||||||
|
solutions
for communications-based platforms
|
||||||||||
|
Series
A-1 Convertible Preferred Stock
|
(C
|
)
|
6,700,000
|
3,350,000
|
||||||
|
HARRIS
& HARRIS GROUP, INC.
CONSOLIDATED
SCHEDULE OF INVESTMENTS AS OF DECEMBER
31, 2006
|
|
Method
of
|
Shares/
|
|||||||||
|
Valuation
(3)
|
Principal
|
Value
|
||||||||
|
Investments
in Non-Controlled Affiliated Companies (6)(8) - 28.20% of net assets
(cont.)
|
||||||||||
|
Private
Placement Portfolio (Illiquid)
- 28.20% of net assets (cont.)
|
||||||||||
|
D-Wave
Systems, Inc. (1)(2)(4)(5)(13) -- Developing
high-performance
|
||||||||||
|
quantum
computing systems
|
||||||||||
|
Series
B Convertible Preferred Stock
|
(A
|
)
|
2,000,000
|
$
|
1,716,444
|
|||||
|
Warrants
at $0.85 expiring 10/19/07
|
(B
|
)
|
1,800,000
|
0
|
||||||
|
1,716,444
|
||||||||||
|
Innovalight,
Inc. (1)(2)(4)(5) - Developing renewable energy products
|
||||||||||
|
enabled
by silicon-based nanomaterials
|
||||||||||
|
Series
B Convertible Preferred Stock
|
(A
|
)
|
16,666,666
|
2,500,000
|
||||||
|
Kereos,
Inc. (1)(2)(5) -- Developing emulsion-based imaging
|
||||||||||
|
agents
and targeted therapeutics to image and treat cancer
|
||||||||||
|
and
cardiovascular disease
|
||||||||||
|
Series
B Convertible Preferred Stock
|
(A
|
)
|
349,092
|
960,000
|
||||||
|
Kovio,
Inc. (1)(2)(5) -- Developing semiconductor products
|
||||||||||
|
using
printed electronics and thin-film technologies
|
||||||||||
|
Series
C Convertible Preferred Stock
|
(A
|
)
|
2,500,000
|
3,000,000
|
||||||
|
Mersana
Therapeutics, Inc. (1)(2)(5)(12) -- Developing advanced
|
||||||||||
|
polymers
for drug delivery
|
||||||||||
|
Series
A Convertible Preferred Stock
|
(C
|
)
|
68,452
|
136,904
|
||||||
|
Series
B Convertible Preferred Stock
|
(C
|
)
|
616,500
|
1,233,000
|
||||||
|
Warrants
at $2.00 expiring 10/21/10
|
(B
|
)
|
91,625
|
0
|
||||||
|
1,369,904
|
||||||||||
|
Metabolon,
Inc. (1)(2)(4)(5) - Discovering biomarkers through
|
||||||||||
|
the
use of metabolomics
|
||||||||||
|
Series
B Convertible Preferred Stock
|
(A
|
)
|
2,173,913
|
2,500,000
|
||||||
|
HARRIS
& HARRIS GROUP, INC.
CONSOLIDATED
SCHEDULE OF INVESTMENTS AS OF DECEMBER
31, 2006
|
|
Method
of
|
Shares/
|
|
||||||||
|
|
Valuation
(3)
|
Principal
|
Value
|
|||||||
|
Investments
in Non-Controlled Affiliated Companies (6)(8) - 28.20% of net assets
(cont.)
|
||||||||||
|
Private
Placement Portfolio (Illiquid)
- 28.20% of net assets (cont.)
|
||||||||||
|
NanoGram
Corporation (1)(2)(5) -- Developing a broad suite of intellectual
|
||||||||||
|
property
utilizing nanotechnology
|
||||||||||
|
Series
I Convertible Preferred Stock
|
(C
|
)
|
63,210
|
$
|
64,259
|
|||||
|
Series
II Convertible Preferred Stock
|
(C
|
)
|
1,250,904
|
1,271,670
|
||||||
|
Series
III Convertible Preferred Stock
|
(C
|
)
|
1,242,144
|
1,262,764
|
||||||
|
2,598,693
|
||||||||||
|
Nanomix,
Inc. (1)(2)(5) -- Producing nanoelectronic sensors that
|
||||||||||
|
integrate
carbon nanotube electronics with silicon microstructures
|
||||||||||
|
Series
C Convertible Preferred Stock
|
(B
|
)
|
9,779,181
|
790,000
|
||||||
|
NanoOpto
Corporation (1)(2)(5) -- Manufacturing discrete and
integrated
|
||||||||||
|
optical
communications sub-components on a chip by utilizing
|
||||||||||
|
nano
manufacturing and nano coating technology
|
||||||||||
|
Series
A-1 Convertible Preferred Stock
|
(B
|
)
|
267,857
|
16,400
|
||||||
|
Series
B Convertible Preferred Stock
|
(B
|
)
|
3,819,935
|
560,328
|
||||||
|
Series
C Convertible Preferred Stock
|
(B
|
)
|
1,932,789
|
425,266
|
||||||
|
Series
D Convertible Preferred Stock
|
(B
|
)
|
1,397,218
|
204,951
|
||||||
|
Warrants
at $0.4359 expiring 03/15/10
|
(B
|
)
|
193,279
|
0
|
||||||
|
1,206,945
|
||||||||||
|
Nextreme
Thermal Solutions, Inc. (1)(2)(5) -- Developing thin-film
|
||||||||||
|
thermoelectric
devices
|
||||||||||
|
Series
A Convertible Preferred Stock
|
(A
|
)
|
1,000,000
|
1,000,000
|
||||||
|
Questech
Corporation (1)(2) -- Manufacturing and marketing
|
||||||||||
|
proprietary
metal and stone decorative tiles
|
||||||||||
|
Common
Stock
|
(B
|
)
|
655,454
|
996,683
|
||||||
|
Warrants
at $1.50 expiring 11/21/07
|
(B
|
)
|
3,750
|
77
|
||||||
|
Warrants
at $1.50 expiring 11/19/08
|
(B
|
)
|
5,000
|
103
|
||||||
|
Warrants
at $1.50 expiring 11/19/09
|
(B
|
)
|
5,000
|
103
|
||||||
|
996,966
|
||||||||||
|
HARRIS
& HARRIS GROUP, INC.
CONSOLIDATED
SCHEDULE OF INVESTMENTS AS OF DECEMBER
31, 2006
|
|
Method
of
|
Shares/
|
|
||||||||
|
|
Valuation
(3)
|
Principal
|
Value
|
|||||||
|
Investments
in Non-Controlled Affiliated Companies (6)(8) - 28.20% of net assets
(cont.)
|
||||||||||
|
Private
Placement Portfolio (Illiquid)
- 28.20% of net assets (cont.)
|
||||||||||
|
Solazyme,
Inc. (1)(2)(5) -- Developing energy-harvesting
|
||||||||||
|
machinery
of photosynthetic microbes to produce industrial
|
||||||||||
|
and
pharmaceutical molecules
|
||||||||||
|
Series
A Convertible Preferred Stock
|
(C
|
)
|
988,204
|
$
|
385,400
|
|||||
|
Starfire
Systems, Inc. (1)(2)(5) --Producing ceramic-forming polymers
|
||||||||||
|
Common
Stock
|
(A
|
)
|
375,000
|
150,000
|
||||||
|
Series
A-1 Convertible Preferred Stock
|
(C
|
)
|
600,000
|
600,000
|
||||||
|
750,000
|
||||||||||
|
Xradia,
Inc. (1)(2)(4) - Designing, manufacturing and selling ultra
high
|
||||||||||
|
resolution
3D x-ray microscopes and fluorescence imaging systems.
|
||||||||||
|
Series
D Convertible Preferred Stock
|
(A
|
)
|
3,121,099
|
4,000,000
|
||||||
|
Zia
Laser, Inc. (1)(2)(5) -- Developing quantum dot semiconductor
lasers
|
||||||||||
|
Series
C Convertible Preferred Stock
|
(C
|
)
|
1,500,000
|
15,000
|
||||||
|
Total
Non-Controlled Private Placement Portfolio (cost:
$39,571,676)
|
$
|
32,128,054
|
||||||||
|
Total
Investments in Non-Controlled Affiliated Companies (cost:
$39,571,676)
|
$
|
32,128,054
|
||||||||
|
HARRIS
& HARRIS GROUP, INC.
CONSOLIDATED
SCHEDULE OF INVESTMENTS AS OF DECEMBER 31,
2006
|
|
Method
of
|
Shares/
|
|
||||||||
|
|
Valuation
(3)
|
Principal
|
Value
|
|||||||
|
Investments
in Controlled Affiliated Companies (6)(9) - 3.30% of net
assets
|
||||||||||
|
Private
Placement Portfolio (Illiquid)
- 3.30% of net assets
|
||||||||||
|
Evolved
Nanomaterial Sciences, Inc. (1)(2)(4)(5) -- Developing
|
||||||||||
|
nanotechnology-enhanced
approaches for the resolution of
|
||||||||||
|
chiral
molecules
|
||||||||||
|
Series
A Convertible Preferred Stock
|
(A
|
)
|
5,870,021
|
$
|
2,800,000
|
|||||
|
SiOnyx,
Inc. (1)(2)(4)(5) -- Developing silicon-based
|
||||||||||
|
optoelectronic
products enabled by its proprietary, "Black Silicon"
|
||||||||||
|
Series
A Convertible Preferred Stock
|
(C
|
)
|
233,499
|
70,050
|
||||||
|
Series
A-1 Convertible Preferred Stock
|
(C
|
)
|
2,966,667
|
890,000
|
||||||
|
960,050
|
||||||||||
|
Total
Controlled Private Placement Portfolio (cost:
$4,440,000)
|
$
|
3,760,050
|
||||||||
|
Total
Investments in Controlled Affiliated Companies (cost:
$4,440,000)
|
$
|
3,760,050
|
||||||||
|
U.S.
Government and Agency Securities - 51.48% of net
assets
|
||||||||||
|
U.S.
Treasury Bill -- due date 1/18/07
|
(J
|
)
|
2,217,000
|
2,212,677
|
||||||
|
U.S.
Treasury Notes -- due date 11/30/07, coupon 4.25%
|
(H
|
)
|
6,500,000
|
6,455,345
|
||||||
|
U.S.
Treasury Notes -- due date 02/15/08, coupon 3.375%
|
(H
|
)
|
9,000,000
|
8,842,860
|
||||||
|
U.S.
Treasury Notes -- due date 05/15/08, coupon 3.75%
|
(H
|
)
|
9,000,000
|
8,862,210
|
||||||
|
U.S.
Treasury Notes -- due date 09/15/08, coupon 3.125%
|
(H
|
)
|
5,000,000
|
4,861,350
|
||||||
|
U.S.
Treasury Notes -- due date 01/15/09, coupon 3.25%
|
(H
|
)
|
3,000,000
|
2,910,930
|
||||||
|
U.S.
Treasury Notes -- due date 02/15/09, coupon 4.50%
|
(H
|
)
|
5,100,000
|
5,069,145
|
||||||
|
U.S.
Treasury Notes -- due date 04/15/09, coupon 3.125%
|
(H
|
)
|
3,000,000
|
2,893,830
|
||||||
|
U.S.
Treasury Notes -- due date 07/15/09, coupon 3.625%
|
(H
|
)
|
3,000,000
|
2,920,890
|
||||||
|
U.S.
Treasury Notes -- due date 10/15/09, coupon 3.375%
|
(H
|
)
|
3,000,000
|
2,894,310
|
||||||
|
U.S.
Treasury Notes -- due date 01/15/10, coupon 3.625%
|
(H
|
)
|
3,000,000
|
2,907,420
|
||||||
|
U.S.
Treasury Notes -- due date 04/15/10, coupon 4.00%
|
(H
|
)
|
3,000,000
|
2,935,560
|
||||||
|
U.S.
Treasury Notes -- due date 07/15/10, coupon 3.875%
|
(H
|
)
|
3,000,000
|
2,920,560
|
||||||
|
U.S.
Treasury Notes -- due date 10/15/10, coupon 4.25%
|
(H
|
)
|
2,000,000
|
1,969,060
|
||||||
|
Total
Investments in U.S. Government and Agency Securities (cost:
$59,212,598)
|
$
|
58,656,147
|
||||||||
|
Total
Investments (cost: $121,331,398)
|
$
|
112,323,978
|
||||||||
|
HARRIS
& HARRIS GROUP, INC.
CONSOLIDATED
SCHEDULE OF INVESTMENTS AS OF DECEMBER 31,
2006
|
|
(1)
|
Represents
a non-income producing security. Equity investments that have not
paid
dividends within the last 12 months are considered to be non-income
producing.
|
|
(2)
|
Legal
restrictions on sale of investment.
|
|
(3)
|
See
Footnote to Schedule of Investments for a description of the Valuation
Procedures.
|
|
(4)
|
Initial
investment was made during 2006.
|
|
(5)
|
These
investments are development stage companies. A development stage
company
is defined as a company that is devoting substantially all of its
efforts
to establishing a new business, and either it has not yet commenced
its
planned principal operations, or it has commenced such operations
but has
not realized significant revenue from
them.
|
|
(6)
|
Investments
in unaffiliated companies consist of investments in which we own
less than
five percent of the voting shares of the portfolio company. Investments
in
non-controlled affiliated companies consist of investments in which
we own
five percent or more, but less than 25 percent, of the voting shares
of
the portfolio company or where we hold one or more seats on the portfolio
company’s Board of Directors. Investments in controlled affiliated
companies consist of investments in which we own 25 percent or more
of the
voting shares of the portfolio
company.
|
|
(7)
|
The
aggregate cost for federal income tax purposes of investments in
unaffiliated companies is $18,107,124. The gross unrealized appreciation
based on the tax cost for these securities is $1,732,194. The gross
unrealized depreciation based on the tax cost for these securities
is
$2,059,591.
|
|
(8)
|
The
aggregate cost for federal income tax purposes of investments in
non-controlled affiliated companies is $39,571,676. The gross unrealized
appreciation based on the tax cost for these securities is $333,269.
The
gross unrealized depreciation based on the tax cost for these securities
is $7,776,891.
|
|
(9)
|
The
aggregate cost for federal income tax purposes of investments in
controlled affiliated companies is $4,400,000. The gross unrealized
appreciation based on the tax cost for these securities is $0. The
gross
unrealized depreciation based on the tax cost for these securities
is
$679,950.
|
|
(10)
|
Continuum
Photonics, Inc., merged with Polatis, Ltd., to form Polatis,
Inc.
|
|
(11)
|
BridgeLux,
Inc., was previously named eLite Optoelectronics,
Inc.
|
|
(12)
|
Mersana
Therapeutics, Inc., was previously named Nanopharma
Corp.
|
|
(13)
|
D-Wave
Systems, Inc., is located and is doing business primarily in Canada.
We
invested in D-Wave Systems, Inc., through D-Wave USA, a Delaware
company.
Our investment is denominated in Canadian dollars and is subject
to
foreign currency translation. Refer to Note 2 "Significant Accounting
Policies."
|
|
HARRIS
& HARRIS GROUP, INC.
CONSOLIDATED
SCHEDULE OF INVESTMENTS AS OF DECEMBER 31,
2005
|
|
Method
of
|
|
Shares/
|
|
|
|
|||||
|
|
|
Valuation
(3)
|
|
Principal
|
|
Value
|
||||
|
Investments
in Unaffiliated Companies (6)(7) - 13.2% of net
assets
|
||||||||||
|
Private
Placement Portfolio (Illiquid) - 13.2% of net
assets
|
||||||||||
|
AlphaSimplex
Group, LLC (2) -- Investment management company headed by
|
||||||||||
|
Dr.
Andrew W. Lo, holder of the Harris & Harris Group Chair at
MIT
|
||||||||||
|
Limited
Liability Company Interest
|
(B
|
)
|
--
|
$
|
16,315
|
|||||
|
Crystal
IS, Inc. (1)(2)(5) -- Developing a technology to grow
|
||||||||||
|
single-crystal
boules of aluminum nitride for gallium nitride
|
||||||||||
|
electronics
|
||||||||||
|
Series
A Convertible Preferred Stock
|
(A
|
)
|
274,100
|
199,983
|
||||||
|
Exponential
Business Development Company (1)(2) --
|
||||||||||
|
Venture
capital partnership focused on early stage companies
|
||||||||||
|
Limited
Partnership Interest
|
(B
|
)
|
--
|
0
|
||||||
|
Molecular
Imprints, Inc. (1)(2) -- Manufacturing nanoimprint lithography
|
||||||||||
|
capital
equipment
|
||||||||||
|
Series
B Convertible Preferred Stock
|
(A
|
)
|
1,333,333
|
2,000,000
|
||||||
|
Series
C Convertible Preferred Stock
|
(A
|
)
|
1,250,000
|
2,500,000
|
||||||
|
Warrants
at $2.00 expiring12/31/15
|
(B
|
)
|
125,000
|
0
|
||||||
|
4,500,000
|
||||||||||
|
Nanosys,
Inc. (1)(2)(5) -- Developing nanotechnology-enabled systems
|
||||||||||
|
incorporating
zero and one-dimensional inorganic
|
||||||||||
|
nanometer-scale
materials
|
||||||||||
|
Series
C Convertible Preferred Stock
|
(C
|
)
|
803,428
|
2,370,113
|
||||||
|
Series
D Convertible Preferred Stock
|
(C
|
)
|
1,016,950
|
3,000,003
|
||||||
|
5,370,116
|
||||||||||
|
Nantero,
Inc. (1)(2)(5) -- Developing a high-density, nonvolatile, random
|
||||||||||
|
access
memory chip, using nanotechnology
|
||||||||||
|
Series
A Convertible Preferred Stock
|
(C
|
)
|
345,070
|
1,046,908
|
||||||
|
Series
B Convertible Preferred Stock
|
(C
|
)
|
207,051
|
628,172
|
||||||
|
Series
C Convertible Preferred Stock
|
(C
|
)
|
188,315
|
571,329
|
||||||
|
2,246,409
|
||||||||||
|
HARRIS
& HARRIS GROUP, INC.
CONSOLIDATED
SCHEDULE OF INVESTMENTS AS OF DECEMBER 31,
2005
|
|
Method
of
|
Shares/
|
|
||||||||
|
|
Valuation
(3)
|
Principal
|
Value
|
|||||||
|
Investments
in Unaffiliated Companies (6)(7) - 13.2% of net assets
(cont.)
|
||||||||||
|
Private
Placement Portfolio (Illiquid) - 13.2% of net assets
(cont.)
|
||||||||||
|
NeoPhotonics
Corporation (1)(2) -- Developing and manufacturing
|
||||||||||
|
planar
optical devices and components
|
||||||||||
|
Common
Stock
|
(C
|
)
|
716,195
|
$
|
67,736
|
|||||
|
Series
1 Convertible Preferred Stock
|
(C
|
)
|
1,831,256
|
2,014,677
|
||||||
|
Series
2 Convertible Preferred Stock
|
(C
|
)
|
741,898
|
878,120
|
||||||
|
Warrants
at $0.15 expiring 01/26/10
|
(C
|
)
|
16,364
|
164
|
||||||
|
Warrants
at $0.15 expiring 12/05/10
|
(C
|
)
|
14,063
|
140
|
||||||
|
2,960,837
|
||||||||||
|
Polatis,
Inc. (1)(2)(5)(9) -- Developing optical networking
components
|
||||||||||
|
by
merging materials, MEMS and electronics technologies
|
||||||||||
|
Series
A-1 Convertible Preferred Stock
|
(B
|
)
|
16,775
|
47,828
|
||||||
|
Series
A-2 Convertible Preferred Stock
|
(B
|
)
|
71,611
|
204,172
|
||||||
|
252,000
|
||||||||||
|
Total
Unaffiliated Private Placement Portfolio (cost:
$15,469,546)
|
$
|
15,545,660
|
||||||||
|
Total
Investments in Unaffiliated Companies (cost:
$15,469,546)
|
$
|
15,545,660
|
||||||||
|
HARRIS
& HARRIS GROUP, INC.
CONSOLIDATED
SCHEDULE OF INVESTMENTS AS OF DECEMBER 31,
2005
|
|
Method
of
|
Shares/
|
|||||||||
|
Valuation
(3)
|
Principal
|
Value
|
||||||||
|
Investments
in Non-Controlled Affiliated Companies (6)(8) - 15.0% of net
assets
|
||||||||||
|
Private
Placement Portfolio (Illiquid)
- 15.0% of net assets
|
||||||||||
|
Cambrios
Technologies Corporation (1)(2)(5) -- Developing
commercially
|
||||||||||
|
relevant
materials by evolving biomolecules to express control over
|
||||||||||
|
nanostructure
synthesis
|
||||||||||
|
Series
B Convertible Preferred Stock
|
(A
|
)
|
1,294,025
|
$
|
1,294,025
|
|||||
|
Chlorogen,
Inc. (1)(2)(5) -- Developing patented chloroplast technology
|
||||||||||
|
to
produce plant-made proteins
|
||||||||||
|
Series
A Convertible Preferred Stock
|
(A
|
)
|
4,478,038
|
785,000
|
||||||
|
Series
B Convertible Preferred Stock
|
(A
|
)
|
2,077,930
|
364,261
|
||||||
|
1,149,261
|
||||||||||
|
CSwitch,
Inc. (1)(2)(5) -- Developing next-generation,
system-on-a-chip
|
||||||||||
|
solutions
for communications-based platforms
|
||||||||||
|
Series
A Convertible Preferred Stock
|
(B
|
)
|
1,000,000
|
500,000
|
||||||
|
eLite
Optoelectronics Inc. (1)(2)(4) -- Manufacturing high-power
light
|
||||||||||
|
emitting
diodes
|
||||||||||
|
Series
B Convertible Preferred Stock
|
(A
|
)
|
1,861,504
|
1,000,000
|
||||||
|
Kereos,
Inc. (1)(2)(4)(5) -- Developing molecular imaging agents
|
||||||||||
|
and
targeted therapeutics to image and treat cancer and
|
||||||||||
|
cardiovascular
disease
|
||||||||||
|
Series
B Convertible Preferred Stock
|
(A
|
)
|
349,092
|
960,000
|
||||||
|
Kovio
, Inc. (1)(2)(4)(5) -- Developing semi-conductor products
|
||||||||||
|
using
printed electronics and thin-film technologies
|
||||||||||
|
Series
C Convertible Preferred Stock
|
(A
|
)
|
2,500,000
|
3,000,000
|
||||||
|
Mersana
Therapeutics, Inc. (1)(2)(5)(10) -- Developing advanced
|
||||||||||
|
polymers
for drug delivery
|
||||||||||
|
Series
A Convertible Preferred Stock
|
(C
|
)
|
68,452
|
136,904
|
||||||
|
Series
B Convertible Preferred Stock
|
(C
|
)
|
616,500
|
1,233,000
|
||||||
|
Warrants
at $2.00 expiring 10/21/10
|
(B
|
)
|
91,625
|
0
|
||||||
|
1,369,904
|
||||||||||
|
HARRIS
& HARRIS GROUP, INC.
CONSOLIDATED
SCHEDULE OF INVESTMENTS AS OF DECEMBER 31,
2005
|
|
Method
of
|
|
Shares/
|
|
|
|
|||||
|
|
|
Valuation
(3)
|
|
Principal
|
|
Value
|
||||
|
Investments
in Non-Controlled Affiliated Companies (6)(8) - 15.0% of net assets
(cont.)
|
||||||||||
|
Private
Placement Portfolio (Illiquid)
- 15.0% of net assets (cont.)
|
||||||||||
|
NanoGram
Corporation (1)(2)(5) -- Developing a broad suite of intellectual
|
||||||||||
|
property
utilizing nanotechnology
|
||||||||||
|
Series
I Convertible Preferred Stock
|
(B
|
)
|
63,210
|
$
|
64,259
|
|||||
|
Series
II Convertible Preferred Stock
|
(B
|
)
|
1,250,904
|
1,271,670
|
||||||
|
1,335,929
|
||||||||||
|
Nanomix,
Inc. (1)(2)(5) -- Producing nanoelectronic sensors that
|
||||||||||
|
integrate
carbon nanotube electronics with silicon microstructures
|
||||||||||
|
Series
C Convertible Preferred Stock
|
(A
|
)
|
9,779,181
|
2,500,000
|
||||||
|
NanoOpto
Corporation (1)(2)(5) -- Manufacturing discrete and
integrated
|
||||||||||
|
optical
communications sub-components on a chip by utilizing
|
||||||||||
|
nano-manufacturing
technology
|
||||||||||
|
Series
A-1 Convertible Preferred Stock
|
(C
|
)
|
267,857
|
32,490
|
||||||
|
Series
B Convertible Preferred Stock
|
(C
|
)
|
3,819,935
|
1,110,073
|
||||||
|
Series
C Convertible Preferred Stock
|
(C
|
)
|
1,932,789
|
842,503
|
||||||
|
Warrants
at $0.4359 expiring 03/15/10
|
(C
|
)
|
193,279
|
0
|
||||||
|
1,985,066
|
||||||||||
|
Nextreme
Thermal Solutions, Inc. (1)(2)(5) -- Developing thin-film,
|
||||||||||
|
superlattice
thermoelectric devices
|
||||||||||
|
Series
A Convertible Preferred Stock
|
(A
|
)
|
500,000
|
500,000
|
||||||
|
Questech
Corporation (1)(2) -- Manufacturing and markets
|
||||||||||
|
proprietary
metal decorative tiles
|
||||||||||
|
Common
Stock
|
(C
|
)
|
646,954
|
724,588
|
||||||
|
Warrants
at $1.50 expiring 08/03/06
|
(B
|
)
|
8,500
|
0
|
||||||
|
Warrants
at $1.50 expiring 11/21/07
|
(B
|
)
|
3,750
|
0
|
||||||
|
Warrants
at $1.50 expiring 11/19/08
|
(B
|
)
|
5,000
|
0
|
||||||
|
Warrants
at $1.50 expiring 11/19/09
|
(B
|
)
|
5,000
|
0
|
||||||
|
724,588
|
||||||||||
|
HARRIS
& HARRIS GROUP, INC.
CONSOLIDATED
SCHEDULE OF INVESTMENTS AS OF DECEMBER 31,
2005
|
|
Method
of
|
Shares/
|
|||||||||
|
Valuation
(3)
|
Principal
|
Value
|
||||||||
|
Investments
in Non-Controlled Affiliated Companies (6)(8) - 15.0% of net assets
(cont.)
|
||||||||||
|
Private
Placement Portfolio (Illiquid)
- 15.0% of net assets (cont.)
|
||||||||||
|
Solazyme,
Inc. (1)(2)(5) -- Developing energy-harvesting
|
||||||||||
|
machinery
of photosynthetic microbes to produce industrial
|
||||||||||
|
and
pharmaceutical molecules
|
||||||||||
|
Series
A Convertible Preferred Stock
|
(C
|
)
|
988,204
|
$
|
385,400
|
|||||
|
Starfire
Systems, Inc. (1)(2)(5) --Producing ceramic-forming polymers
|
||||||||||
|
Common
Stock
|
(A
|
)
|
375,000
|
150,000
|
||||||
|
Series
A-1 Convertible Preferred Stock
|
(A
|
)
|
600,000
|
600,000
|
||||||
|
750,000
|
||||||||||
|
Zia
Laser, Inc. (1)(2)(4)(5) -- Developing quantum dot semiconductor
lasers
|
||||||||||
|
Series
C Convertible Preferred Stock
|
(B
|
)
|
1,500,000
|
187,500
|
||||||
|
Total
Non-Controlled Private Placement Portfolio (cost:
$22,236,796)
|
$
|
17,641,673
|
||||||||
|
Total
Investments in Non-Controlled Affiliated Companies (cost:
$22,236,796)
|
$
|
17,641,673
|
||||||||
|
U.S.
Government and Agency Securities - 81.5% of net
assets
|
||||||||||
|
U.S.
Treasury Bills -- due date 01/05/06
|
(J
|
)
|
24,500,000
|
$
|
24,495,590
|
|||||
|
U.S.
Treasury Notes -- due date 02/28/06, coupon 1.625%
|
(H
|
)
|
810,000
|
806,963
|
||||||
|
U.S.
Treasury Bills -- due date 03/02/06
|
(J
|
)
|
32,845,000
|
32,640,376
|
||||||
|
U.S.
Treasury Bills -- due date 03/16/06
|
(J
|
)
|
4,750,000
|
4,712,855
|
||||||
|
U.S.
Treasury Notes -- due date 03/31/06, coupon 1.5%
|
(H
|
)
|
4,616,000
|
4,586,965
|
||||||
|
U.S.
Treasury Notes -- due date 11/30/07, coupon 4.25%
|
(H
|
)
|
6,500,000
|
6,480,955
|
||||||
|
U.S.
Treasury Notes -- due date 02/15/08, coupon 3.375%
|
(H
|
)
|
9,000,000
|
8,814,690
|
||||||
|
U.S.
Treasury Notes -- due date 05/15/08, coupon 3.75%
|
(H
|
)
|
9,000,000
|
8,872,020
|
||||||
|
U.S.
Treasury Notes -- due date 09/15/08, coupon 3.125%
|
(H
|
)
|
5,000,000
|
4,840,450
|
||||||
|
Total
Investments in U.S. Government and Agency
|
||||||||||
|
Securities
(cost: $96,320,405)
|
$
|
96,250,864
|
||||||||
|
Total
Investments (cost: $134,026,747)
|
$
|
129,438,197
|
||||||||
|
HARRIS
& HARRIS GROUP, INC.
CONSOLIDATED
SCHEDULE OF INVESTMENTS AS OF DECEMBER
31, 2005
|
|
(1)
|
Represents
a non-income producing security. Equity investments that have not
paid
dividends within the last 12 months are considered to be non-income
producing.
|
|
(2)
|
Legal
restrictions on sale of investment.
|
|
(3)
|
See
Footnote to Schedule of Investments for a description of the Valuation
Procedures.
|
|
(4)
|
Initial
investment was made during 2005.
|
|
(5)
|
These
investments are development stage companies. A development stage
company
is defined as a company that is devoting substantially all of its
efforts
to establishing a new business, and either it has not yet commenced
its
planned principal operations, or it has commenced such operations
but has
not realized significant revenue from
them.
|
|
(6)
|
Investments
in unaffiliated companies consist of investments in which we own
less than
five percent of the voting shares of the portfolio company. Investments
in
non-controlled affiliated companies consist of investments in which
we own
five percent or more, but less than 25 percent, of the voting shares
of
the portfolio company or where we hold one or more seats on the portfolio
company’s Board of Directors. Investments in controlled affiliated
companies consist of investments in which we own 25 percent or more
of the
voting shares of the portfolio
company.
|
|
(7)
|
The
aggregate cost for federal income tax purposes of investments in
unaffiliated companies is $15,469,546. The gross unrealized appreciation
based on the tax cost for these securities is $1,732,194. The gross
unrealized depreciation based on the tax cost for these securities
is
$1,656,080.
|
|
(8)
|
The
aggregate cost for federal income tax purposes of investments in
non-controlled affiliated companies is $22,236,796. The gross unrealized
appreciation based on the tax cost for these securities is $313,534.
The
gross unrealized depreciation based on the tax cost for these securities
is $4,908,657.
|
|
(9)
|
Continuum
Photonics, Inc., merged with Polatis, Ltd., to form Polatis,
Inc.
|
|
(10)
|
Mersana
Therapeutics, Inc., was previously named Nanopharma
Corp.
|
|
HARRIS
& HARRIS GROUP, INC.
FOOTNOTE
TO CONSOLIDATED SCHEDULE OF
INVESTMENTS
|
|
NOTES
TO CONSOLIDATED FINANCIAL
STATEMENTS
|
|
Weighted
|
||||||||||||||||||||||
|
Average
|
||||||||||||||||||||||
|
Number
|
Expected
|
Expected
|
Expected
|
Risk-free
|
Fair
|
|||||||||||||||||
|
of
Options
|
Term
|
Volatility
|
Dividend
|
Interest
|
Value
|
|||||||||||||||||
|
Type
of Award
|
Term
|
Granted
|
in
Yrs
|
Factor
|
Yield
|
Rates
|
Per
Share
|
|||||||||||||||
|
Non-qualified
stock options
|
1
Year
|
1,001,017
|
0.75
|
37.4%
|
|
0%
|
|
5.16%
|
|
$
|
1.48
|
|||||||||||
|
Non-qualified
stock options
|
2
Years
|
815,000
|
1.625
|
45.2%
|
|
0%
|
|
5.12%
|
|
$
|
2.63
|
|||||||||||
|
Non-qualified
stock options
|
3
Years
|
659,460
|
2.42
|
55.7%
|
|
0%
|
|
5.09%
|
|
$
|
3.81
|
|||||||||||
|
Non-qualified
stock options
|
10
Years
|
690,000
|
5.75
|
75.6%
|
|
0%
|
|
5.08%
|
|
$
|
6.94
|
|||||||||||
|
Incentive
stock options
|
10
Years
|
792,806
|
7.03
|
75.6%
|
|
0%
|
|
5.08%
|
|
$
|
7.46
|
|||||||||||
|
Total
|
3,958,283
|
$
|
4.25
|
|||||||||||||||||||
|
|
|
|
|
|
|
Weighted
|
|
|
|
|||||||
|
|
|
|
|
Weighted
|
|
Weighted
|
|
Average
|
|
|
|
|||||
|
|
|
|
|
Average
|
|
Average
|
|
Remaining
|
|
Aggregate
|
|
|||||
|
|
|
|
|
Exercise
|
|
Grant
Date
|
|
Contractual
|
|
Intrinsic
|
|
|||||
|
|
|
Shares
|
|
Price
|
|
Fair
Value
|
|
Term
(Yrs)
|
|
Value
|
|
|||||
|
Options
Outstanding at June 1, 2006
|
-
|
|||||||||||||||
|
Granted
|
3,958,283
|
$
|
10.11
|
$
|
4.25
|
|||||||||||
|
Exercised
|
258,672
|
$
|
10.11
|
$
|
1.79
|
$
|
512,171
|
|||||||||
|
Forfeited
or Expired
|
-
|
|
||||||||||||||
|
Options
Outstanding at December 31, 2006
|
3,699,611
|
$
|
10.11
|
$
|
4.43
|
4.64
|
$
|
7,325,230
|
||||||||
|
Options
Exercisable at December 31, 2006
|
1,067,029
|
$
|
10.11
|
$
|
3.11
|
3.11
|
$
|
2,112,717
|
||||||||
|
Options
Exercisable and Expected to be
Exercisable
at December 31, 2006
|
3,531,996
|
$
|
10.11
|
$
|
4.28
|
4.41
|
$
|
6,993,352
|
||||||||
|
2006
|
2005
|
||||||
|
Accumulated
Postretirement Benefit
|
|||||||
|
Obligation
at Beginning of Year
|
$
|
675,334
|
$
|
546,090
|
|||
|
Service
Cost
|
79,381
|
49,990
|
|||||
|
Interest
Cost
|
33,786
|
32,573
|
|||||
|
Actuarial
(Gain)/Loss
|
(84,879
|
)
|
57,091
|
||||
|
Benefits
Paid
|
(6,795
|
)
|
(10,410
|
)
|
|||
|
Accumulated
Postretirement
|
|||||||
|
Benefit
Obligation at End of Year
|
$
|
696,827
|
$
|
675,334
|
|||
|
|
1%
Decrease
|
|
Assumed
|
|
1%
Increase
|
|
||||
|
|
|
in
Rates
|
|
Rates
|
|
in
Rates
|
||||
|
Aggregated
Service and Interest Cost
|
$
|
93,584
|
$
|
113,167
|
$
|
132,289
|
||||
|
Accumulated
Postretirement Benefit Obligation
|
$
|
602,552
|
$
|
696,827
|
$
|
780,977
|
||||
|
|
|
2006
|
|
2005
|
|
2004
|
||||
|
Service
Cost
|
$
|
79,381
|
$
|
49,990
|
$
|
60,788
|
||||
|
Interest
Cost on Accumulated Postretirement
|
||||||||||
|
Benefit
Obligation
|
33,786
|
32,573
|
26,343
|
|||||||
|
Amortization
of Transition Obligation
|
0
|
0
|
0
|
|||||||
|
Amortization
of Net (Gain)/Loss
|
0
|
0
|
0
|
|||||||
|
Net
Periodic Post Retirement Benefit Cost
|
$
|
113,167
|
$
|
82,563
|
$
|
87,131
|
||||
|
2007
|
$
|
16,968
|
||
|
2008
|
$
|
25,388
|
||
|
2009
|
$
|
27,093
|
||
|
2010
|
$
|
24,781
|
||
|
2011
|
$
|
26,465
|
||
|
2012
through 2016
|
$
|
162,990
|
|
2006
|
|
2005
|
|
2004
|
||||||
|
Investment
operations
|
$
|
0
|
$
|
0
|
$
|
0
|
||||
|
Realized
income on investments
|
(227,355
|
)
|
1,530,881
|
(44,509
|
)
|
|||||
|
Taxes
paid on behalf of shareholders
|
0
|
8,122,367
|
0
|
|||||||
|
Increase
(decrease) in unrealized
|
||||||||||
|
appreciation
on investments
|
(
0
|
)
|
(1,364,470
|
)
|
695,126
|
|||||
|
Total
income tax (benefit) expense
|
$
|
(227,355
|
)
|
$
|
8,288,778
|
$
|
650,617
|
|||
|
The
above tax expense consists of the following:
|
||||||||||
|
2006
|
2005
|
2004
|
||||||||
|
Current
|
$
|
(227,355
|
)
|
$
|
9,653,248
|
$
|
(44,509
|
)
|
||
|
Deferred
-- Federal
|
0
|
(1,364,470
|
)
|
695,126
|
||||||
|
Total
income tax (benefit) expense
|
$
|
(227,355
|
)
|
$
|
8,288,778
|
$
|
650,617
|
|||
|
2006
|
|||||||||||||
|
|
1st
Quarter
|
|
2nd
Quarter
|
|
3rd
Quarter
|
|
4th
Quarter
|
||||||
|
Total
investment income
|
$
|
804,862
|
$
|
785,265
|
$
|
719,619
|
$
|
719,015
|
|||||
|
Net
operating loss
|
$
|
(767,743
|
)
|
$
|
(693,887
|
)
|
$
|
(2,988,790
|
)
|
$
|
(3,162,515
|
)
|
|
|
Net
increase (decrease) in net
|
|||||||||||||
|
assets
resulting from operations
|
$
|
(1,653,990
|
)
|
$
|
(1,282,997
|
)
|
$
|
(2,588,092
|
)
|
$
|
(6,248,033
|
)
|
|
|
Net
(decrease) increase in net
|
|||||||||||||
|
assets
resulting from operations
|
|||||||||||||
|
per
average outstanding share
|
$
|
($0.08
|
)
|
$
|
(0.06
|
)
|
$
|
(0.12
|
)
|
$
|
(0.31
|
)
|
|
|
2005
|
|||||||||||||
|
|
|
|
|
|
|||||||||
|
|
1st
Quarter
|
2nd
Quarter
|
3rd
Quarter
|
4th
Quarter
|
|||||||||
|
Total
investment income
|
$
|
260,108
|
$
|
158,717
|
$
|
315,374
|
$
|
801,662
|
|||||
|
Net
operating loss
|
$
|
(745,590
|
)
|
$
|
(3,302,094
|
)
|
$
|
(3,273,797
|
)
|
$
|
1,851,274
|
||
|
Net
increase (decrease) in net
|
|||||||||||||
|
assets
resulting from operations
|
$
|
(2,233,447
|
)
|
$
|
7,001,847
|
$
|
7,336,923
|
$
|
(5,388,947
|
)
|
|||
|
Net
(decrease) increase in net
|
|||||||||||||
|
assets
resulting from operations
|
|||||||||||||
|
per
average outstanding share
|
$
|
(0.13
|
)
|
$
|
0.41
|
$
|
0.40
|
$
|
(0.26
|
)
|
|||
|
HARRIS
& HARRIS GROUP, INC.
FINANCIAL
HIGHLIGHTS
|
|
|
Year
Ended
|
Year
Ended
|
Year
Ended
|
|||||||
|
|
December
31, 2006
|
December
31, 2005
|
December
31, 2004
|
|||||||
|
Per
Share Operating Performance
|
||||||||||
|
Net
asset value per share, beginning of year
|
$
|
5.68
|
$
|
4.33
|
$
|
2.95
|
||||
|
Net
operating (loss) income*
|
(0.37
|
)
|
(0.30
|
)
|
(0.22
|
)
|
||||
|
Net
realized income (loss) on investments*
|
0.01
|
0.77
|
0.06
|
|||||||
|
Net
increase (decrease) in unrealized
|
||||||||||
|
appreciation
(depreciation) as a
|
||||||||||
|
result
of sales*
|
(1.18
|
)
|
0.06
|
|||||||
|
Net
increase (decrease) in unrealized
|
||||||||||
|
appreciation
(depreciation) on
|
||||||||||
|
investments
held*
|
(0.21
|
)
|
1.07
|
(0.03
|
)
|
|||||
|
Total
from investment operations*
|
(0.57
|
)
|
0.36
|
(0.13
|
)
|
|||||
|
Net
increase as a result of stock-
|
||||||||||
|
based
compensation
|
0.24
|
0
|
0
|
|||||||
|
Net
increase as a result of proceeds
|
||||||||||
|
from
exercise of options
|
0.07
|
0
|
0
|
|||||||
|
Net
increase as a result of stock
|
||||||||||
|
offering
|
0
|
0.99
|
1.51
|
|||||||
|
Total
increase from capital
|
||||||||||
|
stock
transactions
|
0.31
|
0.99
|
1.51
|
|||||||
|
Net
asset value per share, end of year
|
$
|
5.42
|
$
|
5.68
|
$
|
4.33
|
||||
|
Stock
price per share, end of year
|
$
|
12.09
|
$
|
13.90
|
$
|
16.38
|
||||
|
Total
return based on stock price(1)
|
(13.0
|
)%
|
(15.1
|
)%
|
42.1
|
%
|
||||
|
Supplemental
Data:
|
||||||||||
|
Net
assets, end of year
|
$
|
113,930,303
|
$
|
117,987,742
|
$
|
74,744,799
|
||||
|
Ratio
of expenses to average net assets(1)
|
9.2
|
%
|
7.5
|
%
|
7.4
|
%
|
||||
|
Ratio
of net operating loss to
|
||||||||||
|
average
net assets(1)
|
(6.6
|
)%
|
(5.8
|
)%
|
(6.3
|
)%
|
||||
|
Cash
dividends paid per share
|
$
|
0.00
|
$
|
0.00
|
$
|
0.00
|
||||
|
Taxes
payable on behalf of shareholders
|
||||||||||
|
on
the deemed dividend per share
|
$
|
0
|
$
|
0.39
|
$
|
0.00
|
||||
|
Number
of shares outstanding, end of year
|
21,015,017
|
20,756,345
|
17,248,845
|
|||||||
|
(1)
|
Listed
below are the financial statements which are filed as part of this
report:
|
| · |
Consolidated
Statements of Assets and Liabilities as of December 31, 2006, and
2005;
|
| · |
Consolidated
Statements of Operations for the years ended December 31, 2006, 2005,
and
2004;
|
| · |
Consolidated
Statements of Cash Flows for the years ended December 31, 2006, 2005,
and
2004;
|
| · |
Consolidated
Statements of Changes in Net Assets for the years ended December
31, 2006,
2005, and 2004;
|
| · |
Consolidated
Schedule of Investments as of December 31,
2006;
|
| · |
Footnote
to Consolidated Schedule of
Investments;
|
| · |
Consolidated
Schedule of Investments as of December 31,
2005;
|
| · |
Footnote
to Consolidated Schedule of
Investments;
|
| · |
Notes
to Consolidated Financial Statements;
and
|
| · |
Financial
Highlights for the years ended December 31, 2006, 2005, and
2004.
|
|
(2)
|
No
financial statement schedules are required to be filed herewith because
(i) such schedules are not required or (ii) the information has been
presented in the above financial
statements.
|
|
(3)
|
The
following exhibits are filed with this report or are incorporated
herein
by reference to a prior filing, in accordance with Rule 12b-32 under
the
Securities Exchange Act of 1934.
|
|
3.1(a)
|
Restated
Certificate of Incorporation of Harris & Harris Group, Inc., dated
September 23, 2005, incorporated by reference as Exhibit 99 to Form
8-K
filed on September 27, 2005.
|
|
3.1(b)
|
Certificate
of Amendment of the Certificate of Incorporation of Harris & Harris
Group, Inc., dated May 19, 2006, incorporated by reference as Exhibit
3.1
to the Company's Form 10-Q filed on August 9,
2006.
|
|
3.1(c)
|
Restated
By-laws, incorporated by reference as Exhibit B to Pre-Effective
Amendment
No.1 to the Company's Registration Statement on Form N-2 (333-112862)
filed on March 22, 2004.
|
|
4.1
|
Form
of Specimen Certificate of Common Stock, incorporated by reference
to
Exhibit D to the Company's Registration Statement on Form N-2
(333-138996)
filed November 29,
2006.
|
|
10.1
|
Harris
& Harris Group, Inc. Custodian Agreement with JP Morgan, incorporated
by reference as Exhibit J to Pre-Effective Amendment No. 1 to the
Company's Registration Statement on Form N-2 (File No. 333-112862)
filed
on March 22, 2004.
|
|
10.2
|
Severance
Compensation Agreement by and between the Company and Charles E.
Harris
dated August 15, 1990, incorporated by reference as Exhibit I(4)
to
Pre-Effective Amendment No. 1 to the Company's Registration Statement
on
Form N-2 (File No. 333-112862) filed on March 22,
2004.
|
|
10.3
|
Form
of Indemnification Agreement which has been established with all
directors
and executive officers of the Company, incorporated by reference
as
Exhibit I(7) to Pre-Effective Amendment No. 1 to the Company's
Registration Statement on Form N-2 (File No. 333-112862) filed on
March
22, 2004.
|
|
10.4
|
Amended
and Restated Employment Agreement by and between Harris & Harris
Group, Inc. and Charles E. Harris, dated October 14, 2004, incorporated
by
reference as Exhibit 10.2 to the Company's Form 8-K filed on October
15,
2004.
|
|
10.5
|
Deferred
Compensation Agreement, incorporated by reference as Exhibit 10.5
to the
Company's Form 10-K for the year ended December 31, 2004, filed on
March
16, 2005.
|
|
10.6
|
Amendment
No. 4 to Deferred Compensation Agreement, incorporated by reference
as
Exhibit 10 to the Company's Form 10-Q filed on August 9,
2006.
|
|
10.7
|
Amendment
No. 2 to Deferred Compensation Agreement, incorporated by reference
as
Exhibit 10.1 to the Company's Form 8-K filed on October 15,
2004.
|
|
10.8
|
Amendment
No. 1 to Deferred Compensation Agreement, incorporated by reference
as
Exhibit 10.2 to the Company's Form 10-Q filed on May 14,
2003.
|
|
10.9
|
Trust
Under Harris & Harris Group, Inc., Deferred Compensation Agreement,
incorporated by reference as Exhibit I(12) to the Company's Registration
Statement on Form N-2 (File No. 333-138996) filed on November 29,
2006.
|
|
HARRIS
& HARRIS GROUP, INC.
|
||
|
Date:
March 15, 2007
|
By:
|
/s/
Charles E. Harris
|
|
Charles
E. Harris
|
||
|
|
Chairman
of the Board
|
|
|
Signatures
|
Title
|
Date
|
||
|
/s/
Charles E. Harris
|
Chairman
of the Board
|
March
15, 2007
|
||
|
Charles
E. Harris
|
and
Chief Executive Officer
|
|||
|
|
||||
|
/s/
Douglas W. Jamison
|
President,
Chief Operating
|
March
15, 2007
|
||
|
Douglas
W. Jamison
|
Officer,
and Chief Financial Officer
|
|||
|
/s/
Patricia N. Egan
|
Chief
Accounting Officer
|
March
15, 2007
|
||
|
Patricia
N. Egan
|
and
Senior Controller
|
|||
|
/s/
W. Dillaway Ayres, Jr.
|
Director
|
March
15, 2007
|
||
|
W.
Dillaway Ayres, Jr.
|
||||
|
/s/
C. Wayne Bardin
|
Director
|
March
15, 2007
|
||
|
C.
Wayne Bardin
|
||||
|
/s/
Phillip A. Bauman
|
Director
|
March
15, 2007
|
||
|
Phillip
A. Bauman
|
||||
|
/s/
G. Morgan Browne
|
Director
|
March
15, 2007
|
||
|
G.
Morgan Browne
|
||||
|
/s/
Dugald A. Fletcher
|
Director
|
March
15, 2007
|
||
|
Dugald
A. Fletcher
|
||||
|
/s/
Kelly S. Kirkpatrick
|
Director
|
March
15, 2007
|
||
|
Kelly
S. Kirkpatrick
|
||||
|
/s/
Mark A. Parsells
|
Director
|
March
15, 2007
|
||
|
Mark
A. Parsells
|
||||
|
/s/
Lori D. Pressman
|
Director
|
March
15, 2007
|
||
|
Lori
D. Pressman
|
||||
|
/s/
Charles E. Ramsey
|
Director
|
March
15, 2007
|
||
|
Charles
E. Ramsey
|
||||
|
/s/
James E. Roberts
|
Director
|
March
15, 2007
|
||
|
James
E. Roberts
|
||||
|
Director
|
||||
|
Richard
P. Shanley
|
|
Exhibit
No.
|
Description
|
|
|
31.01
|
Certification
of CEO pursuant to Section 302 of the Sarbanes-Oxley Act of
2002.
|
|
|
31.02
|
Certification
of CFO pursuant to Section 302 of the Sarbanes-Oxley Act of
2002.
|
|
|
32.01
|
Certification
of CEO and CFO pursuant to 18 U.S.C. Section 1350, as adopted pursuant
to
Section 906 of the Sarbanes-Oxley Act of
2002.
|